LightNeedle - RJ Laser
LightNeedle - RJ Laser
LightNeedle - RJ Laser

Create successful ePaper yourself
Turn your PDF publications into a flip-book with our unique Google optimized e-Paper software.
stimulated for 10 seconds. Thereafter, the laser was activated for 10 minutes or the<br />
needles were left alone. The maximum amplitude of O 2Hb and HHb (phase during<br />
acupuncture) was analyzed during this period of time. Randomized selection of<br />
which technique should be started with, as well as selection of sequence of the<br />
particular type of stimulation (body, ear, hand, combination) was done. The resting<br />
period between each investigation was at least 30 minutes.<br />
Statistical analysis<br />
Data was analyzed with the computer program SigmaStat (Jandel Scientific Corp.,<br />
Erkrath, Germany). Results from the phases before (=zeropoint calibration), during<br />
and 5 minutes after needle acupuncture or of laserneedle acupuncture are shown in<br />
the diagrams as mean values, respectively.<br />
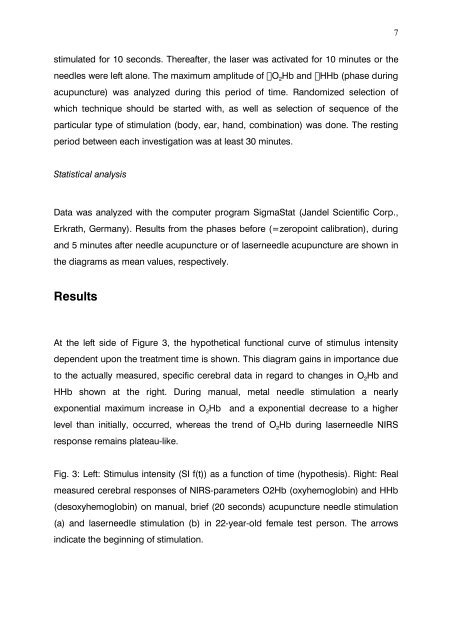
Results<br />
At the left side of Figure 3, the hypothetical functional curve of stimulus intensity<br />
dependent upon the treatment time is shown. This diagram gains in importance due<br />
to the actually measured, specific cerebral data in regard to changes in O 2Hb and<br />
HHb shown at the right. During manual, metal needle stimulation a nearly<br />
exponential maximum increase in O 2Hb and a exponential decrease to a higher<br />
level than initially, occurred, whereas the trend of O 2Hb during laserneedle NIRS<br />
response remains plateau-like.<br />
Fig. 3: Left: Stimulus intensity (SI f(t)) as a function of time (hypothesis). Right: Real<br />
measured cerebral responses of NIRS-parameters O2Hb (oxyhemoglobin) and HHb<br />
(desoxyhemoglobin) on manual, brief (20 seconds) acupuncture needle stimulation<br />
(a) and laserneedle stimulation (b) in 22-year-old female test person. The arrows<br />
indicate the beginning of stimulation.<br />
7