- Page 2 and 3:
Foreword Preface Contents 1. Real N
- Page 4 and 5:
xi 9. Some Applications of Trigonom
- Page 6 and 7:
REAL NUMBERS 1 1.1 Introduction In
- Page 8 and 9:
REAL NUMBERS 3 moment we write down
- Page 10 and 11:
REAL NUMBERS 5 This algorithm works
- Page 12 and 13:
REAL NUMBERS 7 EXERCISE 1.1 1. Use
- Page 14 and 15:
REAL NUMBERS 9 An equivalent versio
- Page 16 and 17:
REAL NUMBERS 11 So, HCF (6, 72, 120
- Page 18 and 19:
3 = a b ✂ REAL NUMBERS 13 Substit
- Page 20 and 21:
REAL NUMBERS 15 1.5 Revisiting Rati
- Page 22 and 23:
REAL NUMBERS 17 We are now ready to
- Page 24 and 25:
REAL NUMBERS 19 You have seen that
- Page 26 and 27:
POLYNOMIALS 21 a cubic polynomial a
- Page 28 and 29:
POLYNOMIALS 23 Table 2.1 x - 2 -1 0
- Page 30 and 31:
POLYNOMIALS 25 Case (iii) : Here, t
- Page 32 and 33:
POLYNOMIALS 27 Note that 0 is the o
- Page 34 and 35:
a = k, b =- k(✞ + ✟) and c = k
- Page 36 and 37:
POLYNOMIALS 31 Example 4 : Find a q
- Page 38 and 39:
POLYNOMIALS 33 EXERCISE 2.2 1. Find
- Page 40 and 41:
POLYNOMIALS 35 Solution : Note that
- Page 42 and 43:
POLYNOMIALS 37 3. If the zeroes of
- Page 44 and 45:
PAIR OF LINEAR EQUATIONS IN TWO VAR
- Page 46 and 47:
PAIR OF LINEAR EQUATIONS IN TWO VAR
- Page 48 and 49:
PAIR OF LINEAR EQUATIONS IN TWO VAR
- Page 50 and 51:
PAIR OF LINEAR EQUATIONS IN TWO VAR
- Page 52 and 53:
PAIR OF LINEAR EQUATIONS IN TWO VAR
- Page 54 and 55:
PAIR OF LINEAR EQUATIONS IN TWO VAR
- Page 56 and 57:
PAIR OF LINEAR EQUATIONS IN TWO VAR
- Page 58 and 59:
PAIR OF LINEAR EQUATIONS IN TWO VAR
- Page 60 and 61:
PAIR OF LINEAR EQUATIONS IN TWO VAR
- Page 62 and 63:
PAIR OF LINEAR EQUATIONS IN TWO VAR
- Page 64 and 65:
PAIR OF LINEAR EQUATIONS IN TWO VAR
- Page 66 and 67:
PAIR OF LINEAR EQUATIONS IN TWO VAR
- Page 68 and 69:
PAIR OF LINEAR EQUATIONS IN TWO VAR
- Page 70 and 71:
PAIR OF LINEAR EQUATIONS IN TWO VAR
- Page 72 and 73:
PAIR OF LINEAR EQUATIONS IN TWO VAR
- Page 74 and 75:
PAIR OF LINEAR EQUATIONS IN TWO VAR
- Page 76 and 77:
QUADRATIC EQUATIONS 71 Sridharachar
- Page 78 and 79:
QUADRATIC EQUATIONS 73 (ii) Since x
- Page 80 and 81:
QUADRATIC EQUATIONS 75 Note that we
- Page 82 and 83:
QUADRATIC EQUATIONS 77 Therefore, (
- Page 84 and 85:
QUADRATIC EQUATIONS 79 So, 9x 2 - 1
- Page 86 and 87:
QUADRATIC EQUATIONS 81 Therefore, t
- Page 88 and 89:
QUADRATIC EQUATIONS 83 If b 2 - 4ac
- Page 90 and 91:
QUADRATIC EQUATIONS 85 x = 3 25 2 B
- Page 92 and 93:
QUADRATIC EQUATIONS 87 Example 15 :
- Page 94 and 95:
QUADRATIC EQUATIONS 89 b b b If b 2
- Page 96 and 97:
QUADRATIC EQUATIONS 91 EXERCISE 4.4
- Page 98 and 99:
ARITHMETIC PROGRESSIONS 5 5.1 Intro
- Page 100 and 101:
ARITHMETIC PROGRESSIONS 95 In the e
- Page 102 and 103:
ARITHMETIC PROGRESSIONS 97 Similarl
- Page 104 and 105:
ARITHMETIC PROGRESSIONS 99 (iv) a 2
- Page 106 and 107:
ARITHMETIC PROGRESSIONS 101 Now, lo
- Page 108 and 109:
ARITHMETIC PROGRESSIONS 103 Example
- Page 110 and 111:
ARITHMETIC PROGRESSIONS 105 It is a
- Page 112 and 113:
ARITHMETIC PROGRESSIONS 107 17. Fin
- Page 114 and 115:
ARITHMETIC PROGRESSIONS 109 Here, a
- Page 116 and 117:
ARITHMETIC PROGRESSIONS 111 Therefo
- Page 118 and 119:
ARITHMETIC PROGRESSIONS 113 4. How
- Page 120 and 121:
ARITHMETIC PROGRESSIONS 115 EXERCIS
- Page 122 and 123:
TRIANGLES 6 6.1 Introduction You ar
- Page 124 and 125:
TRIANGLES 119 What can you say abou
- Page 126 and 127:
TRIANGLES 121 From the above, you c
- Page 128 and 129:
TRIANGLES 123 6.3 Similarity of Tri
- Page 130 and 131:
TRIANGLES 125 Therefore, from (1),
- Page 132 and 133:
TRIANGLES 127 Example 2 : ABCD is a
- Page 134 and 135:
TRIANGLES 129 5. In Fig. 6.20, DE |
- Page 136 and 137:
TRIANGLES 131 Let rays BP and CQ in
- Page 138 and 139:
TRIANGLES 133 Cut DP = AB and DQ =
- Page 140 and 141:
TRIANGLES 135 Now, PQ || EF and ABC
- Page 142 and 143:
TRIANGLES 137 Now, BD = 1.2 m × 4
- Page 144 and 145:
TRIANGLES 139 Fig. 6.34 2. In Fig.
- Page 146 and 147:
TRIANGLES 141 11. In Fig. 6.40, E i
- Page 148 and 149:
TRIANGLES 143 Example 9 : In Fig. 6
- Page 150 and 151:
TRIANGLES 145 So, from (1) and (2),
- Page 152 and 153:
TRIANGLES 147 So, ✁ ✂ ✂ ✂ B
- Page 154 and 155:
TRIANGLES 149 or, BL 2 = ✄ AC 2
- Page 156 and 157:
TRIANGLES 151 8. In Fig. 6.54, O is
- Page 158 and 159:
TRIANGLES 153 (ii) AB 2 = AD 2 - BC
- Page 160 and 161:
COORDINATE GEOMETRY 7 7.1 Introduct
- Page 162 and 163:
COORDINATE GEOMETRY 157 Therefore,
- Page 164 and 165:
COORDINATE GEOMETRY 159 Also, PQ 2
- Page 166 and 167:
COORDINATE GEOMETRY 161 So, the req
- Page 168 and 169:
COORDINATE GEOMETRY 163 Draw AR, PS
- Page 170 and 171:
COORDINATE GEOMETRY 165 Therefore,
- Page 172 and 173:
COORDINATE GEOMETRY 167 EXERCISE 7.
- Page 174 and 175:
COORDINATE GEOMETRY 169 Example 11
- Page 176 and 177:
COORDINATE GEOMETRY 171 EXERCISE 7.
- Page 178 and 179:
INTRODUCTION TO TRIGONOMETRY 8 8.1
- Page 180 and 181:
INTRODUCTION TO TRIGONOMETRY 175 No
- Page 182 and 183:
INTRODUCTION TO TRIGONOMETRY 177 Fr
- Page 184 and 185:
INTRODUCTION TO TRIGONOMETRY 179 Th
- Page 186 and 187:
INTRODUCTION TO TRIGONOMETRY 181 EX
- Page 188 and 189:
INTRODUCTION TO TRIGONOMETRY 183 As
- Page 190 and 191:
INTRODUCTION TO TRIGONOMETRY 185 Ta
- Page 192 and 193:
INTRODUCTION TO TRIGONOMETRY 187 1.
- Page 194 and 195:
INTRODUCTION TO TRIGONOMETRY 189 Ex
- Page 196 and 197:
INTRODUCTION TO TRIGONOMETRY 191 Is
- Page 198 and 199:
INTRODUCTION TO TRIGONOMETRY 193 =
- Page 200 and 201:
SOME APPLICATIONS OF TRIGONOMETRY 9
- Page 202 and 203:
SOME APPLICATIONS OF TRIGONOMETRY 1
- Page 204 and 205:
SOME APPLICATIONS OF TRIGONOMETRY 1
- Page 206 and 207:
SOME APPLICATIONS OF TRIGONOMETRY 2
- Page 208 and 209:
SOME APPLICATIONS OF TRIGONOMETRY 2
- Page 210 and 211:
SOME APPLICATIONS OF TRIGONOMETRY 2
- Page 212 and 213:
CIRCLES 207 You might have seen a p
- Page 214 and 215:
CIRCLES 209 Take a point Q on XY ot
- Page 216 and 217:
CIRCLES 211 Theorem 10.2 : The leng
- Page 218 and 219:
CIRCLES 213 Now, TPR + RPO = 90° =
- Page 220 and 221:
CIRCLES 215 10.4 Summary In this ch
- Page 222 and 223:
CONSTRUCTIONS 217 Let us see how th
- Page 224 and 225:
CONSTRUCTIONS 219 Solution : Given
- Page 226 and 227:
CONSTRUCTIONS 221 Steps of Construc
- Page 228 and 229:
AREAS RELATED TO CIRCLES 12 12.1 In
- Page 230 and 231: AREAS RELATED TO CIRCLES 225 You ca
- Page 232 and 233: AREAS RELATED TO CIRCLES 227 In a w
- Page 234 and 235: AREAS RELATED TO CIRCLES 229 Soluti
- Page 236 and 237: AREAS RELATED TO CIRCLES 231 10. An
- Page 238 and 239: AREAS RELATED TO CIRCLES 233 Altern
- Page 240 and 241: AREAS RELATED TO CIRCLES 235 2. Fin
- Page 242 and 243: AREAS RELATED TO CIRCLES 237 11. On
- Page 244 and 245: SURFACE AREAS AND VOLUMES 13 13.1 I
- Page 246 and 247: SURFACE AREAS AND VOLUMES 241 First
- Page 248 and 249: SURFACE AREAS AND VOLUMES 243 Examp
- Page 250 and 251: SURFACE AREAS AND VOLUMES 245 7. A
- Page 252 and 253: SURFACE AREAS AND VOLUMES 247 Examp
- Page 254 and 255: SURFACE AREAS AND VOLUMES 249 How a
- Page 256 and 257: ✁ ✂ ✂ ☎ ✄ SURFACE AREAS A
- Page 258 and 259: SURFACE AREAS AND VOLUMES 253 How c
- Page 260 and 261: SURFACE AREAS AND VOLUMES 255 So, t
- Page 262 and 263: SURFACE AREAS AND VOLUMES 257 Now,
- Page 264 and 265: SURFACE AREAS AND VOLUMES 259 3. Gi
- Page 266 and 267: STATISTICS 261 x = n ✁ fx i 1 n i
- Page 268 and 269: STATISTICS 263 Table 14.3 Class int
- Page 270 and 271: STATISTICS 265 Substituting the val
- Page 272 and 273: STATISTICS 267 Example 2 : The tabl
- Page 274 and 275: STATISTICS 269 Example 3 : The dist
- Page 276 and 277: STATISTICS 271 4. Thirty women were
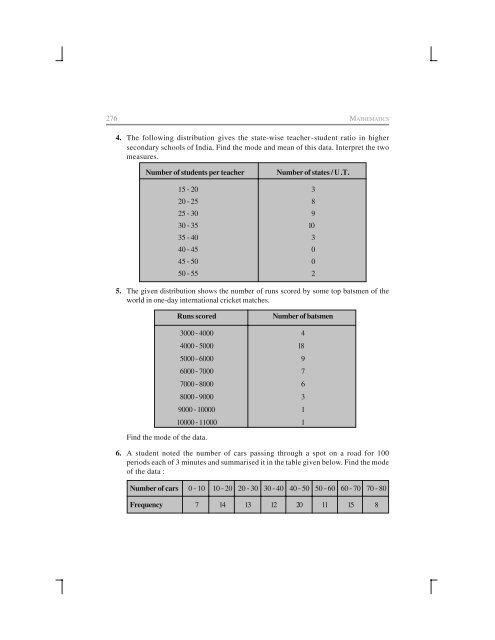
- Page 278 and 279: STATISTICS 273 Clearly, 2 is the nu
- Page 282 and 283: STATISTICS 277 14.4 Median of Group
- Page 284 and 285: STATISTICS 279 From the table above
- Page 286 and 287: STATISTICS 281 Table 14.14 Marks ob
- Page 288 and 289: STATISTICS 283 Example 7 : A survey
- Page 290 and 291: STATISTICS 285 Solution : Class int
- Page 292 and 293: STATISTICS 287 EXERCISE 14.3 1. The
- Page 294 and 295: STATISTICS 289 5. The following tab
- Page 296 and 297: STATISTICS 291 Remark : Note that b
- Page 298 and 299: STATISTICS 293 EXERCISE 14.4 1. The
- Page 300 and 301: PROBABILITY 15 The theory of probab
- Page 302 and 303: PROBABILITY 297 For another example
- Page 304 and 305: PROBABILITY 299 Solution : Kritika
- Page 306 and 307: PROBABILITY 301 That is, the probab
- Page 308 and 309: PROBABILITY 303 Example 7 : There a
- Page 310 and 311: PROBABILITY 305 Let E be the event
- Page 312 and 313: PROBABILITY 307 4 6 5 4 6 5 1 2 3 4
- Page 314 and 315: PROBABILITY 309 10. A piggy bank co
- Page 316 and 317: PROBABILITY 311 25. Which of the fo
- Page 318 and 319: ANSWERS/HINTS EXERCISE 1.1 1. (i) 4
- Page 320 and 321: ANSWERS/HINTS 347 his daughter. To
- Page 322 and 323: ANSWERS/HINTS 349 EXERCISE 3.5 1. (
- Page 324 and 325: ANSWERS/HINTS 351 5. Marks in mathe
- Page 326 and 327: ANSWERS/HINTS 353 n 4. 12. By putti
- Page 328 and 329: ANSWERS/HINTS 355 3. 61m; 5th line
- Page 330 and 331:
ANSWERS/HINTS 357 5. 40 3 m 6. 19 3
- Page 332 and 333:
ANSWERS/HINTS 359 EXERCISE 13.3 1.
- Page 334 and 335:
ANSWERS/HINTS 361 EXERCISE 15.1 1.
- Page 336 and 337:
ANSWERS/HINTS 363 ✆ ✂ ✂ ✂ 2
- Page 338 and 339:
PROOFS IN MATHEMATICS A1 A1.1 Intro
- Page 340 and 341:
PROOFS IN MATHEMATICS 315 (v) Some
- Page 342 and 343:
PROOFS IN MATHEMATICS 317 used to d
- Page 344 and 345:
PROOFS IN MATHEMATICS 319 Number of
- Page 346 and 347:
PROOFS IN MATHEMATICS 321 4. Using
- Page 348 and 349:
PROOFS IN MATHEMATICS 323 Remark :
- Page 350 and 351:
PROOFS IN MATHEMATICS 325 For examp
- Page 352 and 353:
PROOFS IN MATHEMATICS 327 In genera
- Page 354 and 355:
PROOFS IN MATHEMATICS 329 2. Write
- Page 356 and 357:
PROOFS IN MATHEMATICS 331 Since np
- Page 358 and 359:
PROOFS IN MATHEMATICS 333 EXERCISE
- Page 360 and 361:
MATHEMATICAL MODELLING 335 (v) Pred
- Page 362 and 363:
MATHEMATICAL MODELLING 337 For inst
- Page 364 and 365:
MATHEMATICAL MODELLING 339 A2.3 Som
- Page 366 and 367:
MATHEMATICAL MODELLING 341 Example
- Page 368 and 369:
MATHEMATICAL MODELLING 343 3. A T.V