

Rebirth of Water 2018-2019
Continued water quality monitoring throughout the City of Saint John and the Greater Saint John area helps to gain insight into the aquatic habitats that these watercourses provide, as well as their safety for recreational use for humans. The watercourses that have had continuous monitoring this year include: Marsh Creek, Inner Harbour, Newman’s Brook, Caledonia Brook, Alder Brook, Hazen Creek, Taylor Brook, Salmon Creek and Mispec River. Additional sampling sites were added this year on the west side of the City, which include Mill Creek, Spruce Lake Stream, Walker Creek, Mosquito Cove, Manawagonish Creek, and Dominion Park. These new locations were added this year to more accurately portray the water quality of the city’s waterways as a whole. Overall, the watercourses included in this year’s sampling all continue to have the capability to provide sufficient aquatic habitats for various forms of aquatic life. There are several factors that potentially affect the water courses such as stormwater runoff, sanitary sewer overflows and riparian degradation. The stormwater runoff and riparian degradation as well as the hot, dry weather led to elevated temperatures and slightly decreased dissolved oxygen levels as compared to previous years. On average, most sites this year saw an increase in orthophosphate concentration when compared to previous data. At this time, there is no official guideline or recommendation for orthophosphate levels in place. The considerable improvements of water quality parameters for aquatic life seen in Marsh Creek since the completion of Harbour Cleanup in 2014 solidifies that the funding and resources put into the project were much needed. The most notable difference in the water quality is the dissolved oxygen concentrations, although lower in 2018 than 2017, they are still above the Canadian Council of Ministers of the Environment guideline recommended concentration of 6.5 mg/L on average at all the sites sampled.
Continued water quality monitoring throughout the City of Saint John and the Greater Saint John area helps to gain insight into the aquatic habitats that these watercourses provide, as well as their safety for recreational use for humans. The watercourses that have had continuous monitoring this year include: Marsh Creek, Inner Harbour, Newman’s Brook, Caledonia Brook, Alder Brook, Hazen Creek, Taylor Brook, Salmon Creek and Mispec River. Additional sampling sites were added this year on the west side of the City, which include Mill Creek, Spruce Lake Stream, Walker Creek, Mosquito Cove, Manawagonish Creek, and Dominion Park. These new locations were added this year to more accurately portray the water quality of the city’s waterways as a whole.
Overall, the watercourses included in this year’s sampling all continue to have the capability to provide sufficient aquatic habitats for various forms of aquatic life. There are several factors that potentially affect the water courses such as stormwater runoff, sanitary sewer overflows and riparian degradation. The stormwater runoff and riparian degradation as well as the hot, dry weather led to elevated temperatures and slightly decreased dissolved oxygen levels as compared to previous years. On average, most sites this year saw an increase in orthophosphate concentration when compared to previous data. At this time, there is no official guideline or recommendation for orthophosphate levels in place.
The considerable improvements of water quality parameters for aquatic life seen in Marsh Creek since the completion of Harbour Cleanup in 2014 solidifies that the funding and resources put into the project were much needed. The most notable difference in the water quality is the dissolved oxygen concentrations, although lower in 2018 than 2017, they are still above the Canadian Council of Ministers of the Environment guideline recommended concentration of 6.5 mg/L on average at all the sites sampled.

You also want an ePaper? Increase the reach of your titles
YUMPU automatically turns print PDFs into web optimized ePapers that Google loves.
Fecal Coliform (CFU/100 mL)<br />
16000<br />
14000<br />
12000<br />
10000<br />
8000<br />
6000<br />
4000<br />
2000<br />
0<br />
26-Jun-18<br />
04-Jul-18<br />
16-Jul-18<br />
25-Jul-18<br />
01-Aug-18<br />
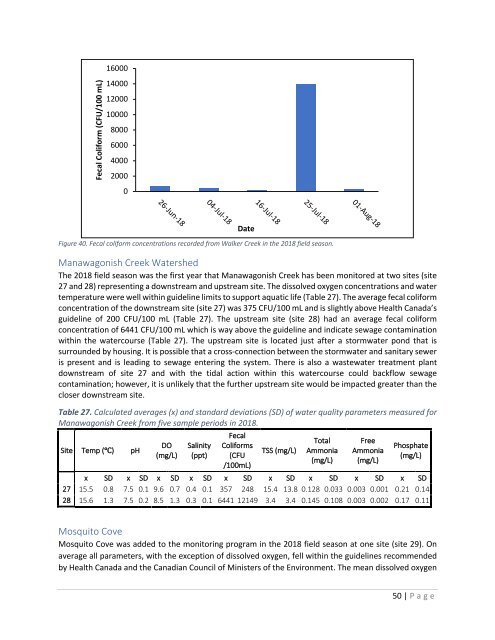
Figure 40. Fecal coliform concentrations recorded from Walker Creek in the <strong>2018</strong> field season.<br />
Manawagonish Creek <strong>Water</strong>shed<br />
The <strong>2018</strong> field season was the first year that Manawagonish Creek has been monitored at two sites (site<br />
27 and 28) representing a downstream and upstream site. The dissolved oxygen concentrations and water<br />
temperature were well within guideline limits to support aquatic life (Table 27). The average fecal coliform<br />
concentration <strong>of</strong> the downstream site (site 27) was 375 CFU/100 mL and is slightly above Health Canada’s<br />
guideline <strong>of</strong> 200 CFU/100 mL (Table 27). The upstream site (site 28) had an average fecal coliform<br />
concentration <strong>of</strong> 6441 CFU/100 mL which is way above the guideline and indicate sewage contamination<br />
within the watercourse (Table 27). The upstream site is located just after a stormwater pond that is<br />
surrounded by housing. It is possible that a cross-connection between the stormwater and sanitary sewer<br />
is present and is leading to sewage entering the system. There is also a wastewater treatment plant<br />
downstream <strong>of</strong> site 27 and with the tidal action within this watercourse could backflow sewage<br />
contamination; however, it is unlikely that the further upstream site would be impacted greater than the<br />
closer downstream site.<br />
Table 27. Calculated averages (x) and standard deviations (SD) <strong>of</strong> water quality parameters measured for<br />
Manawagonish Creek from five sample periods in <strong>2018</strong>.<br />
Site Temp (℃) pH<br />
DO<br />
(mg/L)<br />
Salinity<br />
(ppt)<br />
Date<br />
Fecal<br />
Coliforms<br />
(CFU<br />
/100mL)<br />
TSS (mg/L)<br />
Total<br />
Ammonia<br />
(mg/L)<br />
Free<br />
Ammonia<br />
(mg/L)<br />
Phosphate<br />
(mg/L)<br />
x SD x SD x SD x SD x SD x SD x SD x SD x SD<br />
27 15.5 0.8 7.5 0.1 9.6 0.7 0.4 0.1 357 248 15.4 13.8 0.128 0.033 0.003 0.001 0.21 0.14<br />
28 15.6 1.3 7.5 0.2 8.5 1.3 0.3 0.1 6441 12149 3.4 3.4 0.145 0.108 0.003 0.002 0.17 0.11<br />
Mosquito Cove<br />
Mosquito Cove was added to the monitoring program in the <strong>2018</strong> field season at one site (site 29). On<br />
average all parameters, with the exception <strong>of</strong> dissolved oxygen, fell within the guidelines recommended<br />
by Health Canada and the Canadian Council <strong>of</strong> Ministers <strong>of</strong> the Environment. The mean dissolved oxygen<br />
50 | P age


