

Rebirth of Water 2018-2019
Continued water quality monitoring throughout the City of Saint John and the Greater Saint John area helps to gain insight into the aquatic habitats that these watercourses provide, as well as their safety for recreational use for humans. The watercourses that have had continuous monitoring this year include: Marsh Creek, Inner Harbour, Newman’s Brook, Caledonia Brook, Alder Brook, Hazen Creek, Taylor Brook, Salmon Creek and Mispec River. Additional sampling sites were added this year on the west side of the City, which include Mill Creek, Spruce Lake Stream, Walker Creek, Mosquito Cove, Manawagonish Creek, and Dominion Park. These new locations were added this year to more accurately portray the water quality of the city’s waterways as a whole. Overall, the watercourses included in this year’s sampling all continue to have the capability to provide sufficient aquatic habitats for various forms of aquatic life. There are several factors that potentially affect the water courses such as stormwater runoff, sanitary sewer overflows and riparian degradation. The stormwater runoff and riparian degradation as well as the hot, dry weather led to elevated temperatures and slightly decreased dissolved oxygen levels as compared to previous years. On average, most sites this year saw an increase in orthophosphate concentration when compared to previous data. At this time, there is no official guideline or recommendation for orthophosphate levels in place. The considerable improvements of water quality parameters for aquatic life seen in Marsh Creek since the completion of Harbour Cleanup in 2014 solidifies that the funding and resources put into the project were much needed. The most notable difference in the water quality is the dissolved oxygen concentrations, although lower in 2018 than 2017, they are still above the Canadian Council of Ministers of the Environment guideline recommended concentration of 6.5 mg/L on average at all the sites sampled.
Continued water quality monitoring throughout the City of Saint John and the Greater Saint John area helps to gain insight into the aquatic habitats that these watercourses provide, as well as their safety for recreational use for humans. The watercourses that have had continuous monitoring this year include: Marsh Creek, Inner Harbour, Newman’s Brook, Caledonia Brook, Alder Brook, Hazen Creek, Taylor Brook, Salmon Creek and Mispec River. Additional sampling sites were added this year on the west side of the City, which include Mill Creek, Spruce Lake Stream, Walker Creek, Mosquito Cove, Manawagonish Creek, and Dominion Park. These new locations were added this year to more accurately portray the water quality of the city’s waterways as a whole.
Overall, the watercourses included in this year’s sampling all continue to have the capability to provide sufficient aquatic habitats for various forms of aquatic life. There are several factors that potentially affect the water courses such as stormwater runoff, sanitary sewer overflows and riparian degradation. The stormwater runoff and riparian degradation as well as the hot, dry weather led to elevated temperatures and slightly decreased dissolved oxygen levels as compared to previous years. On average, most sites this year saw an increase in orthophosphate concentration when compared to previous data. At this time, there is no official guideline or recommendation for orthophosphate levels in place.
The considerable improvements of water quality parameters for aquatic life seen in Marsh Creek since the completion of Harbour Cleanup in 2014 solidifies that the funding and resources put into the project were much needed. The most notable difference in the water quality is the dissolved oxygen concentrations, although lower in 2018 than 2017, they are still above the Canadian Council of Ministers of the Environment guideline recommended concentration of 6.5 mg/L on average at all the sites sampled.

Create successful ePaper yourself
Turn your PDF publications into a flip-book with our unique Google optimized e-Paper software.
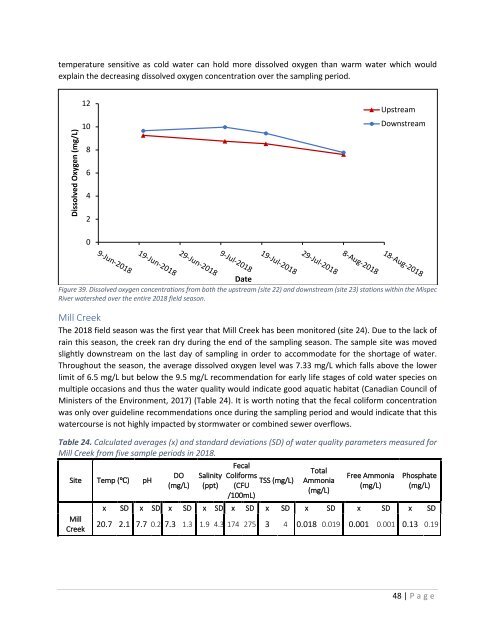
temperature sensitive as cold water can hold more dissolved oxygen than warm water which would<br />
explain the decreasing dissolved oxygen concentration over the sampling period.<br />
Dissolved Oxygen (mg/L)<br />
12<br />
10<br />
8<br />
6<br />
4<br />
2<br />
Upstream<br />
Downstream<br />
0<br />
9-Jun-<strong>2018</strong><br />
19-Jun-<strong>2018</strong><br />
29-Jun-<strong>2018</strong><br />
9-Jul-<strong>2018</strong><br />
19-Jul-<strong>2018</strong><br />
29-Jul-<strong>2018</strong><br />
8-Aug-<strong>2018</strong><br />
18-Aug-<strong>2018</strong><br />
Date<br />
Figure 39. Dissolved oxygen concentrations from both the upstream (site 22) and downstream (site 23) stations within the Mispec<br />
River watershed over the entire <strong>2018</strong> field season.<br />
Mill Creek<br />
The <strong>2018</strong> field season was the first year that Mill Creek has been monitored (site 24). Due to the lack <strong>of</strong><br />
rain this season, the creek ran dry during the end <strong>of</strong> the sampling season. The sample site was moved<br />
slightly downstream on the last day <strong>of</strong> sampling in order to accommodate for the shortage <strong>of</strong> water.<br />
Throughout the season, the average dissolved oxygen level was 7.33 mg/L which falls above the lower<br />
limit <strong>of</strong> 6.5 mg/L but below the 9.5 mg/L recommendation for early life stages <strong>of</strong> cold water species on<br />
multiple occasions and thus the water quality would indicate good aquatic habitat (Canadian Council <strong>of</strong><br />
Ministers <strong>of</strong> the Environment, 2017) (Table 24). It is worth noting that the fecal coliform concentration<br />
was only over guideline recommendations once during the sampling period and would indicate that this<br />
watercourse is not highly impacted by stormwater or combined sewer overflows.<br />
Table 24. Calculated averages (x) and standard deviations (SD) <strong>of</strong> water quality parameters measured for<br />
Mill Creek from five sample periods in <strong>2018</strong>.<br />
Site Temp (℃) pH<br />
Mill<br />
Creek<br />
DO<br />
(mg/L)<br />
Salinity<br />
(ppt)<br />
Fecal<br />
Coliforms<br />
TSS (mg/L)<br />
(CFU<br />
/100mL)<br />
Total<br />
Ammonia<br />
(mg/L)<br />
Free Ammonia<br />
(mg/L)<br />
Phosphate<br />
(mg/L)<br />
x SD x SD x SD x SD x SD x SD x SD x SD x SD<br />
20.7 2.1 7.7 0.2 7.3 1.3 1.9 4.3 174 275 3 4 0.018 0.019 0.001 0.001 0.13 0.19<br />
48 | P age


