

Rebirth of Water 2018-2019
Continued water quality monitoring throughout the City of Saint John and the Greater Saint John area helps to gain insight into the aquatic habitats that these watercourses provide, as well as their safety for recreational use for humans. The watercourses that have had continuous monitoring this year include: Marsh Creek, Inner Harbour, Newman’s Brook, Caledonia Brook, Alder Brook, Hazen Creek, Taylor Brook, Salmon Creek and Mispec River. Additional sampling sites were added this year on the west side of the City, which include Mill Creek, Spruce Lake Stream, Walker Creek, Mosquito Cove, Manawagonish Creek, and Dominion Park. These new locations were added this year to more accurately portray the water quality of the city’s waterways as a whole. Overall, the watercourses included in this year’s sampling all continue to have the capability to provide sufficient aquatic habitats for various forms of aquatic life. There are several factors that potentially affect the water courses such as stormwater runoff, sanitary sewer overflows and riparian degradation. The stormwater runoff and riparian degradation as well as the hot, dry weather led to elevated temperatures and slightly decreased dissolved oxygen levels as compared to previous years. On average, most sites this year saw an increase in orthophosphate concentration when compared to previous data. At this time, there is no official guideline or recommendation for orthophosphate levels in place. The considerable improvements of water quality parameters for aquatic life seen in Marsh Creek since the completion of Harbour Cleanup in 2014 solidifies that the funding and resources put into the project were much needed. The most notable difference in the water quality is the dissolved oxygen concentrations, although lower in 2018 than 2017, they are still above the Canadian Council of Ministers of the Environment guideline recommended concentration of 6.5 mg/L on average at all the sites sampled.
Continued water quality monitoring throughout the City of Saint John and the Greater Saint John area helps to gain insight into the aquatic habitats that these watercourses provide, as well as their safety for recreational use for humans. The watercourses that have had continuous monitoring this year include: Marsh Creek, Inner Harbour, Newman’s Brook, Caledonia Brook, Alder Brook, Hazen Creek, Taylor Brook, Salmon Creek and Mispec River. Additional sampling sites were added this year on the west side of the City, which include Mill Creek, Spruce Lake Stream, Walker Creek, Mosquito Cove, Manawagonish Creek, and Dominion Park. These new locations were added this year to more accurately portray the water quality of the city’s waterways as a whole.
Overall, the watercourses included in this year’s sampling all continue to have the capability to provide sufficient aquatic habitats for various forms of aquatic life. There are several factors that potentially affect the water courses such as stormwater runoff, sanitary sewer overflows and riparian degradation. The stormwater runoff and riparian degradation as well as the hot, dry weather led to elevated temperatures and slightly decreased dissolved oxygen levels as compared to previous years. On average, most sites this year saw an increase in orthophosphate concentration when compared to previous data. At this time, there is no official guideline or recommendation for orthophosphate levels in place.
The considerable improvements of water quality parameters for aquatic life seen in Marsh Creek since the completion of Harbour Cleanup in 2014 solidifies that the funding and resources put into the project were much needed. The most notable difference in the water quality is the dissolved oxygen concentrations, although lower in 2018 than 2017, they are still above the Canadian Council of Ministers of the Environment guideline recommended concentration of 6.5 mg/L on average at all the sites sampled.

Create successful ePaper yourself
Turn your PDF publications into a flip-book with our unique Google optimized e-Paper software.
The dissolved oxygen concentrations also revealed that the Hazen Creek system is quite capable <strong>of</strong><br />
supporting aquatic life. Both the downstream and upstream sites were, on average, below the 9.5 mg/L<br />
recommended guideline from CCME with an average <strong>of</strong> 9.37 and 8.64 mg/L respectively but were well<br />
above the 6.5 mg/L threshold (Table 10) (Canadian Council <strong>of</strong> Ministers <strong>of</strong> the Environment, 2017).<br />
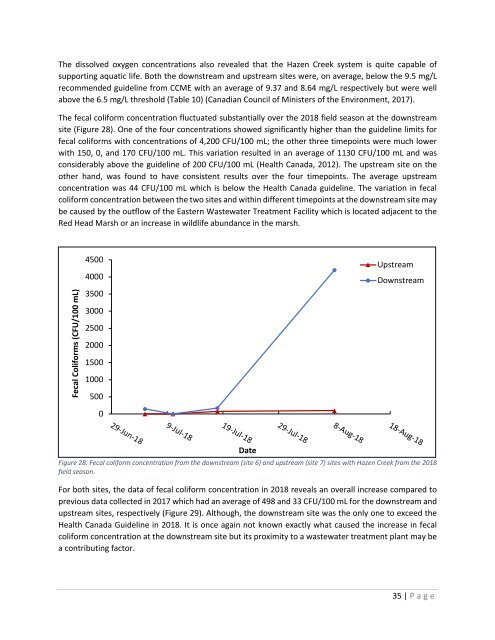
The fecal coliform concentration fluctuated substantially over the <strong>2018</strong> field season at the downstream<br />
site (Figure 28). One <strong>of</strong> the four concentrations showed significantly higher than the guideline limits for<br />
fecal coliforms with concentrations <strong>of</strong> 4,200 CFU/100 mL; the other three timepoints were much lower<br />
with 150, 0, and 170 CFU/100 mL. This variation resulted in an average <strong>of</strong> 1130 CFU/100 mL and was<br />
considerably above the guideline <strong>of</strong> 200 CFU/100 mL (Health Canada, 2012). The upstream site on the<br />
other hand, was found to have consistent results over the four timepoints. The average upstream<br />
concentration was 44 CFU/100 mL which is below the Health Canada guideline. The variation in fecal<br />
coliform concentration between the two sites and within different timepoints at the downstream site may<br />
be caused by the outflow <strong>of</strong> the Eastern Wastewater Treatment Facility which is located adjacent to the<br />
Red Head Marsh or an increase in wildlife abundance in the marsh.<br />
Fecal Coliforms (CFU/100 mL)<br />
4500<br />
4000<br />
3500<br />
3000<br />
2500<br />
2000<br />
1500<br />
1000<br />
500<br />
0<br />
Upstream<br />
Downstream<br />
9-Jul-18<br />
19-Jul-18<br />
29-Jul-18<br />
8-Aug-18<br />
29-Jun-18<br />
Date<br />
18-Aug-18<br />
Figure 28. Fecal coliform concentration from the downstream (site 6) and upstream (site 7) sites with Hazen Creek from the <strong>2018</strong><br />
field season.<br />
For both sites, the data <strong>of</strong> fecal coliform concentration in <strong>2018</strong> reveals an overall increase compared to<br />
previous data collected in 2017 which had an average <strong>of</strong> 498 and 33 CFU/100 mL for the downstream and<br />
upstream sites, respectively (Figure 29). Although, the downstream site was the only one to exceed the<br />
Health Canada Guideline in <strong>2018</strong>. It is once again not known exactly what caused the increase in fecal<br />
coliform concentration at the downstream site but its proximity to a wastewater treatment plant may be<br />
a contributing factor.<br />
35 | P age


