

Rebirth of Water 2018-2019
Continued water quality monitoring throughout the City of Saint John and the Greater Saint John area helps to gain insight into the aquatic habitats that these watercourses provide, as well as their safety for recreational use for humans. The watercourses that have had continuous monitoring this year include: Marsh Creek, Inner Harbour, Newman’s Brook, Caledonia Brook, Alder Brook, Hazen Creek, Taylor Brook, Salmon Creek and Mispec River. Additional sampling sites were added this year on the west side of the City, which include Mill Creek, Spruce Lake Stream, Walker Creek, Mosquito Cove, Manawagonish Creek, and Dominion Park. These new locations were added this year to more accurately portray the water quality of the city’s waterways as a whole. Overall, the watercourses included in this year’s sampling all continue to have the capability to provide sufficient aquatic habitats for various forms of aquatic life. There are several factors that potentially affect the water courses such as stormwater runoff, sanitary sewer overflows and riparian degradation. The stormwater runoff and riparian degradation as well as the hot, dry weather led to elevated temperatures and slightly decreased dissolved oxygen levels as compared to previous years. On average, most sites this year saw an increase in orthophosphate concentration when compared to previous data. At this time, there is no official guideline or recommendation for orthophosphate levels in place. The considerable improvements of water quality parameters for aquatic life seen in Marsh Creek since the completion of Harbour Cleanup in 2014 solidifies that the funding and resources put into the project were much needed. The most notable difference in the water quality is the dissolved oxygen concentrations, although lower in 2018 than 2017, they are still above the Canadian Council of Ministers of the Environment guideline recommended concentration of 6.5 mg/L on average at all the sites sampled.
Continued water quality monitoring throughout the City of Saint John and the Greater Saint John area helps to gain insight into the aquatic habitats that these watercourses provide, as well as their safety for recreational use for humans. The watercourses that have had continuous monitoring this year include: Marsh Creek, Inner Harbour, Newman’s Brook, Caledonia Brook, Alder Brook, Hazen Creek, Taylor Brook, Salmon Creek and Mispec River. Additional sampling sites were added this year on the west side of the City, which include Mill Creek, Spruce Lake Stream, Walker Creek, Mosquito Cove, Manawagonish Creek, and Dominion Park. These new locations were added this year to more accurately portray the water quality of the city’s waterways as a whole.
Overall, the watercourses included in this year’s sampling all continue to have the capability to provide sufficient aquatic habitats for various forms of aquatic life. There are several factors that potentially affect the water courses such as stormwater runoff, sanitary sewer overflows and riparian degradation. The stormwater runoff and riparian degradation as well as the hot, dry weather led to elevated temperatures and slightly decreased dissolved oxygen levels as compared to previous years. On average, most sites this year saw an increase in orthophosphate concentration when compared to previous data. At this time, there is no official guideline or recommendation for orthophosphate levels in place.
The considerable improvements of water quality parameters for aquatic life seen in Marsh Creek since the completion of Harbour Cleanup in 2014 solidifies that the funding and resources put into the project were much needed. The most notable difference in the water quality is the dissolved oxygen concentrations, although lower in 2018 than 2017, they are still above the Canadian Council of Ministers of the Environment guideline recommended concentration of 6.5 mg/L on average at all the sites sampled.

You also want an ePaper? Increase the reach of your titles
YUMPU automatically turns print PDFs into web optimized ePapers that Google loves.
Between October 2 and 3, <strong>2018</strong>, fyke nets were set out again in the Courtenay Bay and Courtenay Forebay<br />
and were left out for one 24-hour period. The majority <strong>of</strong> fish that were found in the Courtenay Bay was<br />
the Atlantic tomcod (94%) (Table 8). The water temperature was 12.8°C and there were zero mortalities.<br />
A total <strong>of</strong> five European green crabs were also found in the fyke net.<br />
Table 8. Fish species composition caught in a fyke net in the Courtenay Bay (below the tide gates) on<br />
October 3, <strong>2018</strong>.<br />
Species<br />
Total Number<br />
Range <strong>of</strong> Total<br />
Percentage (%)<br />
Caught<br />
Length (mm)<br />
Atlantic tomcod (Microgadus tomcod) 57 97 136-280<br />
American eel (Anguilla rostrata) 2 3 310-330<br />
On the same day, another fyke net was checked for fish presences in the Courtenay Forebay (above the<br />
tide gates). A total <strong>of</strong> 14 fish were found in the net with the majority <strong>of</strong> the fish being American eel (86%)<br />
(Table 9). The water temperature was found to be 13.5°C and there were zero mortalities. A total <strong>of</strong> ten<br />
European green crabs were also found in the fyke net.<br />
Table 9. Fish species composition caught in a fyke net in the Courtenay Forebay (above the tide gates) on<br />
October 3, <strong>2018</strong>.<br />
Species<br />
Total Number<br />
Range <strong>of</strong> Total<br />
Percentage (%)<br />
Caught<br />
Length (mm)<br />
Atlantic tomcod (Microgadus tomcod) 2 14 212-320<br />
American eel (Anguilla rostrata) 12 86 300-510<br />
Hazen Creek <strong>Water</strong>shed<br />
The water quality <strong>of</strong> Hazen Creek was determined through monitoring a downstream site (site 6) and an<br />
upstream site (site 7) over five timepoints in the <strong>2018</strong> field season. The calculated averages can be found<br />
in Table 10.<br />
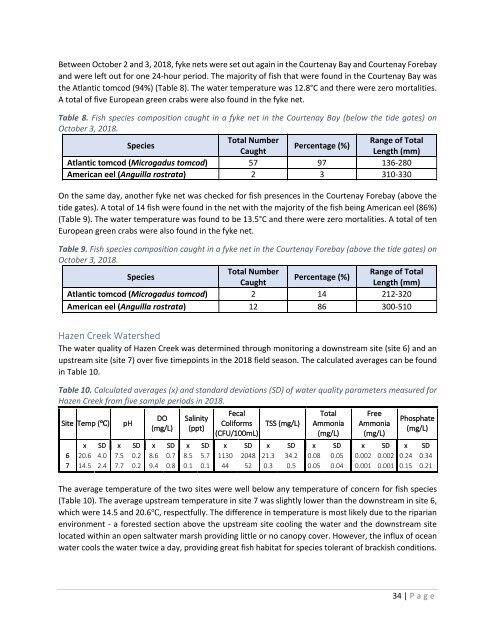
Table 10. Calculated averages (x) and standard deviations (SD) <strong>of</strong> water quality parameters measured for<br />
Hazen Creek from five sample periods in <strong>2018</strong>.<br />
Site Temp (℃)<br />
pH<br />
DO<br />
(mg/L)<br />
Salinity<br />
(ppt)<br />
Fecal<br />
Coliforms<br />
(CFU/100mL)<br />
TSS (mg/L)<br />
Total<br />
Ammonia<br />
(mg/L)<br />
Free<br />
Ammonia<br />
(mg/L)<br />
Phosphate<br />
(mg/L)<br />
x SD x SD x SD x SD x SD x SD x SD x SD x SD<br />
6 20.6 4.0 7.5 0.2 8.6 0.7 8.5 5.7 1130 2048 21.3 34.2 0.08 0.05 0.002 0.002 0.24 0.34<br />
7 14.5 2.4 7.7 0.2 9.4 0.8 0.1 0.1 44 52 0.3 0.5 0.05 0.04 0.001 0.001 0.15 0.21<br />
The average temperature <strong>of</strong> the two sites were well below any temperature <strong>of</strong> concern for fish species<br />
(Table 10). The average upstream temperature in site 7 was slightly lower than the downstream in site 6,<br />
which were 14.5 and 20.6℃, respectfully. The difference in temperature is most likely due to the riparian<br />
environment - a forested section above the upstream site cooling the water and the downstream site<br />
located within an open saltwater marsh providing little or no canopy cover. However, the influx <strong>of</strong> ocean<br />
water cools the water twice a day, providing great fish habitat for species tolerant <strong>of</strong> brackish conditions.<br />
34 | P age


