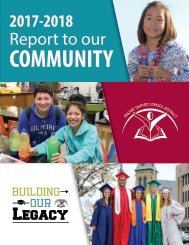
2018-19 Community Report

Create successful ePaper yourself
Turn your PDF publications into a flip-book with our unique Google optimized e-Paper software.
Fiscal Responsibility<br />
RUSD is keeping our commitment to hold the line on taxes and provide our community a conservative, efficient and priority-focused fiscal plan while<br />
improving student achievement. We carefully target our dollars to have the greatest impact on the classroom and student learning. When compared<br />
to the state average, a higher proportion of RUSD expenditures have been for educational purposes while District per pupil spending is below the<br />
state average. Below are a few examples of how our budget has positively impacted our schools.<br />
Academic Achievement<br />
• New Social Studies (grades 9-12), English (grades 9-12)<br />
and Science (grades 6-12) curriculum<br />
• $1.25 million in student and classroom technology<br />
• Increased funding for STEM, STEAM and Fine Arts<br />
Programming<br />
Behavior and School Climate<br />
• Additional social workers and support staff<br />
• Expanded mental health services at the<br />
community clinic<br />
Opening of New Schools<br />
• Gilmore Fine Arts (K-8)<br />
• Starbuck Middle School (An IB World School)<br />
• Walden III moved to former McKinley Middle<br />
School Building<br />
Early Learning Expansion<br />
• Addition of Montessori classrooms at the RUSD<br />
Montessori Program<br />
• Expansion of full-day 4K from 12 to 14 schools<br />
Flat School Tax Levy<br />
How Revenue is Spent...<br />
$<br />
10.63<br />
$<br />
10.00<br />
$<br />
9.00<br />
$<br />
8.00<br />
$<br />
7.00<br />
$<br />
6.00<br />
$<br />
0.86<br />
$<br />
0.69<br />
$<br />
0.14<br />
$<br />
0.11<br />
$<br />
8.83<br />
$<br />
10.01<br />
$<br />
1.18<br />
$<br />
0.63<br />
$<br />
0.27<br />
$<br />
0.<strong>19</strong><br />
$<br />
7.74<br />
$<br />
10.02 $<br />
10.00<br />
$<br />
1.25<br />
$<br />
1.24<br />
$<br />
0.39<br />
$<br />
0.15<br />
$<br />
6.99<br />
42.9 11.8<br />
11.8 4.9<br />
4.9 17.5<br />
17.5 3.8<br />
3.8 5<br />
5 4.6<br />
$<br />
1.55<br />
4.6 9.5<br />
9.5 42.9<br />
$<br />
1.29<br />
$<br />
0.55<br />
$<br />
0.55<br />
Expenditures by Function<br />
Instruction<br />
42.9%<br />
Instr. &<br />
Pupil<br />
Support<br />
11.8%<br />
Administration<br />
4.9%<br />
Business &<br />
Operations<br />
17.5%<br />
9.3<br />
0.1<br />
29.6<br />
1.5<br />
59.9<br />
Sources of Revenue<br />
State Sources<br />
59.9%<br />
Federal<br />
9.3%<br />
Property<br />
Taxes<br />
29.6%<br />
Other<br />
Sources<br />
0.1%<br />
$<br />
6.06<br />
$<br />
5.00<br />
2015-2016 2016-2017 2017-<strong>2018</strong> <strong>2018</strong>-20<strong>19</strong><br />
Base Tax Levy <strong>Community</strong> Service Levy<br />
State 220 Aid Cut Voucher Levy Debt Service Funds<br />
Note: Every 10-cents on the property tax levy equals $10 on a $100,000 home<br />
Vouchers &<br />
Open Enrollment<br />
9.5%<br />
Food &<br />
<strong>Community</strong><br />
Service<br />
4.6%<br />
Debt<br />
5%<br />
Central,<br />
Insurance<br />
& Other<br />
3.8%<br />
Local &<br />
Intermediate<br />
Sources<br />
1.5%