
You also want an ePaper? Increase the reach of your titles
YUMPU automatically turns print PDFs into web optimized ePapers that Google loves.
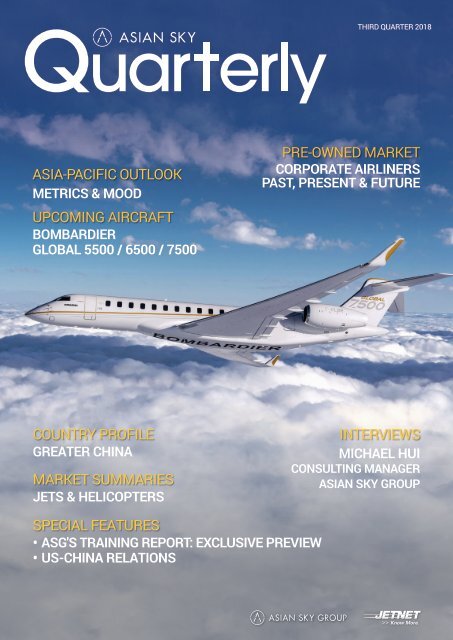
THIRD QUARTER 2018<br />
ASIA-PACIFIC OUTLOOK<br />
METRICS & MOOD<br />
UPCOMING AIRCRAFT<br />
BOMBARDIER<br />
GLOBAL 5500 / 6500 / 7500<br />
PRE-OWNED MARKET<br />
CORPORATE AIRLINERS<br />
PAST, PRES<strong>EN</strong>T & FUTURE<br />
COUNTRY PROFILE<br />
GREATER CHINA<br />
MARKET SUMMARIES<br />
JETS & HELICOPTERS<br />
INTERVIEWS<br />
MICHAEL HUI<br />
CONSULTING MANAGER<br />
ASIAN SKY GROUP<br />
SPECIAL FEATURES<br />
• ASG'S TRAINING REPORT: EXCLUSIVE PREVIEW<br />
• US-CHINA RELATIONS
RELY ON.<br />
FLY<br />
WE MAKE IT<br />
The new generation H160 boasts a range<br />
of unparalleled safety features. Maximized<br />
pilot visibility, intuitive information display,<br />
unrivalled pilot assistance with Helionix ® ,<br />
and unmatched flight envelope protection.<br />
What’s more, it carries up to 12 passengers<br />
with a radius of action of 120 NM, while<br />
burning 15% less fuel. With so many<br />
impressive features, the H160 is a huge<br />
step forward not just for its category, but<br />
for the environment, too.<br />
Safety. We make it fly.
PUBLISHER’S NOTE<br />
The third quarter of 2018 saw a dramatic change from just two years<br />
before. In Q2 2016 the market had an abundance of inventory — with a<br />
worldwide inventory value of roughly US$7.8 billion. Two years later, the<br />
inventory value has been reduced significantly, reaching a worldwide<br />
value of US$5.8 billion. Back then, buyers had ample supply at much<br />
lower prices. Today’s market has much less supply at higher prices,<br />
making it harder for buyers to find that ideal business jet.<br />
One of the driving forces leading the market from a Buyer’s Market<br />
toward a Seller’s Market is Gulfstream and its fleet of pre-owned aircraft.<br />
Gulfstream’s G200 saw 41 transactions in the past 12 months. The<br />
G550 had 39 transactions and the G650/650ER had 23 transactions<br />
in the past 12 months. A few other indicators are the low number of<br />
days on market (DOM) and the overall supply vs. demand ratio; both of<br />
which are lower than most aircraft on the market. Notably, Bombardier’s<br />
Challenger 600 series and Global series have also followed a similar<br />
trend. These models are all relatively ‘easy’ to sell, more attractive to<br />
buyers and they have a higher inventory available for sale.<br />
Because those aircraft are selling much quicker than most, pricing has<br />
increased for those still on the market. Overall, this has made for a less<br />
active market, with fewer transactions.<br />
Of course, as we saw in ASG’s quarterly Market Survey in the ‘Mood &<br />
Intentions’ section, economic confidence is down. Optimism plateaued<br />
in Q1 and pessimistic feelings toward the economy have raised<br />
drastically; the biggest decline in economic confidence since the start<br />
of the Market Survey. We’re seeing these feelings across the region, but<br />
these are most prominent in Greater China.<br />
The obvious finger to point here is at the US-China trade war, which, as a<br />
Special Feature for this issue of Asian Sky Quarterly, I explain in further<br />
detail on Page 18, offering what I hope to be a look into this complex<br />
situation between two global powerhouses.<br />
The helicopter segment is, as always, more complex. There remains an<br />
oversupply of inventory, yet average asking prices are dropping. This<br />
is likely a result of owners coming to terms with unrealistic prices, as<br />
average DOM are increasing. Once again, the market is going through<br />
changes. The best example of this is the S-76 C++, used for offshore oil<br />
and gas operations. In Q3 2017, the average asking prices was US$7.3M.<br />
One year later the price is US$5.4M. DOM have increased significantly<br />
from just the previous quarter; rising from 555 in Q2 to 641 this quarter.<br />
This is the epitome of a Buyer’s Market with no significant indicators to<br />
when this will turn around.<br />
As for the rest of Asian Sky Quarterly, this issue features a look at<br />
Bombardier’s Global series — the 5500, 6500 and 7500. We also<br />
examine the pre-owed corporate airliner market — including data on<br />
BBJs, the ACJ series, Bombardier’s Challenger 850 and Embraer’s<br />
Lineage 1000. China is very much in the minds of the industry; thus,<br />
we’ve profiled business aviation in Greater China this quarter. One of<br />
ASG’s newest additions is Michael Hui, Consulting Manager and he has<br />
shared his insight on the growing consulting division with the company.<br />
You’ll also get a glimpse of ASG’s latest report, an update to the inagural<br />
Asia Pacific Training School Report, highlighting the need for training<br />
schools in light of the growing pilot shortage.<br />
As with every issue of Asian Sky Quarterly, I hope you find this edition<br />
to be a useful resource, particularly when making aircraft buying and<br />
selling decisions.<br />
Another example of the changing market is the AW139, which<br />
showcases a different story. Operators of this aircraft are gradually<br />
changing its mission type from offshore use to EMS and VIP use. These<br />
mission segments, along with SAR and law enforcement, are more in<br />
demand. Consequently, inventory level for this aircraft is reducing and<br />
average asking price is rising.<br />
Sincerely,<br />
Jeffrey C. Lowe<br />
Managing Director, Asian Sky Group<br />
SPECIAL THANKS TO OUR CONTRIBUTORS:<br />
THIRD QUARTER 2018 — ASIAN SKY QUARTERLY | 1
CONT<strong>EN</strong>TS<br />
04 ECONOMICS<br />
34<br />
08<br />
14<br />
18<br />
19<br />
28<br />
Overview of the Asia-Pacific region’s current status and<br />
specific country’s GDP versus their business jet fleet size.<br />
MOOD & INT<strong>EN</strong>TIONS<br />
Results of the survey on the Asia-Pacific region’s outlook<br />
on current economic status, aircraft utilization, purchase<br />
intentions and influencing factors.<br />
SPECIAL FEATURE: TRAINING REPORT<br />
PILOT DEMAND & SPECIAL MISSIONS TRAINING<br />
A sneak peek at what’s to come in ASG’s upcoming Asia<br />
Pacific Training Report.<br />
SPECIAL FEATURE: US-CHINA RELATIONS<br />
JEFFREY C. LOWE, MANAGING DIRECTOR; ASG<br />
Speaking on the volatile climate between the US and China<br />
in their escalating talks on trade and how this will impact<br />
business aviation.<br />
COUNTRY PROFILE - GREATER CHINA<br />
Overview and examination of Greater China’s business aviation<br />
industry, current challenges and potential for the future.<br />
PRE-OWNED MARKET SPOTLIGHT<br />
CORPORATE AIRLINER<br />
A comprehensive market performance analysis of the preowned<br />
corporate airliner market.<br />
42<br />
45<br />
50<br />
60<br />
MARKET DYNAMICS<br />
An in-depth analysis of inventory levels, market trends<br />
and the changing price signals for the business jet and<br />
helicopter fleets in the Asia-Pacific region, given the<br />
continual fluctuations in supply and demand.<br />
INTERVIEW:<br />
MICHAEL HUI, CONSULTING MANAGER; ASG<br />
Discussing his insight in providing consultancy to the<br />
commercial aviation sector and how this will translate to<br />
working in general aviation.<br />
UPCOMING SPOTLIGHT<br />
BOMBARDIER GLOBAL SERIES<br />
An introduction to the Global series — Global 5500, Global<br />
6500 and Global 7500, with a complete look at series’<br />
range, payload capacity and evolution over the years.<br />
MARKET SUMMARY - JETS<br />
A look at market position and average days on market of<br />
featured pre-owned business jets.<br />
MARKET SUMMARY - HELICOPTERS<br />
A look at market position and average days on market of<br />
featured pre-owned helicopters.<br />
PUBLISHER<br />
EDITORIAL<br />
Litalia Yoakum<br />
Roderick Li<br />
DESIGN<br />
Michael Wong<br />
Aya Leung<br />
Robert Li<br />
MARKET RESEARCH & DATA ANALYSIS<br />
Bowen Zhang<br />
DATA SUPPORT<br />
Avinava Sengupta<br />
Candice Yue<br />
Casper Zhuang<br />
Jersey Wu<br />
Michelle Shen<br />
The materials and information provided by Asian Sky<br />
Group Limited (“ASG”) in this report is for reference<br />
only. Any information we provide about how we may<br />
interpret the data and market, or how certain issues<br />
may be addressed is provided generally without<br />
considering your specific circumstances. Such<br />
information should not be regarded as a substitute<br />
for professional advice. Independent professional<br />
advice should be sought before taking action on any<br />
matters to which information provided in this report<br />
may be relevant.<br />
ASG shall not be liable for any losses, damage, costs<br />
or expenses howsoever caused, arising directly or<br />
indirectly from the use of or inability to use this report<br />
or use of or reliance upon any information or material<br />
provided in this report or otherwise in connection with<br />
any representation, statement or information on or<br />
contained in this report.<br />
ASG endeavors to ensure that the information<br />
contained in this report is accurate as at the date<br />
of publication, but does not guarantee or warrant<br />
its accuracy or completeness, or accept any liability<br />
of whatever nature for any losses, damage, costs<br />
or expenses howsoever caused, whether arising<br />
directly or indirectly from any error or omission in<br />
compiling such information. This report also uses<br />
third party information not compiled by ASG. ASG<br />
is not responsible for such information and makes<br />
no representation about the accuracy, completeness<br />
or any other aspect of information contained. The<br />
information, data, articles, or resources provided by<br />
any other parties do not in any way signify that ASG<br />
endorses the same.<br />
ADVERTISING/AIRCRAFT SALES <strong>EN</strong>QUIRIES:<br />
sales@asianskygroup.com<br />
Asian Sky Group<br />
Suite 1401, 14 Floor, Fortis Tower<br />
77-79 Gloucester Road, Wan Chai, Hong Kong<br />
Tel: (852) 2235 9222 | Fax: (852) 2528 2766<br />
sales@asianskygroup.com<br />
www.asianskygroup.com<br />
www.asianskymedia.com<br />
2 | ASIAN SKY QUARTERLY — THIRD QUARTER 2018
Chris is a Senior Airworthiness Inspector<br />
who’s always loved to travel. His many<br />
years of aviation experience and expertise<br />
go far when it comes to getting your<br />
aircraft inspected and certified. Check in<br />
with Chris if you need a fast turnaround,<br />
he can usually inspect and issue<br />
certificates on the same day. Go Chris!<br />
Find out how we can help you with<br />
your aircraft registration needs at<br />
bermudaaircraftregistry.bm<br />
Connect with us<br />
PUTTING YOU AT THE C<strong>EN</strong>TRE<br />
OF EVERYTHING WE DO
2018Q2 ECONOMICS<br />
Australia<br />
Australia’s economy advanced 3.4 percent year-on-year (y/y) in Q2,<br />
beating market expectations of a 2.8% growth. This is the fastest<br />
expansion Australia has seen since Q3 2012. Growth is attributed to<br />
domestic demand, namely household consumption and government<br />
spending. Foreign trade also supported the growth, with both exports<br />
and imports of goods and services increasing.<br />
Hong Kong<br />
Hong Kong’s GDP slowed in Q2 2018, coming in at 3.5% y/y after<br />
reaching 4.7% y/y in the first quarter of 2018. This marks the seventh<br />
quarter of growth for Hong Kong, attributed to an expansion in export<br />
services and inbound tourism, which registered double-digit growth.<br />
Still, the regional trade conflict marks uncertainties.<br />
Malaysia<br />
Malaysia’s GDP grew by 4.5% y/y in Q2, down from 5.4% in Q1 and below<br />
market expectations of a 5.2% growth. The 4.5% growth is attributed to<br />
strong domestic demand, with private consumption growing 8% y/y.<br />
Manufacturing and construction also fuelled further growth.<br />
Philippines<br />
Growth in the Philippines slowed to 6% in Q2 2018, falling short<br />
of market expectations. The external sector is attributed to the<br />
deceleration, posting a large negative growth as imports surged. The<br />
closure of the tourist hotspot Boracay further impacted growth in export<br />
of services, while the closure of several mining pits and the excise tax<br />
on non-metallic and metallic minerals left the mining sector with a poor<br />
performance.<br />
India<br />
India’s economy grew by 8.2% y/y in Q2, after expanding to 7.7% in the<br />
previous quarter, making it the world’s fastest-growing major economy.<br />
This was the strongest growth rate since Q1 2016. Strong performances<br />
in household spending, financial, real estate and manufacturing sectors<br />
are attributed to the GDP increase.<br />
Taiwan<br />
In Q2 2018, Taiwan’s economy rose to 3.29% y/y, supported by a strong<br />
showing in exports and private consumption. Q2’s GDP beat market<br />
expectations of a 3.08% increase, which is expected to boost the entire<br />
economic growth for 2018. Still, analysts expect Q3 and Q4 growths<br />
to slow.<br />
Indonesia<br />
Indonesia’s economy saw a 5.27% increase y/y in Q2 2018, the highest<br />
(annual) quarterly growth pace under President Joko Widodo, along<br />
with the strongest growth in 4.5 years. The expansion was driven by<br />
faster rises in private consumption and government spending while<br />
fixed investment grew firmly.<br />
Japan<br />
Japan’s economy returned to growth with a 1.9% expansion in Q2 after<br />
declining in Q1. The improved performance stems from a rebound<br />
in private consumption, supported by a tight labor market. Fixed<br />
investment also recovered in the second quarter.<br />
Mainland China<br />
Amid an escalating trade war, China’s economy grew 6.7% y/y in Q2<br />
2018, in line with expectations and above the government’s year growth<br />
target of 6.5%. GDP growth in Q2 was the lowest expansion rate since<br />
Q3 2016. The slower expansion is attributed to the country’s effort to<br />
bring down the national debt. While the tariff battle between the US and<br />
China hasn’t made a significant impact on GDP thus far, it has impacted<br />
business confidence.<br />
Singapore<br />
Singapore’s economy grew 3.9% in Q2, down from Q1’s revised 4.5%<br />
performance and below expectations of 4.1% growth. Slowed growth<br />
was backed by an increase in the manufacturing sector, while the<br />
construction sector contracted. The city-state’s Ministry of Trade and<br />
Industry expects the second half of 2018 to moderate, citing increased<br />
trade tensions between the US and China, as well as tighter financial<br />
conditions globally.<br />
South Korea<br />
South Korea’s economy grew 2.8% in Q2 y/y, coming in with the same<br />
growth that Q1 saw. Private consumption slipped in Q2, coinciding with<br />
a fall in consumer confidence. The first half of 2018 saw unemployment<br />
rates increase, which has left consumers unwilling to spend. Still,<br />
government spending remained strong.<br />
Thailand<br />
Thailand’s economy slowed in Q2 to 4.6 y/y, still beating market<br />
expectations. Government spending rose at a slower pace while<br />
investment, private consumption and exports continued to increase at<br />
a solid pace. Q2 saw a decrease to the number of tourists, slowing from<br />
15.4% in Q1 to 9.1%.<br />
* China's researching area includes Mainland China, Hong Kong, Macau & Taiwan.<br />
4 | ASIAN SKY QUARTERLY — THIRD QUARTER 2018
You could sweat every detail of the deal, from<br />
interest rates to jurisdictional complexity –<br />
\ Or, you could let us.<br />
In a seller’s market, industry relationships and experience can be the difference between closing a sale or missing an opportunity.<br />
Which is where our global team of business aviation experts comes in. From sourcing to closing, we provide a complete suite of financial services<br />
designed to simplify the aircraft acquisition process.<br />
And with more than $2 billion in assets, world-class financial backing, hundreds of years of collective experience, and thousands of business aircraft<br />
transactions behind us, Global Jet Capital is uniquely positioned to craft customized financial solutions.<br />
844.436.8200 \ info@globaljetcapital.com \ globaljetcapital.com<br />
\<br />
Visit Us at NBAA Booth #2251 & Static<br />
THIRD QUARTER 2018 — ASIAN SKY QUARTERLY | 5
ECONOMICS<br />
BUSINESS JET FLEET AND GDP BY COUNTRY<br />
Australia<br />
China<br />
Hong Kong<br />
India<br />
Indonesia<br />
Japan<br />
Malaysia<br />
New Zealand<br />
Papua New<br />
Guinea<br />
Philippines<br />
Singapore<br />
South Korea<br />
Taiwan<br />
Thailand<br />
GDP (BILLION USD)*<br />
BUSINESS JET FLEET<br />
CIVIL TURBINE HELICOPTER FLEET<br />
356<br />
897<br />
12,348<br />
9,491<br />
4,909<br />
5,034<br />
250<br />
749<br />
608<br />
649<br />
642<br />
2,393<br />
1,862<br />
1,564<br />
1,306<br />
913<br />
511<br />
420<br />
323<br />
300<br />
276<br />
272<br />
191<br />
15<br />
1,477<br />
1,235<br />
951<br />
570<br />
421<br />
338<br />
334<br />
319<br />
315<br />
193<br />
20<br />
170<br />
140<br />
114<br />
55<br />
48<br />
43<br />
39<br />
32<br />
20<br />
16<br />
9<br />
3<br />
185<br />
146<br />
138<br />
63<br />
54<br />
52<br />
50<br />
48<br />
38<br />
25<br />
20<br />
19<br />
6<br />
382<br />
274<br />
272<br />
210<br />
170<br />
136<br />
135<br />
128<br />
95<br />
36<br />
14<br />
1<br />
496<br />
292<br />
227<br />
214<br />
171<br />
156<br />
112<br />
106<br />
21<br />
15<br />
6<br />
2013 2014 2015 2016 2017 2018Q1 2018Q2 2013 2014 2015 2016 2017 2018Q1 2018Q2 2013 2014 2015 2016 2017 2018Q1 2018Q2<br />
* 2014 - 2017 ASG data, historically adjusted using Jetnet fleet yearly increases.<br />
* GDP Source: Tradingeconomics.com<br />
Sponsored by<br />
YEAR <strong>EN</strong>D 2017<br />
YEAR <strong>EN</strong>D 2017<br />
YEAR <strong>EN</strong>D 2017<br />
Asia Pacific Business Jet and Civil Helicopter Fleet Report<br />
Comprehensive coverage and overview of the business jet and civil helicopter<br />
fleet in the Asia-Pacific region, visit www.asianskymedia.com for more!<br />
ASIA PACIFIC REGION<br />
ASIA CIVIL PACIFIC HELICOPTERS REGION<br />
CIVIL HELICOPTERS<br />
Sponsored by<br />
ASIA PACIFIC REGION CIVIL HELICOPTER FLEET REPORT – YEAR <strong>EN</strong>D 2016 I<br />
6 | ASIAN SKY QUARTERLY — THIRD QUARTER 2018
广 告<br />
同 级 翘 楚<br />
航 空 新 典 , 邀 您 赏 鉴 。<br />
G500 坐 拥 宽 阔 奢 华 , 纵 享 九 成 音 速 。<br />
何 惧 时 光 飞 流 , 我 有 湾 流 在 手 。<br />
GULFSTREAM.COM<br />
蔡 海 文 (Herman Chai), +86 10 8535 1866 或 +86 139 1064 2948<br />
许 建 钿 (Peter Hoi), +852 2918 1600 或 +852 6928 6988<br />
刘 自 强 (Matthew Liu), +86 10 8535 1866 或 +86 159 0115 7089<br />
Source: JETNET & ASG<br />
THIRD QUARTER 2018 — ASIAN SKY QUARTERLY | 7
G+4+4+4+8+11+11+11+12+15<br />
MOOD & INT<strong>EN</strong>TIONS:<br />
ASIA-PACIFIC REGION SURVEY 2018Q3<br />
In the third quarter of 2018, over 320 respondents participated in ASG’s<br />
survey regarding the mood and intentions of the current business<br />
aviation market.<br />
Regions with the most respondents include:<br />
1. Southeast and Northeast Asia (121 valid respondents, including<br />
Malaysia, Indonesia, Singapore, Brunei, Philippines, Thailand,<br />
Myanmar, Cambodia, Laos, Vietnam, Japan, and South Korea)<br />
2. Greater China (99 valid respondents, including Mainland China,<br />
Taiwan, Hong Kong and Macau)<br />
3. Central Asia (45 valid respondents, including India, Pakistan, UAE,<br />
etc.)<br />
4. Oceania (37 valid respondents, including Australia and New<br />
Zealand)<br />
TOP 10 RESPOND<strong>EN</strong>T’S LOCATION<br />
Japan (4%)<br />
Malaysia (4%)<br />
Indonesia (8%)<br />
Philippines (11%)<br />
India (11%)<br />
Singapore (11%)<br />
20+<br />
84 %<br />
OF TOTAL<br />
RESPOND<strong>EN</strong>TS<br />
Thailand (4%)<br />
Mainland China (20%)<br />
Hong Kong (15%)<br />
Australia (12%)<br />
Almost 70% of the respondents from this quarter’s survey are from aircraft operators and aircraft services providers (FBO, MRO, etc.), as well<br />
as from aircraft brokers (13%), aircraft end users (3%) and other related areas, as well.<br />
RESPOND<strong>EN</strong>T LOCATION<br />
RESPOND<strong>EN</strong>T AIRCRAFT TYPE<br />
RESPOND<strong>EN</strong>T CATEGORY<br />
Rest of the World<br />
(7%)<br />
Oceania (11%)<br />
37+31+14+11+7+G<br />
Turboprop (19%)<br />
Civil Helicopter<br />
(24%)<br />
57+24+19+G 39+30+15+13+3+G<br />
Business Jet (57%)<br />
Aircraft Owner / Charter<br />
User (3%)<br />
Aircraft Sales / Charter<br />
Broker (13%)<br />
Central Asia<br />
(14%) Other (15%)<br />
320+<br />
RESPOND<strong>EN</strong>TS<br />
Southeast & Northeast<br />
Asia (37%)<br />
Greater China (31%)<br />
Service Providers<br />
(FBO,MRO,etc) (39%)<br />
Aircraft Operator (30%)<br />
WHAT IS OUR CURR<strong>EN</strong>T ECONOMIC STATUS?<br />
(QUARTERLY COMPARISON)<br />
Optimistic<br />
(Will get better)<br />
Past Low Point<br />
25% 22%<br />
At Low Point<br />
30% 30%<br />
24%<br />
30%<br />
26%<br />
27%<br />
36%<br />
38%<br />
45%<br />
52%<br />
56%<br />
52%<br />
55%<br />
41%<br />
100%<br />
90%<br />
80%<br />
70%<br />
60%<br />
30%<br />
50%<br />
Pessimistic<br />
(Will get worse)<br />
45%<br />
Not Reached Low Point<br />
48%<br />
46%<br />
47%<br />
34%<br />
35%<br />
27%<br />
34%<br />
21%<br />
32%<br />
15%<br />
34%<br />
10%<br />
37%<br />
11%<br />
28%<br />
16%<br />
27%<br />
32%<br />
40%<br />
30%<br />
20%<br />
10%<br />
0%<br />
2015<br />
Q4<br />
2016<br />
Q1<br />
2016<br />
Q2<br />
2016<br />
Q3<br />
2016<br />
Q4<br />
2017<br />
Q1<br />
2017<br />
Q2<br />
2017<br />
Q3<br />
2017<br />
Q4<br />
2018<br />
Q1<br />
2018<br />
Q2<br />
2018<br />
Q3<br />
8 | ASIAN SKY QUARTERLY — THIRD QUARTER 2018
MOOD & INT<strong>EN</strong>TIONS: ASIA-PACIFIC REGION SURVEY 2018Q3<br />
OPTIMISM LEVELS SINCE 2016Q3 - REGIONAL DIFFER<strong>EN</strong>CES<br />
Greater China SE & NE Asia Central Asia Oceania<br />
Overall<br />
100%<br />
90%<br />
80%<br />
70%<br />
60%<br />
80%<br />
57%<br />
83% 84%<br />
79%<br />
69%<br />
73%<br />
66%<br />
61%<br />
62%<br />
91%<br />
81%<br />
79%<br />
70%<br />
68%<br />
95%<br />
86%<br />
85%<br />
79%<br />
100%<br />
94%<br />
92%<br />
91%<br />
92%<br />
89%<br />
90%<br />
87% 88%<br />
78%<br />
92%<br />
89%<br />
84%<br />
76%<br />
75%<br />
88%<br />
88%<br />
83%<br />
68%<br />
50%<br />
40%<br />
54%<br />
53%<br />
54%<br />
43%<br />
41%<br />
30%<br />
2016<br />
Q3<br />
2016<br />
Q4<br />
2017<br />
Q1<br />
2017<br />
Q2<br />
2017<br />
Q3<br />
2017<br />
Q4<br />
2018<br />
Q1<br />
2018<br />
Q2<br />
2018<br />
Q3<br />
Level of optimistic feelings for economics dropped drastically in 2018<br />
Q3. This quarter, 41% of respondents believed that the economy passed<br />
its low point and will improve, which is 14% lower than 2018 Q2 and the<br />
lowest point since 2017 Q2. The number of respondents who believe<br />
the current economy is at its low point and will get better is 27%; 1%<br />
lower than the previous quarter and the lowest number since 2016 Q3.<br />
Alternatively, 32% of respondents believed that the economy hasn’t<br />
reached its low point and will continue to worsen; this is a 16% increase<br />
compared to 2018 Q2 and is the highest point since 2017 Q1.<br />
One factor for such a drastic change regarding the economy is the<br />
continually elevating Sino-US trade war which has heavily affected the<br />
economic confidence of respondents from Greater China. However,<br />
respondents from Oceania region have shown more optimism.<br />
In general, respondents who believe that the current economic situation<br />
has passed its low point or is at its low point can be described as<br />
optimistic. This quarter, 68% of respondents believed that our economy<br />
will improve in the future; this is a 16% decrease from 2018 Q2 and the<br />
lowest since 2016 Q1.<br />
The optimistic level for Greater China (Mainland, Hong Kong, Macau<br />
and Taiwan) is much lower than average this quarter, after enduring a<br />
35% decline from 2018 Q2. This is the highest decline and lowest point<br />
since 2015 Q4; when the survey began. Central Asia (made up of mainly<br />
respondents from India and Pakistan) showed the highest optimistic<br />
level of 88%, a minor 4% decrease compared to 2018 Q2, yet still at a<br />
very high level. The optimistic level for Southeast and Northeast Asia<br />
has decreased by 6% to 83% compared to last quarter. Oceania, however,<br />
stopped its trend of declining and increased to 88% in 2018 Q3, which is<br />
the highest since 2015 Q4, making it the top two most optimistic regions<br />
— along with Central Asia.<br />
HOW IS YOUR AIRCRAFT UTILIZATION COMPARED TO 12 MONTHS AGO?<br />
100%<br />
Up by 20% and more (>20%)<br />
90%<br />
24%<br />
80%<br />
70%<br />
Up but less than 20% (0 - 20%)<br />
Increased<br />
60%<br />
The same (0%)<br />
36%<br />
50%<br />
40%<br />
30%<br />
20%<br />
Down but less than 20% (-20 - 0%)<br />
21%<br />
Unchanged<br />
10%<br />
0%<br />
2016<br />
Q3<br />
Down by 20% or more (
MOOD & INT<strong>EN</strong>TIONS: ASIA-PACIFIC REGION SURVEY 2018Q3<br />
GREATER CHINA<br />
Improved Aircraft Utilization<br />
AIRCRAFT UTILIZATION:<br />
REGIONAL DIFFER<strong>EN</strong>CES<br />
OPTIMISTIC<br />
47 19 34 34 28 38 29 24 47 18 31 51 22 23 55 21 19 60 18 22 60 21 33 48 232255<br />
PESSIMISTIC<br />
47%<br />
19%<br />
34%<br />
2016<br />
Q3<br />
OCEANIA<br />
46 32 22 38 31 31 31 44 25 23 33 45 25 17 58 21 38 41 30 18 52 47 18 35 261956<br />
PESSIMISTIC<br />
34%<br />
28%<br />
38%<br />
Decreased The Same Increased Signal Line*<br />
29%<br />
24%<br />
47%<br />
18%<br />
31%<br />
51%<br />
22%<br />
23%<br />
55%<br />
21%<br />
19%<br />
60%<br />
18%<br />
22%<br />
Improved Aircraft Utilization<br />
OPTIMISTIC<br />
46%<br />
32%<br />
22%<br />
2016<br />
Q4<br />
38%<br />
31%<br />
31%<br />
2017<br />
Q1<br />
Decreased The Same Increased Signal Line*<br />
31%<br />
44%<br />
25%<br />
2017<br />
Q2<br />
23%<br />
33%<br />
45%<br />
2017<br />
Q3<br />
25%<br />
27%<br />
58%<br />
2017<br />
Q4<br />
21%<br />
38%<br />
41%<br />
30%<br />
18%<br />
60%<br />
2018<br />
Q1<br />
52%<br />
21%<br />
47%<br />
33%<br />
18%<br />
46%<br />
2018<br />
Q2<br />
35%<br />
23%<br />
22%<br />
26%<br />
19%<br />
55%<br />
2018<br />
Q3<br />
56%<br />
This quarter, 18% of respondents (+3% since<br />
last quarter, -25% since 2016 Q1) in the surveyed<br />
area said their expected aircraft utilization has<br />
decreased. 60% of respondents said their<br />
aircraft utilization has increased, which is a 1%<br />
decrease compared to last quarter.<br />
* An Optimistic-Pessimistic Signal Line has<br />
been added to regional aircraft usage trend<br />
analyses for Greater China, Oceania and South<br />
and East Asia regions. An optimistic mood is<br />
derived from more people indicating a ‘higher’<br />
aircraft utilization than 12 months ago, and a<br />
pessimistic mood is derived from more people<br />
indicating ‘lower’ aircraft utilization than 12<br />
months ago.<br />
Greater China<br />
55% of respondents indicated their aircraft<br />
utilization in 2018 Q3 increased, which is a<br />
significantly higher level compared to last<br />
quarter (46% at 2018 Q2), though the same<br />
level compared to 2017 Q3. 22% of respondents<br />
stated their aircraft utilization has lowered<br />
compared to 12 months ago, which is a similar<br />
level compared to previous quarters’ result.<br />
Based on survey results, the ongoing trade talks<br />
have yet to affect aircraft utilization of Chinabased<br />
owners.<br />
Oceania<br />
2016<br />
Q3<br />
2016<br />
Q4<br />
2017<br />
Q1<br />
2017<br />
Q2<br />
2017<br />
Q3<br />
SOUTHEAST AND NORTHEAST ASIA<br />
2017<br />
Q4<br />
2018<br />
Q1<br />
2018<br />
Q2<br />
2018<br />
Q3<br />
356% of respondents have indicated their<br />
aircraft utilization increased, a 21% increase<br />
from 2018 Q2. 26% of respondents believe<br />
their aircraft utilization decreased, 21% lower<br />
than the previous quarter. High aircraft<br />
utilization may be reflective of respondent’s<br />
high economic optimism.<br />
Improved Aircraft Utilization<br />
OPTIMISTIC<br />
PESSIMISTIC<br />
37 27 33 26 22 27 17 10 14<br />
28 35 36 37 48 19 18 56 13 65 14 59 22 61 20 70 2264<br />
37%<br />
28%<br />
35%<br />
27%<br />
36%<br />
37%<br />
Decreased The Same Increased Signal Line*<br />
33%<br />
48%<br />
19%<br />
26%<br />
18%<br />
56%<br />
26%<br />
13%<br />
65%<br />
27%<br />
14%<br />
59%<br />
17%<br />
22%<br />
61%<br />
10%<br />
20%<br />
70%<br />
14%<br />
22%<br />
64%<br />
Southeast and Northeast Asia<br />
In 2018 Q3, 64% of respondents recorded an<br />
increased use of aircraft, which is 6% lower<br />
compared to 2018 Q2. 14% of respondents<br />
believe that their aircraft utilization decreased,<br />
which is 4% higher compared to last quarter.<br />
2016<br />
Q3<br />
2016<br />
Q4<br />
2017<br />
Q1<br />
2017<br />
Q2<br />
2017<br />
Q3<br />
2017<br />
Q4<br />
2018<br />
Q1<br />
2018<br />
Q2<br />
2018<br />
Q3<br />
10 | ASIAN SKY QUARTERLY — THIRD QUARTER 2018
G+31+12<br />
MOOD & INT<strong>EN</strong>TIONS: ASIA-PACIFIC REGION SURVEY 2018Q3<br />
SATISFACTION KEY FACTORS:<br />
CHARTER OPERATOR VS. CHARTER BROKER<br />
(OUTER IS BETTER)<br />
Operational<br />
Safety<br />
Charter<br />
Operator<br />
Customer Service<br />
Charter<br />
Broker<br />
Most Satisfied<br />
Operational<br />
Efficiency<br />
DO YOU OR YOUR CLI<strong>EN</strong>T OWN OR CHARTER<br />
A PRIVATE AIRCRAFT?<br />
57+<br />
Just Own (31%) Both Own and Charter (57%)<br />
Just Charter (12%)<br />
WH<strong>EN</strong> CHARTERING AN AIRCRAFT, WHAT IS<br />
YOUR PRIMARY SOURCE?<br />
Quality of<br />
Maintenance<br />
Quality of<br />
On-board Service<br />
Value for<br />
Money (Price)<br />
16+84+G<br />
Contact Operator (84%) Contact Broker (16%)<br />
In this quarter’s market survey, ASG recorded over 80 rankings from the<br />
Asia-Pacific region regarding the satisfaction factors of management<br />
companies and those of charter brokers. Over 280 respondents answered<br />
questions regarding end users’ travel behaviours.<br />
On the charter operator / broker side, when asked the primary choice<br />
when chartering an aircraft, 84% of respondents would contact a charter<br />
operator first.<br />
WHERE ARE WE IN THE CURR<strong>EN</strong>T<br />
PRE-OWNED MARKET?<br />
PURCHASE INT<strong>EN</strong>TION 2016Q3 - 2018Q3*<br />
2017Q3<br />
2017Q4<br />
2018Q1 2018Q2 2018Q3<br />
Yes, a new aircraft<br />
Yes, a pre-owned aircraft<br />
No / I’m not sure<br />
49%<br />
39%<br />
40%<br />
47%<br />
43%<br />
36%<br />
38%<br />
43%<br />
56<br />
54%<br />
59%<br />
23%<br />
29%<br />
28%<br />
26%<br />
21%<br />
21%<br />
17%<br />
14%<br />
10%<br />
8%<br />
29%<br />
28%<br />
25%<br />
23%<br />
22%<br />
41% 38%<br />
31% 33%<br />
27% 29%<br />
41% 40%<br />
31% 31%<br />
28%<br />
31%<br />
37%<br />
32%<br />
31%<br />
2%<br />
4%<br />
5%<br />
19%<br />
19%<br />
Buyer’s Market in<br />
general - High supply,<br />
low demand<br />
Balanced Market in<br />
general - Demand<br />
and Supply are on<br />
the same level<br />
Seller’s Market in general<br />
- High demand,<br />
low supply<br />
I’m not sure 2016 2016 2017 2017<br />
Q3 Q4 Q1 Q2<br />
2017<br />
Q3<br />
2017<br />
Q4<br />
2017<br />
Q1<br />
2018<br />
Q2<br />
* Since 2017 Q3’s market survey, a new method was applied filtering out those<br />
2018<br />
Q3<br />
respondents who are not relevant to this question, hence reflecting a percentage<br />
drop in the category “No / I’m not sure”.<br />
THIRD QUARTER 2018 — ASIAN SKY QUARTERLY | 11
MOOD & INT<strong>EN</strong>TIONS: ASIA-PACIFIC REGION SURVEY 2018Q3<br />
PURCHASE INT<strong>EN</strong>TION - REGIONAL DIFFER<strong>EN</strong>CES (FIXED WING)<br />
Corporate Airliner Large Jet Medium Jet Small Jet Turboprop / Piston Fixed Wing<br />
Central Asia 17% 22% 22% 17%<br />
22%<br />
Greater China<br />
19% 44% 25%<br />
7%<br />
4%<br />
Oceania 7% 21% 7% 36% 29%<br />
SE & NE Asia<br />
17% 28% 19% 13%<br />
23%<br />
PURCHASE INT<strong>EN</strong>TION<br />
PURCHASE INT<strong>EN</strong>TION - FIXED WING<br />
(OUTER IS PREFERRED)<br />
Regarding Asia-Pacific based professional aircraft sales’ opinion of the<br />
current pre-owned market, 43% of respondents believed that the current<br />
market is still in a ‘Buyer’s Market’ with low demand and high supply.<br />
This is lower compared to last quarter, but still the result is affected by<br />
respondents from Greater China. 38% (28% last quarter) of respondents<br />
believed that we are now in a balanced market with equal demand and<br />
supply; a 10% increase compared to last quarter. The remaining 14%<br />
(-3%, 17% last quarter) believed that we have moved into a ‘Seller’s<br />
Market’, with higher demand on the market.<br />
Turboprop/Piston<br />
Fixed Wing<br />
(Such as King Air Series)<br />
Corporate Airliner<br />
(Such as ACJ, BBJ)<br />
Most Preferred<br />
Large Jet<br />
(Such as G650,<br />
Falcon 8X)<br />
Based on the Market Dynamic analysis from ASG’s research department,<br />
ASG now believes the pre-owned business jet market has entered a<br />
balanced market. Notably, the pre-owned market for the large and longrange<br />
business jet markets have improved. For details, please go to the<br />
Market Dynamics section of this issue of ASQ.<br />
Small Jet<br />
(Such as Citation Series, Hawker Series)<br />
Midsize Jet<br />
(Such as G200 & CL650)<br />
Regarding the Purchase Intentions of 2018 Q3, ASG noticed that the<br />
demand for both new aircraft and pre-owned aircraft has slightly risen<br />
and together they represent over 62% of the respondents who now have<br />
the intention of buying an aircraft.<br />
higher need for large jets, while turboprops and small jets are more<br />
suitable for Oceania. Corporate airliners are commonly needed (17-<br />
19%) in all areas except Oceania. Additionally, the medium and small jet<br />
categories are wanted, but on a relatively lower level.<br />
Purchase intention by region is shown in a graph to understand regional<br />
differences for fixed-wing aircraft. Greater China has a significantly<br />
PURCHASE DECISIONS - INFLU<strong>EN</strong>CING FACTORS<br />
(OUTER IS LIMITING)<br />
Greater China Oceania Central Asia SE & NE Asia<br />
Government / Public Opinion<br />
PURCHASE INT<strong>EN</strong>TION - HELICOPTER<br />
(OUTER IS PREFERRED)<br />
Twin Turbine<br />
(Such as Sikorsky S-76C++)<br />
Most Limiting<br />
Most Preferred<br />
No Need<br />
No Interesting Aircraft<br />
Piston Helicopter<br />
(Such as Robinson R22)<br />
Single Turbine Helicopter<br />
(Such as Bell 206)<br />
Price<br />
12 | ASIAN SKY QUARTERLY — THIRD QUARTER 2018
TRAINING REPORT AD. TBD
SPECIAL FEATURE: TRAINING REPORT 2018<br />
PILOT DEMAND<br />
WITH THE NEED FOR INCREASED CONNECTIVITY COMES A GLOBAL DEMAND FOR PILOTS. THE<br />
ASIA PACIFIC LEADS THE DEMAND FOR GROWTH, REQUIRING 261,000 PILOTS BY 2037, ACCORDING<br />
TO BOEING’S 2018 PILOT OUTLOOK. PILOT DEMAND IS DRIV<strong>EN</strong> BY INCREASED NUMBERS OF<br />
PASS<strong>EN</strong>GERS, AIR CARGO AND MORE WIDESPREAD AIRCRAFT UTILIZATION IN VARIOUS FIELDS<br />
INCLUDING FARMING (CROP DUSTING, AERIAL MUSTERING) AND EMERG<strong>EN</strong>CY SERVICES, SUCH AS<br />
PATI<strong>EN</strong>T TRANSPORTATION.<br />
2027<br />
COMMERCIAL<br />
+90,000<br />
Pilots<br />
HELICOPTER<br />
+9,600<br />
Pilots<br />
BUSINESS JET<br />
NOTE:<br />
Airline pilot demand figure source: CAE<br />
Airline Pilot Demand Outlook Report.<br />
+2,850<br />
Pilots<br />
COMMERCIAL<br />
Airlines are the largest driver of pilot demand. According to CAE’s<br />
“Airline Pilot Demand Outlook” report, the annual global passenger<br />
number is projected to increase by 1.6 billion to 4.8 billion by 2027.<br />
More passengers drive aircraft production, which, in turn, drives<br />
demand for more pilots to operate new aircraft.<br />
An airliner is flown by two pilots at any given time; however, extra<br />
pilots are required on long-haul flights to comply with maximum<br />
flight time limitations. Moreover, since pilots typically fly around<br />
15 days a month, pilots need to work in shifts, further increasing<br />
the pilot-per-aircraft ratio. The exact ratio is determined by aircraft<br />
utilization and aviation authority regulations. One regional aircraft<br />
may require 10 pilots, and one wide-body jet may need up to 16<br />
pilots to operate frequent long-haul flights.<br />
Airlines are expected to create jobs for 255,000 new pilots over<br />
the next 10 years in Asia Pacific: 70% of these will accommodate<br />
for fleet growth and the remaining 30% will replace pilots who<br />
retire or switch profession. The Asia Pacific also needs to address<br />
the issue of retiring pilots. With an average pilot age of 46 as of<br />
2016 pointed out by CAE’s report, the industry will lose a good<br />
number of qualified and trained pilots in the coming years as they<br />
reach the mandatory 65 years old retirement age. This means<br />
that the industry will demand not just more pilots overall, but<br />
disproportionately more highly experienced pilots, to place them<br />
into captain positions previously occupied by older employees.<br />
14 | ASIAN SKY QUARTERLY — THIRD QUARTER 2018
BUSINESS AVIATION<br />
Demand for pilots in the business aviation industry is also growing.<br />
As of 2017 yearend, ASG estimate there were about 4,500 business<br />
jet pilots in APAC and forecast the figure will reach 6,500 by 2027. The<br />
Asia-Pacific Region will require an increase of 2,850 pilots by 2027. The<br />
forecast considers new pilots needed to meet both the demands of<br />
the growing market as well as to replace the retiring business aviation<br />
pilots.<br />
The projection uses past information about business jet fleet growth in<br />
the Asia Pacific in conjunction with average ratios of pilot-per-aircraft<br />
in the business aviation sector to estimate past pilot demand trends.<br />
It also considers a number of economic trends including expected<br />
GDP growths of APAC nations to estimate jet fleet, and therefore pilot<br />
demand growth up to 2027.<br />
In terms of aircraft, large and long-range jets drive the most demand<br />
for pilots in the Asia Pacific. Larger jets require more pilots for one<br />
aircraft, an average of four pilots, as they are primarily used for longer<br />
range non-stop intercontinental routes.<br />
However, light and medium-sized jets can<br />
require three pilots or less. Further, large and<br />
long-range jets account for particularly large<br />
proportions of total aircraft fleets in Asia<br />
Pacific and together made up almost 54%<br />
of the total business jet fleet in 2017. In the<br />
past five years, Indonesian large and longrange<br />
jets made up on average 49.2% of the<br />
entire fleet. In Hong Kong and in Macau they<br />
accounted for 85.9% and 74.7%, respectively.<br />
Asia Pacific Business Jet Pilot Demand<br />
Projection<br />
Number of Pilots<br />
7,000<br />
6,500<br />
6,000<br />
5,500<br />
5,000<br />
4,500<br />
4,000<br />
3,500<br />
3,000<br />
0<br />
2014 2016 2018 2020 2022 2024 2026 2028<br />
Major large and long-range business jet OEMs<br />
such as Bombardier, Gulfstream and Dassault<br />
might consider expanding the capacity of their<br />
Asian training bases to be able to train more<br />
pilots for their type ratings. In terms of basic<br />
pilot training, this would require more schools<br />
to offer multi-engine and instrument ratings.<br />
HELICOPTER<br />
Helicopter pilot demand is also on the rise. The number of pilots<br />
demanded in the Asia Pacific increased from 12,800 in 2014 to 14,600<br />
in 2017 and is predicted to grow steadily for the next 10 years. By<br />
2027, the region may need up to 23,000 pilots to participate in a range<br />
of missions, such as offshore, SAR, law enforcement and corporate<br />
charter.<br />
Multi-mission is expected to be the greatest source of pilot demand<br />
growth as it will need over 10,000 pilots by 2027. This implies that<br />
more training schools may need to start offering more specialized<br />
training to maintain competitiveness. Relevant courses might include<br />
sling rating, low level rating and more specialized courses, such as<br />
aerial mustering or mountain rating.<br />
Asia Pacific Helicopter Pilot Demand<br />
Projection<br />
Number of Pilots<br />
25,000<br />
20,000<br />
18,000<br />
16,000<br />
14,000<br />
12,000<br />
10,000<br />
2014 2016 2018 2020 2022 2024 2026 2028<br />
THIRD QUARTER 2018 — ASIAN SKY QUARTERLY | 15
SPECIAL FEATURE: SPECIAL MISSIONS TRAINING<br />
SPECIAL MISSIONS TRAINING REFERS TO TEACHING FIXED-<br />
AND ROTARY-WING PILOTS AND CREW THE NECESSARY SKILLS<br />
TO PARTICIPATE IN SEARCH AND RESCUE (SAR), EMERG<strong>EN</strong>CY<br />
MEDICAL SERVICE (EMS) AND FIREFIGHTING OPERATIONS.<br />
CURR<strong>EN</strong>T STATE IN APAC<br />
In the Asia Pacific, Australia and New Zealand<br />
are the only countries with training schools<br />
which offer special missions courses and<br />
have their own aircraft. Simulator and ground<br />
crew courses are also offered in India,<br />
Singapore, Indonesia and in the Philippines.<br />
After the development of the helicopter, rotary aircraft quickly<br />
gained popularity in special mission operations. Early versions<br />
of helicopters were used as early as the Second World War<br />
primarily by Germany, USA and Great Britain, though predominantly<br />
for transportation of soldiers rather than in combat. During the 1950s<br />
Korean Conflict, helicopters were used for EMS, though the first inflight<br />
medical treatment did not occur until the war in Vietnam. The<br />
1950s also marked the initial uses of helicopters for SAR.<br />
Although quickly adopted, helicopters were not immediately accepted<br />
as essential aircraft. During the Korean conflict, for example, Major<br />
General James M. Gavin requested helicopters from the director<br />
of requirements for the Air Force. However, he was told that "the<br />
helicopter is aerodynamically unsound... and no matter what the Army<br />
says, I know that it does not need any."<br />
As of 2018, Australia is the market leader, with 13 schools offering a<br />
broad range of special mission courses ranging from water bucket<br />
dropping for firefighting to personnel insertion and extraction for<br />
emergencies in SAR missions.<br />
Although special missions training is available both in Australia and<br />
in New Zealand, the latter market is far more restricted in terms of<br />
training availability. The reason behind this is fierce competition<br />
between emergency aerial services providers. The New Zealand<br />
government outsources missions such as firefighting to private<br />
contractors, but supply outweighs demand. And since most special<br />
missions training schools exist as sub-divisions of private operators,<br />
companies are wary of training external personnel, for fear of assisting<br />
a competing organisation. Thus, in New Zealand, special missions<br />
training is typically an in-house and less formal activity than in<br />
Australia.<br />
The difference in course availability is caused by high costs of training.<br />
While EMS training can mostly be conducted on the ground through<br />
simulations, firefighting operations need to be practiced in the air,<br />
which means these courses are significantly more expensive both for<br />
the school and for the end students.<br />
Countries where training infrastructure is less developed tend to<br />
send pilots abroad, typically to the United States, to complete special<br />
missions training. Training is also frequently outsourced to aircraft<br />
manufacturers as part of a purchase package. For example, when<br />
the Philippine navy ordered over 100 million euros worth of AW159<br />
helicopters in 2017, the contract with Leonardo also included training<br />
and multi-year support for local pilots.<br />
HOW DOES THIS COMPARE TO THE US?<br />
Sixty years later, helicopters are now utilized in day-to-day operations<br />
not only by the military, but also by firefighters to combat wildfires,<br />
by medical organizations to respond to critical patients in remote<br />
destinations, police for pursuits and to track fugitives or missing<br />
persons, and by many others.<br />
Fixed-wing aircraft are typically used as air ambulances. The Royal<br />
Flying Doctor Service (RFDS) was the first formal air ambulance<br />
organizations established in 1934 in the Australian outback. RFDS still<br />
operates today and is one of the most comprehensive aeromedical<br />
organizations in the world.<br />
The Asia-Pacific region has fewer schools offering special<br />
missions training than the United States, where schools are mostly<br />
concentrated in California. Though where the APAC region lacks<br />
quantity, it exhibits quality regulation when it comes to special<br />
mission courses. Australia is the only country in the world which<br />
requires a formal qualification for firefighting pilots. Pilots wishing<br />
to become firefighters must complete a five-hour course to receive<br />
a Firefighting Endorsement under the Aerial Application rating<br />
according to CASA Part 61 regulations. In other countries, pilots only<br />
require a sling endorsement to take part in firefighting missions; and<br />
while this endorsement is helpful because it teaches pilots to carry<br />
heavy loads with a helicopter, it is not fully comprehensive as it does<br />
not teach pilots how to conduct safe aerial operations in high risk<br />
scenarios that arise during fires.<br />
The increased use of aircraft in special mission operations has created<br />
demand for training schools and courses for pilots and for supporting<br />
aircrew and groundcrew.<br />
16 | ASIAN SKY QUARTERLY — THIRD QUARTER 2018
EMS<br />
EMS training is most widely available in the special missions category,<br />
with 17 schools in APAC offering relevant courses either for pilots, for<br />
aircrew or for both. However, the job description of a pilot participating in<br />
EMS operations is very similar to that of a charter pilot. Therefore, special<br />
training is mostly provided to supporting aircrew, who have direct contact<br />
with patients in critical conditions. Specialist courses include clinical<br />
simulation training and aeromedical retrieval training as well as general<br />
courses to familiarize non-aviation professionals with helicopter or fixed<br />
wing operations.<br />
FIREFIGHTING<br />
12 schools in APAC offer firefighting training. Courses are mainly for<br />
pilots rather than aircrew, and they cover skills such as water bucket<br />
and belly tank dropping, wire avoidance, as well as incendiary delivery.<br />
Unlike in Australia, most countries’ firefighting training courses are not<br />
standardized, so operators choose how to train their pilots on a caseby-case<br />
basis. It is common to take a pilot under training on an active<br />
firefighting mission, so he/she can observe the procedure and learn to<br />
cope with the stressful environment of a firefighting operation.<br />
Both fixed- and rotor-wing aircraft are used in firefighting missions.<br />
Airplanes are often adapted from crop dusters and other large tankers,<br />
whereas helicopters, which dominate the firefighting fleet, are used in<br />
regular configuration with slings attached. Firefighter pilots come from<br />
a range of backgrounds, although utility-background pilots are the<br />
most likely to pursue this route because they have highly transferrable<br />
skills for aerial firefighting.<br />
SAR<br />
SAR training is third in popularity in APAC, with seven schools offering<br />
relevant courses. Courses cover hoist operations, high angle rescue,<br />
urban SAR and piloting techniques over difficult terrain such as<br />
mountain, water and boat. Much like with firefighting, many SAR<br />
trainees come from a utility background; ex-military pilots also often<br />
participate in this kind of training. SAR pilots then go on to work in<br />
numerous areas, such as in the mountains, where they rescue skiers,<br />
or in coastguard service, where they assist boat crews in adverse<br />
weather conditions.<br />
LAW <strong>EN</strong>FORCEM<strong>EN</strong>T<br />
Only two schools in the Asia-Pacific offer police pilot training.<br />
One reason for this is the lack of demand for law enforcement<br />
helicopter pilots. Police authorities in the Asia-Pacific have<br />
comparatively fewer helicopters than police forces in the US. For<br />
example, Indian and Australian law enforcement fleets only have<br />
six and 11 rotorcraft respectively. Moreover, some governments<br />
choose to train students abroad. Budding Chinese police pilots<br />
are sent over to train with Air Rescue Systems or UTC Aerospace<br />
Systems training centers in the US.<br />
Nonetheless, existing courses cover both advanced piloting<br />
techniques and more combat-focused activities, such as electrooptical<br />
pod training, weapon firing and deflection shooting.<br />
Students typically come from military background and move on to<br />
work for the government service.<br />
POWERLINE<br />
Powerline training is the least popular in the Asia Pacific, as only<br />
one school offers such training in the entire region. This is partly<br />
because powerline training is particularly complex, and much like<br />
the Chinese government many operators choose to send their pilots<br />
to experienced instructors in the USA to be trained for this job.<br />
Powerline pilots are taught to fly in very close proximity to towers,<br />
poles and electrical wires, and hover in place while they suspend<br />
a lineman below the helicopter, so he/she can work on live<br />
transmission lines. The job requires the pilot to have full control<br />
of the aircraft, exhibit impeccable accuracy and communicate<br />
effectively with the lineman worker.<br />
THIRD QUARTER 2018 — ASIAN SKY QUARTERLY | 17
SPECIAL FEATURE:<br />
JEFFREY C. LOWE,<br />
ASIAN SKY GROUP, MANAGING DIRECTOR,<br />
US-CHINA RELATIONS<br />
After months of flexing their political muscles, Presidents Donald Trump and Xi Jinping have rocked the<br />
world with a full-blown trade war. Once long-time trading partners, the world’s two leading economies<br />
have exchanged “tit for tat” tariffs on each other’s products totalling US$360B and left the rest of the<br />
world in shock and wonder as to what would happen next.<br />
When the threats finally materialized — with the US introducing its<br />
first wave of tariffs in July 2018 on Chinese imports, stock markets<br />
were met with volatility and industries across the board were left<br />
with unsettling feelings.<br />
One of the first Chinese industries hit was aviation, where the US<br />
placed tariffs on are aircraft and aircraft parts. Though tariffs on<br />
Chinese-built aircraft won’t affect the global market, it does put<br />
a damper on the country’s own growing aviation industry and<br />
ambitions during a time when several of these manufacturers are<br />
still in production and development phases.<br />
In retaliation, Beijing announced a 25% tariff on US aircraft with an<br />
empty weight of between 15,000 kilograms and 45,000 kilograms,<br />
which would undoubtedly hits the large-cabin business jet industry,<br />
meaning Gulfstream’s G550 and G650 models, but avoids some of<br />
the larger airliners and smaller turboprops.<br />
Ultimately, when a revised list of goods to be imposed with tariffs<br />
was released by China, aircraft were left off. The industry has since<br />
been able to breathe a sigh of relief, but the threat of impending<br />
tariffs have already left an impression.<br />
So, what’s next? Manufacturers, buyers and sellers are all in a ‘wait<br />
and see’ situation. Will tariffs finally be imposed in the next round<br />
of tariff exchanges in this growing trade war? That’s an answer no<br />
one can answer — yet.<br />
economic uncertainty of any kind is thrown into the mix, consumer<br />
confidence is affected, as we witnessed in this quarter’s Market<br />
Survey; this is the bigger issue today. An aircraft is a substantial<br />
investment, requiring a great deal of capital. Will buyers be willing<br />
to spend such capital during periods of uncertainty?<br />
This is a tricky question; one which will be analyzed until aviation<br />
tariffs are or aren’t definitely put in place. The discussions will<br />
ponder how to circumvent potential tariffs by not importing and<br />
registering aircraft overseas; perhaps buying pre-owned instead<br />
or leasing. Of course, another way to avoid the tariff is to avoid<br />
American manufacturers altogether, possibly giving Canada-built<br />
Bombardier and French manufacturer Dassault Falcon a step up<br />
in the game, although any “trade” bump in sales is unlikely to be<br />
experienced.<br />
Today, China’s economy comes second to the US economy. But,<br />
by many accounts, the US will fall to second place behind China in<br />
the foreseeable future. So two is the case of aviation. Today, the<br />
US is the largest air travel market. But, again, by most accounts,<br />
China will overtake the US as the top aviation market in as little as<br />
five years.<br />
So, while the complex situation between these two global<br />
powerhouses continues, industries in all segments are preparing<br />
themselves for the worst, while simultaneously realizing just how<br />
significant the other is.<br />
For now, the initial scare — or rather, warning shot — was enough<br />
to throw the business aviation industry off its course. And when<br />
18 | ASIAN SKY QUARTERLY — THIRD QUARTER 2018
COUNTRY PROFILE<br />
GREATER CHINA<br />
HARBIN<br />
30<br />
31<br />
SH<strong>EN</strong>YANG TAOXIAN<br />
45<br />
78<br />
2<br />
11<br />
12 13 14 15 16 17 59 60 61 62<br />
BEIJING CAPITAL INT'L | BADALING<br />
48 SHIJIAZHUANG DAGUOCUN INT'L<br />
18 BINZHOU DAGAO G<strong>EN</strong>ERAL<br />
5 40 41 42 43 44 81 82 SHANGHAI HONGQIAO INT'L<br />
TIANJIN BINHAI INT'L 10 52 53 54 78<br />
JINAN YAOQIANG 17<br />
QINGDAO 39 86<br />
3<br />
56<br />
79<br />
XI'AN XIANYANG INT'L<br />
57 DALU G<strong>EN</strong>ERAL AVIATION<br />
23 24 GUANGHAN<br />
11 20 21 CH<strong>EN</strong>GDU SHUANGLIU INT'L<br />
55 XIANGFAN<br />
38<br />
NINGBO<br />
HANGZHOU 3 69<br />
22 CHONGQING<br />
3 19 CHANGSHA HUANGHUA INT'L<br />
JINGDEZH<strong>EN</strong><br />
35 36<br />
4<br />
7<br />
49 50 51<br />
83<br />
84<br />
85<br />
TAIPEI TAOYUAN INT'L | TAIPEI SONGSHAN<br />
1<br />
3<br />
25 26 27 28 63 64 65 66 67<br />
GUILIN LIANGJIANG INT'L<br />
GUANGZHOU BAIYUN INT'L<br />
33<br />
XIAM<strong>EN</strong> GAOQI INT'L<br />
9 46 47<br />
SH<strong>EN</strong>ZH<strong>EN</strong> BAO'AN INT'L<br />
3<br />
NANNING WUXU INT'L<br />
51<br />
TAINAN<br />
60<br />
ZHUHAI JINWAN<br />
3<br />
29<br />
HAIKOU MEILAN INT'L<br />
HONG KONG INT'L 70<br />
6<br />
32<br />
71<br />
33 34 58 66<br />
72 73 74 75<br />
68<br />
76<br />
69<br />
77<br />
MACAU INT'L<br />
8<br />
34<br />
37<br />
SANYA PHO<strong>EN</strong>IX INT'L<br />
3<br />
Airport FBO MRO Top Operator<br />
1<br />
Baiyun Airport BAC<br />
19<br />
Jielian Aircraft MA.<br />
37<br />
Skytech Engineering<br />
55<br />
Sky-Blue<br />
73<br />
Meridian<br />
2<br />
Beijing Capital Jet<br />
20<br />
Dachuan GA<br />
38<br />
GDAT<br />
56<br />
China Flight GA<br />
74<br />
Metrojet<br />
3<br />
Deer Jet<br />
21<br />
SMECO<br />
39<br />
Jiutian Flight Academy<br />
57<br />
Zhenjiang Aerochine<br />
75<br />
Sino Jet<br />
4<br />
EVA SKY JET C<strong>EN</strong>TER<br />
22<br />
Chongqing GA<br />
40<br />
Boeing SC<br />
58<br />
Metrojet<br />
76<br />
TAG Aviation<br />
5<br />
Hawker Pacific<br />
23<br />
CA Flight Univ.<br />
41<br />
China Eastern<br />
59<br />
Beijing Airlines<br />
77<br />
Vision Aviation<br />
6<br />
HKBAC<br />
24<br />
Xilin Feng Teng GA<br />
42<br />
Hawker Pacific<br />
60<br />
Deer Jet<br />
78<br />
Lily Jet<br />
7<br />
Huan Yu VIP Terminal<br />
25<br />
Champion Heli Tech<br />
43<br />
Kingwing GA<br />
61<br />
Mandarin Air<br />
79<br />
China Zhongfei GA<br />
8<br />
MBAC<br />
26<br />
GAMECO<br />
44<br />
STARCO<br />
62<br />
Sino Jet<br />
80<br />
Nanshan Jet<br />
9<br />
Shenzhen Joyee<br />
27<br />
H&P GA<br />
45<br />
China Southern<br />
63<br />
Amber Aviation<br />
81<br />
China Eastern<br />
10<br />
Tianjin Airport BAC<br />
28<br />
Suilian Heli GA<br />
46<br />
Avion Pacific<br />
64<br />
Astro Air<br />
82<br />
Deer Jet<br />
11<br />
12<br />
13<br />
14<br />
15<br />
16<br />
17<br />
18<br />
AMECO<br />
Beijing Airines<br />
Beijing Dingshi GA<br />
BJ Capital Heli<br />
Deer Jet<br />
Gulfstream Beijing(JV)<br />
STAECO<br />
Shandong Hairuo GA<br />
29<br />
30<br />
31<br />
32<br />
33<br />
34<br />
35<br />
36<br />
HNA Aviation Technik<br />
AVIC (Harbin)<br />
China Flying Dragon<br />
CASL<br />
HAECO<br />
Jet Aviation`<br />
AVIC CHAC<br />
JX Changhe Agusta Heli.<br />
47<br />
48<br />
49<br />
50<br />
51<br />
52<br />
53<br />
54<br />
COHC GAMEC<br />
Cessna-Avic Aircraft<br />
Air Asia<br />
EVA SKY JET C<strong>EN</strong>TRE<br />
Mandarin Airlines<br />
Bombardier SC<br />
Eastern GA<br />
ExecuJet Haite<br />
65<br />
66<br />
67<br />
68<br />
69<br />
70<br />
71<br />
72<br />
BAA<br />
Brilliant Jet<br />
Donghai Jet<br />
Gama Aviation<br />
Global Jet Concept<br />
HK Bellawings<br />
Hongkong Jet<br />
Jet Aviation<br />
83<br />
84<br />
85<br />
86<br />
EVA Airways Corporation<br />
Executive Aviation Taiwan<br />
Win Air<br />
Sparkle Roll Jet<br />
THIRD QUARTER 2018 — ASIAN SKY QUARTERLY | 19
COUNTRY PROFILE: GREATER CHINA<br />
GREATER CHINA<br />
by Litalia Yoakum<br />
With a population of over 1.35 billion people, not including Taiwan, Hong<br />
Kong and Macau, Mainland China is the most populated country in the<br />
world. From North to South along the eastern border are the country’s<br />
most populated provinces, while the inner and western provinces are<br />
much less inhabited because of its geographical makeup.<br />
As one of the world’s largest economies, second only to the US — and<br />
first by many accounts, China is an influential player in the global<br />
economy; one that can’t be overlooked. After introducing its Open Door<br />
Policy in 1978 — set in place by then-party leader Deng Xiaoping, the<br />
country opened itself up to foreign investment, trade and the setup of<br />
foreign businesses. Since then its economy has transformed, developing<br />
into the world’s largest manufacturing economy and fastest growing<br />
consumer market.<br />
The HNW and UHNWI populations in Greater China have grown<br />
exponentially, as well. According to WealthX, the number of UHNWIs —<br />
with assets of over US$50M — reached 19,257 by 2018.<br />
Still, this swift economic growth isn’t without challenge. Recent divide<br />
over tariffs on US and Chinese goods has left uncertainty between<br />
two of the largest, global trading partners; threatening to permanently<br />
weaken their economic relationship. This tension has hit all industries,<br />
including aircraft manufacturers. While analysts have yet to determine<br />
what the full impact of a trade war would be, the Chinese government’s<br />
economic outlook remains positive.<br />
In a bid to further drive the economy, one of the government’s most<br />
recent ventures is its Greater Bay Area Initiative; bringing together the<br />
Special Administrative Regions (SAR) of Macau and Hong Kong — both<br />
of which operate under the ‘one country, two systems’ principle, entitling<br />
each to retain their own economic and administrative systems — along<br />
with the Guangdong Province in Mainland China. This ambitious plan,<br />
including the Hong Kong-Zhuhai-Macau Bridge and an Express Rail Link<br />
between Hong Kong, Shenzhen and Guangzhou, is set to integrate the<br />
regions physically and economically, as well as to tie each SAR a bit<br />
closer to Beijing.<br />
Capitalizing on China’s rapid expansion are the equally-growing general<br />
and business aviation industries. Growth in these industries has<br />
long been correlated with economic expansion and now, with recent<br />
economic reform and a push for more infrastructure, China’s aviation<br />
industry is more notable than ever before.<br />
Passenger traffic will<br />
continue to grow and<br />
the demand for aircraft<br />
will increase to meet<br />
the growing need.<br />
Business Jet Fleet Distribution by Age<br />
16-20 Years, 37 (7%)<br />
11-15 Years, 66 (13%)<br />
6-10 Years, 264 (52%)<br />
24+52+13+7+4+G<br />
>20 Years, 22 (5%)<br />
0-5 Years, 123 (24%)<br />
Business Jet Fleet by Operators and OEM<br />
57 +39 +16 +15 +14+12 +12 +11 +11 +7<br />
57<br />
39<br />
Deer Jet<br />
BAA<br />
Sino Jet<br />
TAG Aviation<br />
Total Fleet<br />
512<br />
16 15 14 12 12 11 11 7<br />
China Eastern<br />
Lily Jet<br />
Nanshan Jet<br />
LilyAstro Air<br />
Total<br />
Airbus 2 5 1 8<br />
Beoing 4 2 1 3 10<br />
Bombardier 1 7 1 7 1 5 10 1 4 37<br />
Cessna 1 1<br />
Dassault 8 9 1 3 2 1 1 25<br />
Embraer 3 5 1 5 5 19<br />
Gulfstream 37 15 7 3 7 7 1 1 9 1 88<br />
Hawker 5 1 6<br />
Total 57 39 16 15 14 12 12 11 11 7 194<br />
Data Source: Asian Sky Group Fleet Report (Year-End 2017)<br />
STATUS QUO<br />
Mainland China’s aviation market is set to become the largest in the world,<br />
overtaking the US as the current market leader, according to forecasts by<br />
both Boeing and the International Civil Aviation Organization. Passenger<br />
traffic will continue to grow and the demand for aircraft will increase<br />
to meet the growing need. While these numbers are reflective of the<br />
commercial aviation sector, business and general aviation are likewise<br />
experiencing growth.<br />
2017 was a strong year for the business jet market in Greater China.<br />
Maintaining its position as the Asia-Pacific market leader at yearend<br />
2017, with 512 jets up from 476 at yearend 2016; the Greater China<br />
region experienced 7.6% growth almost doubling the annual growth rate<br />
of 4.4% in 2016.<br />
HongKong Jet<br />
Sparkle Roll Jet<br />
20 | ASIAN SKY QUARTERLY — THIRD QUARTER 2018
COUNTRY PROFILE: GREATER CHINA<br />
Gulfstream, Bombardier and Dassault have continued to be the market<br />
leaders in Greater China since at least 2012. The most popular models<br />
are Gulfstream’s G550, G450, Dassault’s Falcon 7X, Bombardier’s G6000<br />
and the Gulfstream G650, respectively; all of which reflect the market’s<br />
preference for long-range and large-cabin business jets, offering the<br />
space and range<br />
Manufacturers have taken note with the introduction of the Gulfstream<br />
G500, G600 Global 7500 and the Falcon 6X.<br />
In terms of operators, nine out of the 10 top operators in the Asia-Pacific<br />
region are based in Greater China. The past few years have seen the<br />
development of several new operators, including HK Bellawings, Brilliant<br />
Jet and Sparkle Roll.<br />
In terms of operators, nine out of the 10 top operators in the Asia-Pacific<br />
region are based in Greater China. The past few years have seen the<br />
development of several new operators, including HK Bellawings, Brilliant<br />
Jet and Sparkle Roll.<br />
As the Chinese market begins to mature, the trend of buying preowned<br />
has increased. Buyers are maturing along with the market,<br />
understanding that buying an aircraft out of warranty isn’t necessarily<br />
a bad characteristic because the region now has more infrastructure<br />
to support this. Thus, with OEMs producing new aircraft every couple<br />
of years, which ultimately lands owners on a waiting list until deliveries<br />
begin, those interested in buying pre-owned can cut down on wait time<br />
and enjoy a smaller price tag.<br />
INFRASTRUCTURE<br />
To handle China’s growing market requires sufficient infrastructure,<br />
including airports, fixed-based operators (FBOs) and maintenance,<br />
repair and overhaul (MRO) facilities. The Chinese government has<br />
taken note introducing legislation aimed at improving the country’s<br />
connectivity, outlined in its 13th Five-Year Plan (2016-2020). The plan,<br />
which includes major objectives for economic and social development,<br />
Civil Helicopter Fleet by Mission and OEM<br />
362<br />
100+17+16+14+12+7+2+2+1<br />
63 59 50 45 25 8 7 4<br />
Multi-Mission<br />
Offshore<br />
Law<br />
Enforcement<br />
EMS<br />
SAR<br />
Charter<br />
Training<br />
Corporate<br />
Private<br />
Total<br />
Airbus 150 30 18 14 20 8 1 2 243<br />
Avicopter 30 9 39<br />
Bell 93 6 8 6 4 2 3 122<br />
Enstrom 19 4 23<br />
Kaman 2 2<br />
Leonardo 17 2 18 28 11 2 78<br />
MD 7 1 1 9<br />
Robinson 11 2 3 16<br />
Russian Helicopters 33 2 35<br />
Sikorsky 31 25 56<br />
Total 362 63 59 50 45 25 8 7 4 623<br />
Fleet Growth 2014 - 2016<br />
Number of Hangars<br />
Business Jets<br />
Civil Turbine Helicopters<br />
543<br />
+19%<br />
458<br />
427<br />
+7%<br />
457<br />
+4% 477<br />
+16%<br />
394<br />
2014 2015 2016<br />
16 16<br />
Business Jet Parking Civil Helicopter Parking<br />
Data Source: Asian Sky Group Infrastructure Report 2017<br />
Total number of hangars only includes FBO and MRO facilities in this report.<br />
THIRD QUARTER 2018 — ASIAN SKY QUARTERLY | 21
FOR DETAILED AIRCRAFT FLEET AND INFRASTRUCTURE PROFILES OF<br />
GREATER CHINA, DOWNLOAD OUR REPORT AT: WWW.ASIANSKYMEDIA.COM<br />
focuses on infrastructure with an emphasis on aviation development.<br />
Most of the new regulations have already been set in place, such as<br />
opening airspace below 3,000-meters, as well as simplifying flight<br />
application time. Still, a great deal of the development is concentrated<br />
on the building of airports.<br />
As of July 2017, the Beijing Capital, Hong Kong International, Shanghai<br />
Pudong and Guangzhou Baiyun airports had already reached<br />
commercial passenger traffic capacity, leaving little space for parking<br />
— and consideration — of business and general aviation aircraft.<br />
To serve increasing traffic in the Beijing, Tianjin and Hebei areas is<br />
the planned Beijing Daxing International Airport, expected to serve<br />
100 million passengers annually and provide considerable support<br />
to business and general aviation. Other airports under development<br />
are the Chengdu Tianfu International, Pearl River Delta and Qingdao<br />
Jiaodong International airports, along with several more catering to<br />
both commercial and general aviation.<br />
Catering solely to business aviation are a wide-range of FBOs and<br />
MROs. Four full-service FBOs serve Mainland China — Beijing CJet,<br />
Shanghai Hawker Pacific Business Aviation Center (SHPBAC),<br />
Shenzhen Joyee FBO and Yitong Business Aviation Service Company.<br />
Additionally, several ground handlers are located throughout China. In<br />
Hong Kong, the Hong Kong Business Aviation Center is the only FBO,<br />
while the Macau Business Aviation Center in Macau. Likewise, Taiwan<br />
is home to one FBO — Eva Sky Jet Center.<br />
Throughout Greater China, several MROs are present serving the<br />
growing fleets; notably in Beijing, Jinan, Shanghai, Tianjin, Xi’an, Zhuhai,<br />
Hong Kong and Macau. In 2017, the Tianjin Airport Economic Area and<br />
Bombardier Business Aircraft opened one of the newest centers in<br />
China, supporting the Global series, Challenger 604, 605 and 850 series.<br />
With an increasing number of business and general aviation aircraft<br />
to cater to, one of the main concerns of the industry continues to be<br />
infrastructure. More so than the number of FBOs, MROs and airports is<br />
the concern that business and general aviation are placed as a priority<br />
behind commercial aviation. As such, heavily-restricted landing and<br />
parking continues to be an issue at all major airports.<br />
GREATER BAY AREA<br />
The major cities making up the Greater Bay Area are Guangzhou,<br />
Shenzhen, Zhuhai, Foshan, Huizhou, Dongguan, Zhongshan, Jiangmen<br />
and Zhaoqing, along with Hong Kong and Macau.<br />
As part of the Greater Bay Area initiative, the Chinese government hopes<br />
to bring the cities along the Pearl River Delta region together to develop<br />
a powerhouse region comparable to California’s San Francisco Bay area,<br />
the Greater New York area or the Greater Tokyo area. The expectation<br />
is that the Greater Bay Area will act as a hub for innovation, while<br />
capitalizing on the region’s manufacturing strengths.<br />
An interesting element of the initiative is the role it will play connecting<br />
the region. Already in place is the Guangzhou-Shenzhen-Hong Kong<br />
Express Rail Link, while the Hong Kong-Zhuhai-Macau Bridge is set to<br />
open by the end of 2018. The connectivity of this region also presents an<br />
opportunity for the aviation industry, particularly general aviation.<br />
Currently, the operating environment varies greatly between Hong Kong,<br />
Macau and Mainland China. Airports within this area, including Hong<br />
Kong Int’l, the Guangzhou Baiyun and Shenzhen Bao’an, suffer from<br />
congestion and a lack of standardized regulations. Plans are in place<br />
for an additional runway at the Hong Kong airport, set for completion<br />
in 2023, and both Guangzhou and Shenzhen airports have plans for<br />
additional runways within the next five years.<br />
22 | ASIAN SKY QUARTERLY — THIRD QUARTER 2018
COUNTRY PROFILE: GREATER CHINA<br />
Still, this leaves the business aviation industry competing with<br />
commercial aviation. With a rise in low-budget carriers, coupled with<br />
increasing passenger traffic, business aviation requires an immediate<br />
solution.<br />
The most practical alternative to deal with congestion and limited<br />
parking space is to utilize airports in Macau and Zhuhai. The use of<br />
general aviation is an option many in the industry are considering, with<br />
helicopter transfers from Hong Kong to either the Macau or Zhuhai<br />
airports presenting a possible solution.<br />
Any plan for the use of helicopters throughout this region will still require<br />
the support of Guangdong, Hong Kong and Macau governments and<br />
will, consequently, mean the amendment of current regulations. For<br />
now, it’s the industry’s duty to showcase the potential for aviation within<br />
the Greater Bay Area.<br />
2017. To sustain this growth, the business aviation industry will continue<br />
to face challenges with infrastructure.<br />
The biggest challenge is the preference of commercial aviation over<br />
business and general aviation at airports. Advocacy groups are now<br />
working to appeal to airport authorities for additional business aviationdedicated<br />
slots, with only slight improvements throughout the years.<br />
In years to come, advocacy will continue with special consideration paid<br />
towards the highest populated province in Mainland China — Guangdong,<br />
along with the region making up the Greater Bay Area.<br />
In years to come, advocacy will continue with special consideration<br />
paid towards the highest populated province in Mainland China —<br />
Guangdong, along with the region making up the Greater Bay Area.<br />
FUTURE<br />
An estimated 558 business jets will be based in Greater China by yearend<br />
2018, according to Asian Sky Group forecasts; a 9% growth from yearend<br />
FBO’s Facilities and Services<br />
FBO Name<br />
Airport<br />
Aircraft<br />
Hangarage<br />
On-Site<br />
CIQ 2<br />
VIP<br />
Lounges<br />
Aircraft<br />
Handling<br />
Aircraft<br />
Refueling 3<br />
Baiyun Airport BAC 1 Guangzhou Baiyun International Airport ● ● ●<br />
Beijing Capital Jet Beijing Capital International Airport ● ● ● ●<br />
Haikou Meilan International Airport ● ● ● ●<br />
Nanning Wuxu International Airport ● ● ● ●<br />
Sanya Phoenix International Airport ● ● ● ●<br />
Deer Jet<br />
Xi'an Xianyang International Airport ● ● ● ●<br />
Changsha Huanghua International Airport 1 ● ● ●<br />
Guilin Liangjiang International Airport 1 ● ● ● ●<br />
Hangzhou Xiaoshan International Airport 1 ● ● ● ●<br />
EVA SKY JET C<strong>EN</strong>TER Taipei Songshan Airport ● ● ● ●<br />
Hawker Pacific Shanghai Hongqiao International Airport ● ● ● ● ●<br />
HKBAC Hong Kong International Airport ● ● ● ● ●<br />
Huan Yu VIP Terminal Taiwan Taoyuan International Airport ● ● ●<br />
MBAC Macau International Airport ● ● ● ● ●<br />
Shenzhen Joyee Shenzhen Bao'an International Airport ● ● ●<br />
Tianjin Airport BAC Tianjin Binhai International Airport ● ● ● ●<br />
Data Source: Asian Sky Group Infrastructure Report 2017<br />
1 Under Construction; 2 CIQ: Customs, Immigration and Quarantine; 3 Aircraft Refueling: Fuel Arrangement Service<br />
THIRD QUARTER 2018 — ASIAN SKY QUARTERLY | 23
● ● ● ● ● ●<br />
● ● ● ● ● ●<br />
● ● ● ● ● ●<br />
● ● ● ● ● ● ●<br />
● ● ● ●<br />
● ● ● ●<br />
● ● ● ●<br />
● ● ● ● ● ● ●<br />
●<br />
● ●<br />
● ● ●<br />
● ●<br />
●<br />
● ● ● ●<br />
● ● ● ●<br />
● ● ● ● ● ● ● ●<br />
● ● ● ● ● ● ● ● ● ● ● ●<br />
● ● ●<br />
● ● ●<br />
● ● ● ● ● ● ● ● ●<br />
● ●<br />
COUNTRY PROFILE: GREATER CHINA<br />
MRO Capabilities by Model<br />
● Line Maintenance (Fixed-wing)/Field Maintenance (Helicopter)<br />
● Base Maintenance (Fixed-wing)/Overhaul (Helicopter)<br />
● Both<br />
AIRBUS<br />
AMECO (BJ)<br />
AMECO (CD)<br />
Beijing Airlines<br />
Boeing SC (SH)<br />
China Southern<br />
Deer Jet (BJ)<br />
GAMECO<br />
HAECO (XM)<br />
HNA Aviation<br />
SMECO<br />
STAECO (BJ)<br />
STAECO (JN)<br />
STARCO (SH)<br />
ACJ318<br />
ACJ319<br />
ACJ320<br />
ACJ321<br />
BOEING<br />
BBJ<br />
BBJ2<br />
BBJ3<br />
BOMBARDIER<br />
Beijing Airlines<br />
Bombardier (TJ)<br />
China Eastern<br />
Deer Jet (BJ)<br />
Deer Jet (SH)<br />
ExecuJet Haite<br />
Hawker Pacific<br />
STAECO (BJ)<br />
STAECO (JN)<br />
Learjet 35/36<br />
Learjet 40/45/45XR<br />
Learjet 60/60XR<br />
CRJ200<br />
Challenger 300<br />
Challenger 601<br />
Challenger 604<br />
Challenger 605<br />
Challenger 850<br />
Global Express<br />
Global Express XRS<br />
Global 5000<br />
Global 6000<br />
DASSAULT<br />
Falcon 7X<br />
Falcon 8X<br />
Falcon 10<br />
Falcon 20<br />
Falcon 50/EX<br />
Falcon 200<br />
Falcon 900<br />
Falcon 2000<br />
24 | ASIAN SKY QUARTERLY — THIRD QUARTER 2018
● ● ●<br />
● ● ● ●<br />
● ● ● ● ●<br />
● ●<br />
● ●<br />
● ● ● ● ● ●<br />
● ● ● ● ●<br />
● ●<br />
● ●<br />
● ● ● ● ● ●<br />
● ● ● ● ●<br />
● ● ●<br />
● ●<br />
● ● ●<br />
● ● ● ● ●<br />
● ● ● ● ●<br />
●<br />
● ● ● ● ● ●<br />
● ● ● ● ●<br />
● ● ● ● ● ●<br />
● ● ● ● ● ●<br />
● ● ● ● ● ●<br />
●<br />
● ●<br />
● ●<br />
COUNTRY PROFILE: GREATER CHINA<br />
EMBRAER<br />
Beijing Airlines<br />
China Eastern<br />
Deer Jet (BJ)<br />
Deer Jet (SH)<br />
ExecuJet Haite<br />
Gulfstream (BJ)<br />
Hawker Pacific<br />
Metrojet (ZH)<br />
STAECO (BJ)<br />
STAECO (JN)<br />
TEXTRON<br />
BJ Dingshi GA<br />
China Eastern<br />
China Flight GA<br />
Deer Jet (BJ)<br />
Deer Jet (SH)<br />
Hawker Pacific<br />
Phenom 100<br />
Citation I<br />
Phenom 300<br />
Citation II/Bravo<br />
Legacy 500<br />
Citation III/VI/VII<br />
Legacy 600<br />
Citation V<br />
Legacy 650<br />
Citation XLS/+<br />
Lineage 1000<br />
Citation X/+<br />
GULFSTREAM<br />
Citation CJ1/+<br />
G100<br />
Citation CJ2/+<br />
G150<br />
Citation Sovereign/+<br />
G200<br />
Citation Longitude<br />
G280<br />
Citation Mustang<br />
GIV/GIV-SP/G300/G400<br />
Hawker 400A/B<br />
GV<br />
Hawker 400XP<br />
G350/G450<br />
Hawker 750<br />
G500/G550<br />
Hawker 800 A/B/850XP<br />
G650/G650ER<br />
Hawker 900XP<br />
Hawker 4000<br />
CITY ABBREVIATION<br />
TEXTRON<br />
Dingshi GA (BJ)<br />
CAFUC<br />
Cessna-Avic<br />
China Eastern<br />
China Flight GA<br />
H&P GA<br />
Hairuo GA (SD)<br />
Jiutian<br />
Sky-Blue<br />
BJ<br />
Beijing<br />
King Air 90<br />
CD<br />
Chengdu<br />
King Air 200/250<br />
CS<br />
GZ<br />
JN<br />
Changsha<br />
Guangzhou<br />
Jinan<br />
King Air 300/350<br />
Cessna 172<br />
NB<br />
SC<br />
SD<br />
Ningbo<br />
Sichuan<br />
Shanghai<br />
Cessna 182<br />
Cessna 205<br />
SH<br />
TJ<br />
XM<br />
ZH<br />
Shandong<br />
Tianjin<br />
Xiamen<br />
Zhahai<br />
Cessna 206<br />
Cessna 207<br />
Cessna 400<br />
Caravan<br />
Grand Caravan<br />
Baron<br />
Bonanza<br />
THIRD QUARTER 2018 — ASIAN SKY QUARTERLY | 25
● ●<br />
● ●<br />
● ●<br />
●<br />
● ●<br />
● ●<br />
● ●<br />
● ● ● ● ●<br />
●<br />
●<br />
● ●<br />
● ●<br />
● ● ● ●<br />
●<br />
● ●<br />
● ●<br />
●<br />
● ●<br />
● ●<br />
● ●<br />
● ●<br />
● ●<br />
● ● ●<br />
●<br />
● ● ●<br />
● ● ●<br />
● ● ●<br />
● ● ●<br />
●<br />
● ● ●<br />
● ●<br />
COUNTRY PROFILE: GREATER CHINA<br />
AIRBUS<br />
AVIC Changhe<br />
BJ Capital<br />
COHC GAMEC<br />
Eastern GA<br />
Flying Dragon<br />
GDAT (NB)<br />
Hafei<br />
Xilin Fengteng GA<br />
BELL<br />
Aerochine Aviation<br />
Avion Pacific<br />
Champion<br />
Chongqing GA<br />
COHC GAMEC<br />
Dachuan GA<br />
GDAT (NB)<br />
Jielian (CS)<br />
JX Changhe<br />
Kingwing GA<br />
Suilian GA<br />
H120<br />
204<br />
H125<br />
205<br />
H130<br />
206<br />
H135<br />
212<br />
H145<br />
214<br />
H155<br />
230<br />
H215<br />
407<br />
H225<br />
412<br />
AS355<br />
427<br />
AS365<br />
429<br />
BK117<br />
430<br />
AVIC<br />
LEONARDO<br />
AC311<br />
AW109<br />
AC313<br />
AW119<br />
H410<br />
AW139<br />
Z9/Z9A<br />
AW169<br />
MD<br />
MD 500/520<br />
MD 600<br />
MD 900<br />
ROBINSON<br />
BJ Capital<br />
Champion<br />
China Flight GA<br />
Dachuan GA (SC)<br />
GDAT (NB)<br />
H&P GA<br />
Heliflite<br />
Jielian (CS)<br />
Kingwing GA<br />
Ruoer GA<br />
Suilian (GZ)<br />
Xilin Fengteng GA<br />
Yanxiang (SH)<br />
CITY ABBREVIATION<br />
R22<br />
R44<br />
R66<br />
SIKORSKY<br />
S76<br />
S92<br />
BJ<br />
CD<br />
CS<br />
GZ<br />
JN<br />
NB<br />
SC<br />
Beijing<br />
Chengdu<br />
Changsha<br />
Guangzhou<br />
Jinan<br />
Ningbo<br />
Sichuan<br />
S300<br />
269C<br />
SD<br />
SH<br />
TJ<br />
Shanghai<br />
Shandong<br />
Tianjin<br />
C++<br />
XM<br />
Xiamen<br />
ZH<br />
Zhahai<br />
26 | ASIAN SKY QUARTERLY — THIRD QUARTER 2018
● ● ● ● ● ● ● ●<br />
● ●<br />
● ● ● ● ● ● ● ● ●<br />
● ● ● ● ● ●<br />
● ● ● ●<br />
● ● ● ● ●<br />
● ● ● ● ● ● ●<br />
●<br />
● ● ● ● ●<br />
● ●<br />
● ● ● ● ● ● ● ● ● ● ●<br />
●<br />
●<br />
● ● ●<br />
● ● ● ● ● ● ● ●<br />
COUNTRY PROFILE: GREATER CHINA<br />
HONG KONG | TAIWAN | MACAU<br />
MRO CAPABILITIES BY MODEL<br />
● Line Maintenance (Fixed-wing)/Field Maintenance (Helicopter)<br />
● Base Maintenance (Fixed-wing)/Overhaul (Helicopter)<br />
● Both<br />
AIRBUS<br />
Air Asia (TW)<br />
CASL (HK)<br />
EVA SKY JET (TW)<br />
HAECO (HK)<br />
Jet Aviation (HK)<br />
Mandarin Airlines<br />
Metrojet (HK)<br />
EMBRAER<br />
EVA SKY JET (TW)<br />
Jet Aviation (HK)<br />
Metrojet (HK)<br />
BELL<br />
Air Asia (TW)<br />
Executive Aviation (TW)<br />
HK Aviation Club<br />
Skytech (MC)<br />
ACJ318<br />
Phenom 100<br />
204<br />
ACJ319<br />
Phenom 300<br />
205<br />
ACJ320<br />
Legacy 500<br />
206<br />
ACJ321<br />
Legacy 600<br />
212<br />
BOEING<br />
Legacy 650<br />
214<br />
BBJ<br />
ERJ135/ER/LR<br />
230<br />
BBJ2<br />
Lineage 1000<br />
407<br />
BBJ3<br />
GULFSTREAM<br />
412<br />
BOMBARDIER<br />
G100<br />
427<br />
Learjet 35/36<br />
G150<br />
429<br />
Learjet 40/45/45XR<br />
G200<br />
430<br />
Learjet 60/60XR<br />
G280<br />
LEONARDO<br />
Learjet 75<br />
GIV/GIV-SP/G300/G400<br />
AW109<br />
CRJ200<br />
GV<br />
AW119<br />
Challenger 300<br />
G350/G450<br />
AW139<br />
Challenger 601<br />
G500/G550<br />
AW169<br />
Challenger 604<br />
G650/G650ER<br />
MD<br />
Challenger 605<br />
MD 500/520<br />
Challenger 850<br />
MD 600<br />
Global Express<br />
Global Express XRS<br />
Global 5000<br />
TEXTRON<br />
Air Asia (TW)<br />
MD 900<br />
ROBINSON<br />
R22<br />
Global 6000<br />
King Air 90<br />
R44<br />
DASSAULT<br />
Falcon 7X<br />
Falcon 8X<br />
Falcon 10<br />
Falcon 20<br />
Falcon 50/EX<br />
Falcon 200<br />
Falcon 900<br />
Falcon 2000<br />
King Air 200/250<br />
King Air 300/350<br />
Cessna 172<br />
Cessna 182<br />
Cessna 205<br />
Cessna 206<br />
Cessna 207<br />
Cessna 400<br />
Caravan<br />
Grand Caravan<br />
Baron<br />
Bonanza<br />
R66<br />
THIRD QUARTER 2018 — ASIAN SKY QUARTERLY | 27
PRE-OWNED MARKET SPOTLIGHT<br />
CORPORATE AIRLINERS<br />
PAST, PRES<strong>EN</strong>T AND FUTURE<br />
Appealing to VVIP buyers looking for more space and a customized interior,<br />
Corporate Airliners created a market for manufacturers by transforming popular<br />
commercial airliners into corporate jets. In 1996, Boeing Commercial Airplanes<br />
partnered with GE Aviation to bring one of the very first Corporate Airliners to the<br />
market: the Boeing Business Jet based of the then 737 NG Series of commercial<br />
airliners. French manufacturer Airbus followed with its Airbus Corporate Jet<br />
series and since then other manufacturers have attempted the same with varying<br />
degrees of success — Bombardier with its Challenger 850 from the CRJ, Embraer<br />
with the Lineage 1000 from the E190, and the Russian manufacturer Sukhoi with<br />
the SBJ<br />
28 | ASIAN SKY QUARTERLY — THIRD QUARTER 2018
PRE-OWNED SPOTLIGHT<br />
INTRODUCTION<br />
The BBJ1, a combination of a 737-700 airframe and 737-800 wing,<br />
was Boeing Business Jets’ first aircraft serving the Corporate<br />
Airliner segment. With configurations typically ranging from 19 to 50<br />
passengers – much less than the typical 149 passenger capacity of<br />
the 737-700 NG airliner – a BBJ’s cabin is typically divided into four<br />
sections: a boardroom, lounge, VIP bedroom and a business office,<br />
along with two restrooms. Since the first BBJ, Boeing Business Jets<br />
has introduced the BBJ2, based on the 737-800, and the BBJ3, based<br />
on the 737-900ER. With additional fuel tanks and CFM56-7 engines,<br />
the BBJ flies as far as 6,200nm and the BBJ2 flies 5,600nm. The<br />
major difference between the two is the cabin size where the BBJ2<br />
has 25% more space than the BBJ.<br />
As Boeing’s direct competitor, Airbus’ ACJ Family offers a similar<br />
range of Corporate Airliners based on the CEO variant, short for<br />
current engine options, originally including the ACJ318 — based off<br />
the A318; the ACJ319 — based off the A319; and then ACJ320 &<br />
ACJ321. All ACJ models except the ACJ318 which is no longer in<br />
production, typically accommodate 19 to 50 passengers so are sized<br />
much like their BBJ competitor, but the ACJs have a slightly wider<br />
and taller cabin. The ACJ319 has a range of up to 6,000nm, while<br />
the ACJ318 is capable of just 4,200nm with two tanks. Both can<br />
be equipped with engines from either CFM, IAE (not the ACJ318) or<br />
P&WC.<br />
Based on the 50-seat regional airliner CRJ200LR, Bombardier<br />
introduced the Challenger 800 back in 1997, with an updated version<br />
later brought to the market in 2006 — the Challenger 850. Capable<br />
of accommodating up to 19 passengers or 27 in a Corporate Shuttle<br />
version, the Challenger 850’s range is significantly lower than the<br />
MODEL COMPARISON<br />
MODEL<br />
ACJ318<br />
ACJ319<br />
BBJ<br />
BBJ2<br />
LINEAGE 1000<br />
CHALL<strong>EN</strong>GER 850<br />
Manufacturer<br />
Airbus<br />
Airbus<br />
Boeing<br />
Boeing<br />
Embraer<br />
Bombardier<br />
Engine Type<br />
CFM56-5B<br />
CFM56-5B<br />
CFM56-7<br />
CFM56-7<br />
GE CF34-10E<br />
GE CF34-3B1<br />
Engine Thrust (Lbs/Shp)<br />
26,500<br />
26,500<br />
27,300<br />
27,300<br />
18,500<br />
8,729<br />
Typical Crew / Passenger Seating<br />
3/18<br />
3/19<br />
3/19<br />
3/19<br />
3/13<br />
3/15<br />
“Maximum Range - Up To<br />
(NBAA IFR Res, Seat Full)<br />
Maximum Take-off Weight (Lbs.)<br />
3,800<br />
145,504<br />
6,100<br />
168,650<br />
6,141<br />
171,000<br />
5,644<br />
174,200<br />
4,198<br />
120,152<br />
2,456<br />
53,000<br />
* Source: Conklin & de Decker.<br />
AIRCRAFT DIM<strong>EN</strong>SION<br />
ACJ318<br />
ACJ319<br />
BBJ<br />
BBJ2<br />
LINEAGE 1000<br />
CHALL<strong>EN</strong>GER 850<br />
Length (ft.)<br />
103.7<br />
111<br />
110.3<br />
129.4<br />
118.9<br />
87.8<br />
Height (ft.)<br />
41.2<br />
38.5<br />
41.2<br />
41.2<br />
34.7<br />
20.4<br />
Wing Span (ft.)<br />
120.8<br />
111.8<br />
117.4<br />
117.4<br />
94.2<br />
69.5<br />
* Source: Conklin & de Decker<br />
CABIN DIM<strong>EN</strong>SION<br />
ACJ318<br />
ACJ319<br />
BBJ<br />
BBJ2<br />
LINEAGE 1000<br />
CHALL<strong>EN</strong>GER 850<br />
Cabin Width (ft.)<br />
12.08<br />
12.08<br />
11.50<br />
11.50<br />
8.75<br />
8.17<br />
Cabin Height (ft.)<br />
7.33<br />
7.33<br />
7.00<br />
7.00<br />
6.58<br />
6.08<br />
Cabin Length (ft.)<br />
70.92<br />
78.75<br />
79.20<br />
98.30<br />
84.32<br />
48.42<br />
Cabin Volume (cu.ft.)<br />
5,300<br />
5,843<br />
5,396<br />
6,525<br />
3,914<br />
1,964<br />
* Source: Conklin & de Decker<br />
OTHER FEATURES<br />
ACJ318<br />
ACJ319<br />
BBJ<br />
BBJ2<br />
LINEAGE 1000<br />
CHALL<strong>EN</strong>GER 850<br />
Max Certified Cabin Altitude (ft.)<br />
N/A<br />
8,000<br />
6,500<br />
6,500<br />
7,000<br />
8,000<br />
Avionic System / Suppliers<br />
Various<br />
Various<br />
Rockwell Collins<br />
Rockwell Collins<br />
Honeywell<br />
Rockwell Collins<br />
Enhanced Vision / Heads Up Guidance<br />
Optional<br />
Optional<br />
HGS-4000 HUD<br />
HGS-4000 HUD<br />
Optional<br />
Optional<br />
* Source: OEM, Conklin & de decker<br />
OPERATING COST<br />
ACJ318<br />
ACJ319<br />
BBJ<br />
BBJ2<br />
LINEAGE 1000<br />
CHALL<strong>EN</strong>GER 850<br />
Per Hour (USD)<br />
$8,005<br />
$8,317<br />
$8,478<br />
$9,303<br />
$7,605<br />
$5,058<br />
* Source: Conklin & de Decker, total cost includes including variable cost & fixed cost.<br />
THIRD QUARTER 2018 — ASIAN SKY QUARTERLY | 29
PRE-OWNED SPOTLIGHT<br />
AGE AND MODEL DISTRIBUTION - CURR<strong>EN</strong>T IN OPERATION<br />
ACJ318<br />
ACJ319<br />
BBJ<br />
BBJ2<br />
Challenger 850 * Lineage 1000<br />
45<br />
No. of Aircraft in Operation<br />
40<br />
35<br />
30<br />
25<br />
20<br />
15<br />
10<br />
5<br />
0<br />
1997<br />
1998<br />
1999<br />
2000<br />
2001<br />
2002<br />
2003<br />
2004<br />
2005<br />
2006<br />
2007<br />
2008<br />
2009<br />
2010<br />
2011<br />
2012<br />
2013<br />
2014<br />
2015<br />
2016<br />
2017<br />
2018<br />
Data Source: JETNET<br />
*Including re-configured CL850(CRJ)<br />
MARKET CONDITION<br />
ACJ319<br />
BBJ<br />
BBJ2<br />
ACJ318<br />
CHALL<strong>EN</strong>GER 850<br />
LINEAGE 1000<br />
In Production<br />
Current in Operation*<br />
Current on Market for Sale<br />
% of the fleet<br />
Sold past 12 Months<br />
1998 - Present<br />
70<br />
9<br />
13%<br />
1<br />
1998 - Present<br />
135<br />
15<br />
11%<br />
11<br />
2001 - Present<br />
23<br />
4<br />
17%<br />
2<br />
2005 - 2015<br />
20<br />
5<br />
25%<br />
1<br />
2006 - 2012<br />
71<br />
10<br />
14%<br />
6<br />
2009 - 2017<br />
29<br />
6<br />
21%<br />
1<br />
*Source: Jetnet & Conklin & de Decker<br />
much bigger BBJs or ACJs — falling into the super-midsize category,<br />
reaching 3,100 nm. The Challenger 850 was introduced as a costeffective<br />
“Global Express” offering almost the equivalent cabin size,<br />
at the sacrifice of range.<br />
Brazilian aircraft manufacturer Embraer launched the Lineage 1000<br />
in 2006, based off its very successful E190 regional jet airliner.<br />
Categorized as an ultra-large business jet due to its 4,085 cu-ft cabin,<br />
with a range of 4,200nm, the Lineage 1000 accommodates from<br />
13 to 19 passengers. While its cross-section is larger than several<br />
conventional business jets, like the Gulfstream G550, 7X or Global<br />
Express, it’s still smaller than the BBJ or ACJ. Embraer relaunched<br />
the Lineage 1000 as the 1000E in 2013, with enhanced avionics and<br />
performance, as well as a greater range of 4,60nm.<br />
PRE-OWNED MARKET ANALYSIS<br />
The pre-owned market for Corporate Airliners really needs to be<br />
broken down into two categories, as an ACJ can’t be thought of in<br />
the same category as a Challenger 850. So, on one hand you have<br />
the very successful BBJ and ACJ319 – ultra-long-range business<br />
jets with fully customized interiors, both market successes, along<br />
with the new MAX and NEO versions coming to the market now. On<br />
the other hand you have the ACJ318, L1000 and CL850 – mid-range<br />
business jets with limited cabin customization available, poor market<br />
acceptability and are no longer in production.<br />
Considering all of these Corporate Airliner models, the BBJ is the<br />
most popular model, with 135 jets in operation. Not too surprisingly,<br />
the US is its largest market, where it is also utilized by numerous<br />
government entities. Greater China is also a strong market for the<br />
BBJ, followed by the UAE and Saudi Arabia, where this aircraft is most<br />
used by private owners. The ACJ319, the direct competitor of the BBJ,<br />
has a younger but much smaller fleet of 70 worldwide. Greater China<br />
and Germany are the largest markets for this aircraft. The Challenger<br />
850 has a fleet of 71 aircraft, used primarily in Greater China by a<br />
number of governmental entities and state-owned enterprises, along<br />
with the US and Russia. The L1000, with a fleet of 29 aircraft, also<br />
OPERATING REGION - BREAKDOWN BY MODEL<br />
REGION<br />
ACJ319<br />
BBJ<br />
BBJ2<br />
ACJ318<br />
CHALL<strong>EN</strong>GER 850<br />
LINEAGE 1000<br />
Europe<br />
Asia<br />
Northern America<br />
Middle East<br />
Sub-Saharan Africa<br />
Latin Amer. & Carib<br />
Oceania<br />
Northern Africa<br />
33<br />
11<br />
1<br />
14<br />
4<br />
2<br />
1<br />
22<br />
25<br />
45<br />
20<br />
6<br />
6<br />
7<br />
1<br />
3<br />
5<br />
2<br />
11<br />
1<br />
5<br />
8<br />
7<br />
30<br />
16<br />
16<br />
3<br />
2<br />
1<br />
1<br />
9<br />
8<br />
4<br />
4<br />
1<br />
Grand Total *<br />
66<br />
132<br />
22<br />
20<br />
68<br />
27<br />
Data Source: JETNET<br />
*Aircraft with unknown base info are omitted.<br />
30 | ASIAN SKY QUARTERLY — THIRD QUARTER 2018
PRE-OWNED SPOTLIGHT<br />
TOTAL INV<strong>EN</strong>TORY MARKET VALUE SINCE SEPTEMBER 2016 - COMPARE TO G550<br />
ACJ318<br />
ACJ319<br />
BBJ<br />
BBJ2<br />
Challenger 850 Lineage 1000<br />
G550<br />
2000<br />
1800<br />
Inventory Market Value<br />
1600<br />
1400<br />
1200<br />
1000<br />
800<br />
600<br />
400<br />
200<br />
0<br />
2016-09<br />
2016-10<br />
2016-11<br />
2016-12<br />
2017-01<br />
2017-02<br />
2017-03<br />
2017-04<br />
2017-05<br />
2017-06<br />
2017-07<br />
2017-08<br />
2017-09<br />
2017-10<br />
2017-11<br />
2017-12<br />
2018-01<br />
2018-02<br />
2018-03<br />
2018-04<br />
2018-05<br />
2018-06<br />
2018-07<br />
2018-08<br />
2018-09<br />
has a number of governmental users, plus<br />
Asian and Middle East owners.<br />
Inventory market values for Corporate<br />
Airliners have been steadily increasing since<br />
September 2016, with the ACJ319 and BBJ2<br />
increasing the most. Comparatively, the<br />
G550’s inventory value has been decreasing<br />
since early 2016.<br />
Currently the market for pre-owned<br />
Corporate Airliners is witnessing little<br />
activity. Typically, the average percentage of<br />
business jets for sale — at any given time —<br />
is around 6 to 9%. The BBJ sits just above<br />
that with 11% of its fleet for sale, while the<br />
ACJ319 has 13% for sale and the Challenger<br />
850 has 14% of its fleet for sale. The BBJ2,<br />
Lineage 1000 and ACJ318 have 17%, 21%<br />
and 25% of their fleets for sale, respectively.<br />
In comparison, the G550 has a worldwide<br />
fleet of 556 aircraft with just 5% of its fleet<br />
for sale at the moment.<br />
The average days on market (DOM) for the<br />
selected Corporate Airliners reached just<br />
over 600 days, as of September 2018. The<br />
ACJ318 has the highest DOM at more than<br />
1,000 days, while the Challenger 850 and<br />
ACJ319 have the lowest DOM at just over<br />
AVERAGE ASKING PRICE TR<strong>EN</strong>D SINCE SEPTEMBER 2016<br />
AVERAGE DAYS ON MARKET AVERAGE ASKING PRICE (M USD)<br />
ACJ318 ACJ319 BBJ BBJ2 Challenger 850 Lineage 1000<br />
75<br />
65<br />
55<br />
45<br />
35<br />
25<br />
15<br />
5<br />
2016-09<br />
2016-10<br />
2016-11<br />
2016-12<br />
2017-01<br />
2017-02<br />
2017-03<br />
2017-04<br />
2017-05<br />
2017-06<br />
2017-07<br />
2017-08<br />
2017-09<br />
2017-10<br />
2017-11<br />
2017-12<br />
2018-01<br />
2018-02<br />
2018-03<br />
2018-04<br />
2018-05<br />
2018-06<br />
2018-07<br />
2018-08<br />
2018-09<br />
AVERAGE DAYS ON MARKET TR<strong>EN</strong>D<br />
CORPORATE AIRLINERS VS. G550<br />
G550 Corporate Airliners’ Average<br />
ACJ318 ACJ319 BBJ BBJ2 Challenger 850 Lineage 1000<br />
1400<br />
1200<br />
1000<br />
800<br />
600<br />
400<br />
200<br />
0<br />
2016-09<br />
2016-10<br />
2016-11<br />
2016-12<br />
2017-01<br />
2017-02<br />
2017-03<br />
2017-04<br />
2017-05<br />
2017-06<br />
2017-07<br />
2017-08<br />
2017-09<br />
2017-10<br />
2017-11<br />
2017-12<br />
2018-01<br />
2018-02<br />
2018-03<br />
2018-04<br />
2018-05<br />
2018-06<br />
2018-07<br />
2018-08<br />
2018-09<br />
200 days and 315 days, respectively. For comparison again, the G550<br />
had an average DOM of 165 days.<br />
In terms of market activity, as mentioned Corporate Airliners are<br />
currently experiencing few transactions, particularly when compared<br />
to conventional business jets. BBJs are the most active, with about<br />
one sale every few months. Therefore, price-wise — average asking<br />
prices for pre-owned Corporate Airliners are less volatile than the<br />
traditional business jet market. For popular models, such as the<br />
BBJ1, pricing has remained stable, varying just between US$34M<br />
and US$41M. The highest priced model of the Corporate Airliners<br />
is the BBJ2, with an average asking price of around US$57M.<br />
The Challenger 850, which has ceased production, is one of the<br />
lowest-priced Corporate Airliners, with an asking price of just<br />
over US$25M. However, each aircraft’s price tag can increase<br />
significantly depending on the aircraft’s interior, which most owners<br />
have customized using an industry renowned designer. The paradox<br />
here is that given only a small group of aircraft buyers can afford a<br />
Corporate Airliner in the first place, combined with their numerous<br />
requirements regarding cabin configuration and interior, most<br />
potential buyers would most likely go for a brand-new aircraft thus<br />
lowering demand for pre-owned aircraft.<br />
While pricing is understandably higher for a Corporate Airliner versus<br />
a conventional business jet, the depreciation rate for Corporate<br />
Airliners is slower. According to VREF, for a BBJ with a price tag of<br />
THIRD QUARTER 2018 — ASIAN SKY QUARTERLY | 31
PRE-OWNED SPOTLIGHT<br />
TIME LINE<br />
YEAR OEM MODEL EV<strong>EN</strong>T<br />
1996<br />
1997<br />
1998<br />
1999<br />
2001<br />
2004<br />
2005<br />
2006<br />
2007<br />
2009<br />
2010<br />
2012<br />
2013<br />
2015<br />
2016<br />
Boeing<br />
Airbus<br />
Boeing<br />
Airbus<br />
Boeing<br />
Boeing<br />
Boeing<br />
Airbus<br />
Bombardier<br />
Airbus<br />
Embraer<br />
Boeing<br />
Airbus<br />
Embraer<br />
Bombardier<br />
Airbus<br />
Embraer<br />
Bombardier<br />
Airbus<br />
Boeing<br />
BBJ<br />
ACJ319<br />
BBJ<br />
ACJ319<br />
BBJ2<br />
BBJ2<br />
BBJ<br />
ACJ318<br />
Challenger 850<br />
ACJ318<br />
Lineage 1000<br />
BBJ<br />
ACJ318<br />
Lineage 1000<br />
Challenger 850<br />
ACJ318<br />
Lineage 1000E<br />
Challenger 850<br />
ACJ NEO<br />
BBJ MAX<br />
Boeing Business Jets was launched as a joint venture between Boeing and General Electric.<br />
Airbus joined the business jet market with the A319 Corporate Jet.<br />
First BBJ entered service.<br />
First ACJ319 entered service.<br />
In October, the BBJ2 was announced which has 25 percent more cabin space and twice the cargo<br />
space of the original BBJ.<br />
First BBJ2 entered service.<br />
In May, the BBJ became the first non-commercial aircraft to cross the North Atlantic using Future<br />
Air Navigation System (FANS) technology.<br />
Airbus introduced the ACJ318.<br />
Bombardier introduced the Challenger 850 and announced its first order.<br />
First Airbus ACJ318 entered service.<br />
Embraer launched the Lineage 1000 in May.<br />
In January, Boeing and Rockwell Collins announced the development of an Enhanced Vision<br />
System (EVS) for the BBJ.<br />
Airbus A318 approved for Heads Up Display.<br />
First Lineage 1000 entered into service.<br />
The first Challenger 850 was delivered to BAA Jet Management in March.<br />
Airbus introduced the ACJ318 Enhanced, with more cabin configurations and airframe<br />
enhancements.<br />
Embraer renamed the Lineage 1000 the Lineage 1000E.<br />
Challenger 850 production ceased.<br />
Airbus launched the ACJneo with its first order.<br />
BBJ MAX7 was unveiled in October, with a 7,000 nautical mile range, 10% lower operating costs<br />
and a longer cabin compared to the original BBJ.<br />
% OF AIRCRAFT FOR SALE SINCE SEPTEMBER 2016<br />
30%<br />
28%<br />
26%<br />
24%<br />
22%<br />
20%<br />
18%<br />
16%<br />
14%<br />
12%<br />
10%<br />
8%<br />
6%<br />
4%<br />
NUMBER OF AIRCRAFT FOR SALE SINCE SEPTEMBER 2016<br />
No. of Aircraft for Sale<br />
20<br />
18<br />
16<br />
14<br />
12<br />
10<br />
8<br />
6<br />
4<br />
2<br />
0<br />
ACJ318 ACJ319 BBJ BBJ2<br />
US$46.5M delivered in 2008, today’s value would be US$34M; a 2.5-<br />
3% annual depreciation rate. This is much less than the average 6-9%<br />
annual rate for a conventional business jet.<br />
PROS & CONS<br />
ACJ318 ACJ319 BBJ BBJ2<br />
G550 Supply Level: 6-8%<br />
Challenger<br />
850<br />
Challenger<br />
850<br />
Lineage<br />
1000/E<br />
Lineage<br />
1000/E<br />
Because they are based off of commercial airliners with high annual<br />
utilizations, Corporate Airliners inherently have a robust airframe<br />
and system design allowing them to serve for longer periods, with<br />
fewer factory visits than conventional business jets. Also, Corporate<br />
Airliners are more spacious; a BBJ’s cabin volume is almost three<br />
times that of a G550 and consequently the interior can provide more<br />
flexibility for the buyer. These features along with a long list of others<br />
have successfully drawn the attention of top-tier business jet buyers<br />
and created a solid market demand for Corporate Airliners.<br />
While the Corporate Airliner market is undoubtedly popular for<br />
government entities and corporate users, the efficiency of these<br />
aircraft and their suitability for the demanding private user is often<br />
debated. A good example is with the avionics. Most business jets,<br />
including the Falcon 7X, Global 5500 and G550, have long offered<br />
Enhanced Vision System (EVS) with a Head-Up Display (HUD),<br />
improving pilot awareness in challenging conditions. Yet, these have<br />
only more recently found their way onto Corporate Airliners and even<br />
then merely as options with several Corporate Airliners only offering<br />
EVS as an upgrade while the baseline avionics typically remain from<br />
the last generation. Corporate Airliners also have a relatively slower<br />
cruising speed (around Mach 0.8) and a lower cruising altitude,<br />
ranging from 35,000ft to 39,000ft versus conventional business<br />
jets usually flying well above Mach 0.8 at 39,000ft. Thus, Corporate<br />
Airliners take a longer time to travel and typically can’t avoid<br />
challenging weather conditions like a conventional business jet. The<br />
cabin altitude in a Corporate Airliner is relatively higher too while in<br />
cruise. A BBJ’s cabin altitude is 6,500ft, while a G550 is slightly lower<br />
at 6,000ft, making a significant difference over long-haul flights, as<br />
passengers would feel more comfortable at a lower cabin altitude.<br />
Another major selling point for business jets is the reduced cabin<br />
noise they offer. In today’s conventional business jets, with the help<br />
of advanced insulation liners and the latest in acoustic treatment<br />
technology, they have virtually eliminated cabin noise by reducing it<br />
32 | ASIAN SKY QUARTERLY — THIRD QUARTER 2018
INDUSTRY INSIDER<br />
to an unperceivable level. In some cases this technology isn’t fully<br />
reflected in Corporate Airliners, which continue to come from the<br />
factory with the conventional noise treatment of just a commercial<br />
aircraft.<br />
In terms of the interior, Corporate Airliners — straight from the<br />
factory — tend to have limited customization options and OEMs have<br />
often opted for film-coated materials versus real veneer to reduce<br />
cabin weight, maintain range and lower costs. This has left the<br />
finished interior unappealing to a lot of buyers. Alternatively, in the<br />
case of BBJs and ACJs, those purchasing these aircraft typically look<br />
to interior specialists and completion centers to outfit the aircraft<br />
according to their customized needs. This process can take up to 18<br />
months or longer and comes with a hefty price tag; an ACJ or BBJ<br />
customised interior costs between US$20M to US$30M to outfit.<br />
MODEL PERFORMANCE COMPARISON<br />
RANGE, CABIN VOLUME & OPERATING COST PER HOUR<br />
Cabin Volume (ft3)<br />
7500<br />
6500<br />
5500<br />
4500<br />
3500<br />
2500<br />
1500<br />
500<br />
BBJ2, $9,303<br />
ACJ319, $8,317<br />
ACJ318, $8,005<br />
BBJ, $8,478<br />
Lineage 1000, $7,598<br />
Challenger 850, $5,058<br />
G550, $6,733<br />
2,000<br />
2,500<br />
3,000<br />
3,500<br />
4,000<br />
4,500<br />
5,000<br />
5,500<br />
6,000<br />
MAX RANGE (N.M.)<br />
* Data Source: Asian Sky Group & Conklin & de Decker<br />
6,500<br />
Operating costs for Corporate Airliners tend to be much higher than<br />
that of a conventional business jet. The BBJ and ACJ319, comparable<br />
in both range and cabin size, cost approximately US$8,000 to operate<br />
hourly, and over US$3.5M annually, according to Conklin & de Decker.<br />
In comparison, the G550, which has a slightly longer range yet a<br />
smaller cabin, costs approximately US$6,700 to operate hourly and<br />
US$2.8 million annually.<br />
At the moment, the market demand for Corporate Airliners is much<br />
lower than supply impacting seller’s expectations. Consequently,<br />
it takes a significantly longer period of time to sell a Corporate<br />
Airliner than a conventional business jets. Still, as the ‘top-tier’ of<br />
the corporate jet market, Corporate Airliners offer a shallower<br />
depreciation curve, combined with more space and the potential for<br />
specialized interiors custom designed by completion centers. Still,<br />
buyers are always pushing for future models to provide for a more<br />
genuine business jet experience, complete with advanced technology<br />
throughout the cockpit and cabin and a more luxurious cabin design<br />
as standard.<br />
THE FUTURE<br />
There are potentially three “new” Corporate Airliner models entering<br />
the market. These are referred to as “new” because some have<br />
already been announced but are taking a while to bring to market<br />
which is never a good sign for the long-term viability of a program.<br />
The three programs are the Sukhoi Business Jet (SBJ) from Superjet<br />
International; the ARJ21 Business Jet from COMAC in China; and a<br />
potential ACJ220 from Airbus Corporate Jets.<br />
The first SBJ was sold in 2013 and today the type is in operation<br />
with RusJet, Rossiya Special Flight Squad, Comlux KZ (on behalf of<br />
Metallurgical Corporation Kazakhmys), Kazakhstan’s border patrol<br />
and the Royal Thai Air Force. Currently, the collective fleet stands<br />
at 11 units. The aircraft was recently upgraded to incorporate eight<br />
tanks instead of four and added blended winglets. This extended<br />
the range of the aircraft out to 3,900nm. The target markets for<br />
the SBJ are CIS countries, Middle East, Southeast Asia and Africa,<br />
where buyers are looking for something between an ultra-long-range<br />
business jet and a Corporate Airliner, such as the ACJ and BBJ.<br />
The ARJ21 Business Jet is still in development mainly due to<br />
corresponding delays to the commercial airliner program and its<br />
ongoing certification issues. To date, there are only five airliner<br />
TRANSACTION SUMMARY - BREAKDOWN BY MODEL<br />
NO. OF AIRCRAFT FOR SALE<br />
ARJ21s in service with Chengdu Airlines and three more involved<br />
in flight test duties. COMAC also holds firm orders for 127 more of<br />
the type, and options and letters of intent for a further 399. The first<br />
ARJ21 Business Jet is currently under production in Shanghai, with<br />
the prime vendor for the cabin installation being Fokker Techniek,<br />
supported by cabinetry from F/LIST in Austria and cabin liners from<br />
Jeff Bonner Research & Development Company Inc. (JBRND) in the<br />
US.<br />
ACJ318<br />
2016/09<br />
2016/10<br />
2016/11<br />
2016/12<br />
* Data source: JETNET & ASG<br />
Last, but not least is the ACJ220 which is still a project very much<br />
on the drawing board but being talked about nevertheless. With<br />
Bombardier and Airbus now partners on the former C Series and the<br />
program subsequently rebranded the A220, an ACJ220 potential fills<br />
in the bottom of the ACJ family previously occupied by the ACJ318<br />
and for Bombardier Business Aircraft provides a product that could<br />
nicely sit between the current Challenger and Global product lines.<br />
As sales of the A220 have fallen to Airbus Group, maybe we will<br />
see an ACJ220 being sold by Bombardier in the end. To fit either<br />
role, the A220 will need to be modified and avoid the limitations<br />
of the A318. For instance, the airliner A220-100 only has a range<br />
of 3,100nm so this would need to be pushed out into the 5,000nm<br />
range. Customization and a high-quality fit and finish to the cabin will<br />
be a requirement for any buyer of a business jet in this segment too.<br />
Lastly, the needs of the Asian market will need to be factored into the<br />
final specification of the aircraft because, if the past is any indication<br />
of the future, markets for Corporate Airliners, Asia will be one of the<br />
most dominate.<br />
ACJ319<br />
2017/01<br />
2017/02<br />
2017/03<br />
2017/04<br />
BBJ<br />
2017/05<br />
2017/06<br />
BBJ2<br />
1 1 1<br />
1<br />
2 2 2<br />
2017/07<br />
2017/08<br />
2017/09<br />
2017/10<br />
Challenger 850 Lineage 1000<br />
1 1 1 1 1 1 1 1 1 1 1 1 1 1 1<br />
2017/11<br />
2<br />
2017/12<br />
2018/01<br />
2018/02<br />
3<br />
2018/03<br />
1<br />
1<br />
2018/04<br />
2018/05<br />
2018/06<br />
2018/07<br />
2018/08<br />
THIRD QUARTER 2018 — ASIAN SKY QUARTERLY | 33
MARKET DYNAMICS<br />
PRE-OWNED BUSINESS JETS FOR SALE - 2018 Q3<br />
INV<strong>EN</strong>TORY VALUE (USD) 1<br />
$7,804M<br />
WORLDWIDE<br />
$6,080M<br />
JUN 2018<br />
$5,765M<br />
$1,322M<br />
ASIA PACIFIC<br />
$1,117M<br />
$1,036M<br />
JUN 2018<br />
Sep<br />
2016<br />
Oct Nov Dec Jan Feb Mar Apr May Jun Jul Aug Sep Oct Nov Dec Jan Feb Mar Apr May Jun Jul Aug<br />
2017<br />
2018<br />
Sep<br />
The Inventory Value Line represents the number of aircraft actively being marketed for sale in USD terms. 2<br />
The Trend Line represents the market’s direction in terms of the balance between sellers and buyers (supply and<br />
demand) at today’s price levels. A rising Trend Line indicates that pre-owned activity is stabilizing, with sellers of<br />
aircraft increasingly likely to find buyers.<br />
The Signal Line represents an indication of where the market’s direction may be heading in the future. A Signal<br />
Line consistently falling below the Trend Line indicates that any improvement in the market’s direction may not be<br />
entirely sustainable.<br />
MARKET TR<strong>EN</strong>D 1<br />
WORLDWIDE<br />
TR<strong>EN</strong>D REVERSAL<br />
TR<strong>EN</strong>D<br />
IMPROVEM<strong>EN</strong>T<br />
TR<strong>EN</strong>D<br />
WORS<strong>EN</strong>ING<br />
MOVING TOWARDS SELLER’S MARKET<br />
MOVING TOWARDS BUYER’S MARKET<br />
AIRCRAFT SOLD 1<br />
WORLDWIDE<br />
23<br />
30<br />
28<br />
32<br />
21<br />
25 25<br />
5<br />
22<br />
36<br />
30<br />
37<br />
38<br />
34<br />
34<br />
30 30 31 31<br />
28<br />
23<br />
24<br />
30<br />
28<br />
20<br />
Sep<br />
2016<br />
Oct Nov Dec Jan Feb Mar Apr May Jun Jul Aug Sep Oct Nov Dec Jan Feb Mar Apr May Jun Jul Aug<br />
2017<br />
2018<br />
Sep<br />
1 The historical inventory value and transactions are subject to change based on latest market information updates.<br />
2 ASG’s Inventory Value line is calculated by taking the total number of aircraft for sale from a selection of 26 different models, multiplied by their average asking prices.<br />
34 | ASIAN SKY QUARTERLY — THIRD QUARTER 2018<br />
Source: JETNET & ASG
MARKET DYNAMICS<br />
% OF FLEET SOLD<br />
1.00%<br />
0.95%<br />
0.90%<br />
0.85%<br />
0.80%<br />
0.75%<br />
0.70%<br />
0.65%<br />
0.60%<br />
0.55%<br />
0.50%<br />
0.45%<br />
0.40%<br />
Sep<br />
16<br />
Nov<br />
16<br />
Jan<br />
17<br />
Mar<br />
17<br />
May<br />
17<br />
Jul<br />
17<br />
Sep<br />
17<br />
Nov<br />
17<br />
Jan<br />
18<br />
Mar<br />
18<br />
May<br />
18<br />
Jul<br />
18<br />
Sep<br />
18<br />
AVERAGE ASKING PRICE<br />
MILLION USD<br />
26<br />
25<br />
24<br />
23<br />
ASIA PACIFIC<br />
22<br />
21<br />
20<br />
19<br />
18<br />
WORLDWIDE<br />
17<br />
Sep<br />
16<br />
Nov<br />
16<br />
Jan<br />
17<br />
Mar<br />
17<br />
May<br />
17<br />
Jul<br />
17<br />
Sep<br />
17<br />
Nov<br />
17<br />
Jan<br />
18<br />
Mar<br />
18<br />
May<br />
18<br />
Jul<br />
18<br />
Sep<br />
18<br />
% OF FLEET FOR SALE<br />
15%<br />
13%<br />
ASIA PACIFIC<br />
11%<br />
9%<br />
7%<br />
WORLDWIDE<br />
5%<br />
3%<br />
Sep<br />
16<br />
Nov<br />
16<br />
Jan<br />
17<br />
Mar<br />
17<br />
May<br />
17<br />
Jul<br />
17<br />
Sep<br />
17<br />
Nov<br />
17<br />
Jan<br />
18<br />
Mar<br />
18<br />
May<br />
18<br />
Jul<br />
18<br />
Sep<br />
18<br />
AVERAGE DAYS ON MARKET<br />
620<br />
570<br />
520<br />
470<br />
ASIA PACIFIC<br />
420<br />
370<br />
320<br />
WORLDWIDE<br />
270<br />
220<br />
Sep<br />
16<br />
Nov<br />
16<br />
Jan<br />
17<br />
Mar<br />
17<br />
May<br />
17<br />
Jul<br />
17<br />
Sep<br />
17<br />
Nov<br />
17<br />
Jan<br />
18<br />
Mar<br />
18<br />
May<br />
18<br />
Jul<br />
18<br />
Sep<br />
18<br />
Source: JETNET & ASG<br />
THIRD QUARTER 2018 — ASIAN SKY QUARTERLY | 35
MARKET DYNAMICS<br />
SUPPLY / DEMAND INDICATORS<br />
BUSINESS JETS<br />
SUPPLY VS. DEMAND RATIO<br />
AVERAGE DAYS ON MARKET<br />
SUPPLY ><br />
DEMAND<br />
% OF FLEET<br />
FOR SALE<br />
MODEL<br />
DAYS ON MARKET<br />
25.0%<br />
12.9%<br />
11.1%<br />
18.2%<br />
5.3%<br />
3.5%<br />
14.1%<br />
7.7%<br />
3.6%<br />
8.0%<br />
6.3%<br />
20.7%<br />
EMBRAER BOMBARDIER BOEING AIRBUS<br />
ACJ318<br />
ACJ319<br />
BBJ<br />
BBJ2<br />
CL604<br />
CL605<br />
CL850<br />
GL5000<br />
GL6000<br />
L600<br />
L650<br />
L1000<br />
AVERAGE<br />
1.5%<br />
2.8%<br />
5.1%<br />
F2000LX<br />
F2000LXS<br />
F2000S<br />
AVERAGE<br />
7.9%<br />
2.5%<br />
3.4%<br />
8.3%<br />
1.5%<br />
13.4%<br />
1.4%<br />
6.2%<br />
4.7%<br />
4.4%<br />
DASSAULT<br />
GULFSTREAM<br />
F7X<br />
F900DX<br />
F900EX<br />
F900EXe<br />
F900LX<br />
G200<br />
G280<br />
G450<br />
G550<br />
G650<br />
5.9%<br />
G650ER<br />
400% 300% 200% 100%<br />
0<br />
Average AC for sale / Total sold in last 12 months<br />
6.2%<br />
Average<br />
0 200 400 600 800 1000<br />
The above chart reflects where certain aircraft models are positioned<br />
in terms of supply and demand (based on a ratio of completed<br />
transactions compared to the number of sellers and the average<br />
number of days on the market for a transaction to take place).<br />
These indications do not necessarily mean that prices will be higher in<br />
the future, but it does indicate that sellers of these particular models<br />
are more likely to find willing buyers in a shorter period of time than the<br />
overall average.<br />
For some model types, given the market indicators shown on the<br />
previous page, the stabilization in pre-owned asking prices and<br />
decline in inventory level appear to have stimulated increased<br />
demand, leading to an increase in transactions and a more balanced<br />
state of supply and demand.<br />
This can be seen most with certain Gulfstream (G200, G450, G550,<br />
G650) and Bombardier models (Challenger 604/605 & Global 5000)<br />
where more transactions are occurring relative to the number for<br />
sale, and transactions are requiring less time on the market for<br />
sellers to complete.<br />
36 | ASIAN SKY QUARTERLY — THIRD QUARTER 2018<br />
Source: JETNET & ASG
MARKET DYNAMICS<br />
MARKET POSITIONING<br />
BUSINESS JETS<br />
MOVING TOWARDS<br />
BUYER’S MARKET<br />
Balanced<br />
Supply & Demand<br />
MOVING TOWARDS<br />
SELLER’S MARKET<br />
AIRBUS<br />
BOEING<br />
ACJ318<br />
ACJ319<br />
BBJ 1<br />
BBJ 2<br />
CL604<br />
BOMBARDIER<br />
CL605<br />
CL850<br />
GL5000<br />
GL6000<br />
EMBRAER<br />
L600<br />
L650<br />
L1000<br />
F2000LX<br />
F2000LXS<br />
F2000S<br />
DASSAULT<br />
F7X<br />
F900DX<br />
F900EX<br />
F900EXe<br />
F900LX<br />
G200<br />
GULFSTREAM<br />
G280<br />
G450<br />
G550<br />
G650<br />
G650ER<br />
The above chart provides a visual representation of the Supply /<br />
Demand Ratio of each aircraft model relative to the overall market,<br />
and is based on a ‘Marketability’ calculation for each particular model<br />
including the following four market indicators:<br />
When taking into account these four factors, the large and medium<br />
sized jet, such as Challenger 600, Falcon 2000 & 900 Series, as well as<br />
the various Gulfstream models, appear well positioned to find buyers<br />
available.<br />
1. The percentage of aircraft for sale relative to its fleet size.<br />
2. The number of aircraft sold relative to the average number for sale.<br />
3. The average days for sale relative to the overall market average.<br />
4. The momentum of the marketplace (represented by the trend<br />
towards supply and demand market equilibrium portrayed earlier).<br />
* ASG chose 26 popular aircraft models as described in this report<br />
Source: JETNET & ASG<br />
THIRD QUARTER 2018 — ASIAN SKY QUARTERLY | 37
MARKET DYNAMICS<br />
PRE-OWNED CIVIL HELICOPTERS FOR SALE - 2018 Q3<br />
INV<strong>EN</strong>TORY VALUE (USD) 1<br />
$1,354M<br />
JUN 2018<br />
WORLDWIDE<br />
$1,167M<br />
$1,089M<br />
ASIA PACIFIC<br />
$123M<br />
$113M<br />
JUN 2018<br />
$104M<br />
Sep<br />
2016<br />
Oct Nov Dec Jan Feb Mar Apr May Jun Jul Aug Sep Oct Nov Dec Jan Feb Mar Apr May Jun Jul Aug<br />
2017<br />
2018<br />
Sep<br />
The Inventory Value Line represents the number of aircraft actively being marketed for sale in USD terms. 2<br />
The Trend Line represents the market’s direction in terms of the balance between sellers and buyers (supply and<br />
demand) at today’s price levels. A rising Trend Line indicates that pre-owned activity is stabilizing, with sellers of<br />
aircraft increasingly likely to find buyers.<br />
The Signal Line represents an indication of where the market’s direction may be heading in the future. A Signal<br />
Line consistently falling below the Trend Line indicates that any improvement in the market’s direction may not be<br />
entirely sustainable.<br />
MARKET TR<strong>EN</strong>D 1<br />
WORLDWIDE<br />
TR<strong>EN</strong>D<br />
REVERSAL<br />
MOVING TOWARDS SELLER’S MARKET<br />
MOVING TOWARDS BUYER’S MARKET<br />
TR<strong>EN</strong>D<br />
IMPROVEM<strong>EN</strong>T<br />
TR<strong>EN</strong>D<br />
WORS<strong>EN</strong>ING<br />
AIRCRAFT SOLD 1<br />
WORLDWIDE<br />
10<br />
Sep<br />
2016<br />
8<br />
7 7 7<br />
10 10<br />
9<br />
10<br />
7<br />
6<br />
7<br />
4<br />
2<br />
1<br />
6<br />
9<br />
13<br />
14<br />
12 9<br />
9<br />
7 7 7<br />
Oct Nov Dec Jan Feb Mar Apr May Jun Jul Aug Sep Oct Nov Dec Jan Feb Mar Apr May Jun Jul Aug<br />
2017<br />
2018<br />
Sep<br />
1 The historical inventory value and transactions are subject to change based on latest market information updates.<br />
2 ASG’s Inventory Value line is calculated by taking the total number of aircraft for sale from a selection of 16 different models, multiplied by their average asking prices.<br />
38 | ASIAN SKY QUARTERLY — THIRD QUARTER 2018<br />
Source: JETNET & ASG
MARKET DYNAMICS<br />
% OF FLEET SOLD<br />
0.35%<br />
0.30%<br />
0.25%<br />
0.20%<br />
0.15%<br />
0.10%<br />
0.05%<br />
0.00%<br />
Sep<br />
16<br />
Nov<br />
16<br />
Jan<br />
17<br />
Mar<br />
17<br />
May<br />
17<br />
Jul<br />
17<br />
Sep<br />
17<br />
Nov<br />
17<br />
Jan<br />
18<br />
Mar<br />
18<br />
May<br />
18<br />
Jul<br />
18<br />
Sep<br />
18<br />
AVERAGE ASKING PRICE<br />
MILLION USD<br />
6.5<br />
6<br />
ASIA PACIFIC<br />
5.5<br />
5<br />
WORLDWIDE<br />
4.5<br />
4<br />
Sep<br />
16<br />
Nov<br />
16<br />
Jan<br />
17<br />
Mar<br />
17<br />
May<br />
17<br />
Jul<br />
17<br />
Sep<br />
17<br />
Nov<br />
17<br />
Jan<br />
18<br />
Mar<br />
18<br />
May<br />
18<br />
Jul<br />
18<br />
Sep<br />
18<br />
% OF FLEET FOR SALE<br />
8.0%<br />
7.0%<br />
ASIA PACIFIC<br />
6.0%<br />
5.0%<br />
4.0%<br />
3.0%<br />
WORLDWIDE<br />
2.0%<br />
1.0%<br />
0.0%<br />
Sep<br />
16<br />
Nov<br />
16<br />
Jan<br />
17<br />
Mar<br />
17<br />
May<br />
17<br />
Jul<br />
17<br />
Sep<br />
17<br />
Nov<br />
17<br />
Jan<br />
18<br />
Mar<br />
18<br />
May<br />
18<br />
Jul<br />
18<br />
Sep<br />
18<br />
AVERAGE DAYS ON MARKET<br />
800<br />
750<br />
700<br />
650<br />
600<br />
WORLDWIDE<br />
550<br />
500<br />
450<br />
400<br />
ASIA PACIFIC<br />
350<br />
300<br />
Sep<br />
16<br />
Nov<br />
16<br />
Jan<br />
17<br />
Mar<br />
17<br />
May<br />
17<br />
Jul<br />
17<br />
Sep<br />
17<br />
Nov<br />
17<br />
Jan<br />
18<br />
Mar<br />
18<br />
May<br />
18<br />
Jul<br />
18<br />
Sep<br />
18<br />
Source: JETNET & ASG<br />
THIRD QUARTER 2018 — ASIAN SKY QUARTERLY | 39
MARKET DYNAMICS<br />
SUPPLY / DEMAND INDICATORS<br />
CIVIL HELICOPTERS<br />
SUPPLY VS. DEMAND RATIO<br />
AVERAGE DAYS ON MARKET<br />
SUPPLY ><br />
DEMAND<br />
% OF FLEET<br />
FOR SALE<br />
MODEL<br />
DAYS ON MARKET<br />
15.1%<br />
S76C+<br />
11.5%<br />
SIKORSKY<br />
S76C++<br />
3.2%<br />
S92A<br />
AVERAGE<br />
6.2%<br />
8.2%<br />
4.7%<br />
BELL HELICOPTER<br />
BELL 412EP<br />
BELL 412HP<br />
BELL 429<br />
AVERAGE<br />
13.4%<br />
AW109E PWR<br />
5.1%<br />
LEONARDO<br />
AW109SP GN<br />
2.9%<br />
AW139<br />
3.0%<br />
AS332L1<br />
9.5%<br />
H225<br />
5.2%<br />
4.2%<br />
1.2%<br />
AIRBUS HELICOPTERS<br />
EC135P2<br />
EC135T2<br />
EC145<br />
25.0%<br />
EC155B<br />
6.8%<br />
H155<br />
350% 300% 250% 200% 150% 100% 50% 0<br />
Average AC for sale / Total sold in last 12 months<br />
5.5%<br />
Average<br />
0 100 200 300 400 500 600 700 800<br />
The above chart reflects where certain aircraft models are positioned in terms of supply and demand (based on a ration of completed transactions<br />
compared to the number of sellers, and average number of days on the market for a transaction to take place).<br />
40 | ASIAN SKY QUARTERLY — THIRD QUARTER 2018<br />
Source: JETNET & ASG
MARKET DYNAMICS<br />
MARKET POSITIONING<br />
CIVIL HELICOPTERS<br />
MOVING TOWARDS<br />
BUYER’S MARKET<br />
Balanced<br />
Supply & Demand<br />
MOVING TOWARDS<br />
SELLER’S MARKET<br />
S76C+<br />
SIKORSKY<br />
S76C++<br />
S92A<br />
BELL HELICOPTER<br />
BELL 412EP<br />
BELL 412HP<br />
BELL 429<br />
AW109E PWR<br />
LEONARDO<br />
AW109SP GN<br />
AW139<br />
AS332L1<br />
H225<br />
AIRBUS HELICOPTERS<br />
EC135P2<br />
EC135T2<br />
EC145<br />
EC155B<br />
H155<br />
The above chart provides a visual representation of the Supply / Demand Ratio of each aircraft model relative to the overall market, resulting in a<br />
‘Marketability’ calculation of each particular model based on the following four market indicators:<br />
1. The percentage of aircraft for sale relative to its fleet size.<br />
2. The number of aircraft sold relative to the average number for sale.<br />
3. The average days for sale relative to the overall market average.<br />
4. The momentum of the marketplace (represented by the trend towards supply and demand market equilibrium portrayed earlier).<br />
Source: JETNET & ASG<br />
THIRD QUARTER 2018 — ASIAN SKY QUARTERLY | 41
INTERVIEW:<br />
MICHAEL HUI, ASG CONSULTING MANAGER<br />
EXPANDING CONSULTING SERVICES<br />
Interview by Litalia Yoakum<br />
With close to a decade of experience in the aviation industry, Asian Sky Group’s latest addition,<br />
Michael Hui, is bringing a different perspective to the consulting division. After working in<br />
commercial aviation for the length of his career, Michael is hopeful his knowledge will offer a new<br />
light to the division. As a dual citizen of both Hong Kong and Australia, he has the capacity to work crossculturally,<br />
in English, Mandarin and Cantonese.<br />
What attracted you to the aviation industry?<br />
The initial attraction started with a desire to travel around the world,<br />
after holidaying to several destinations with my father. This led to<br />
childhood aspirations of being a pilot. I later learned the pilot lifestyle<br />
might not be suitable for myself.<br />
Still, aviation was something I wanted to pursue, so I studied Aviation<br />
Management at the University of New South Wales in Australia. During<br />
the program, I learned the fundamentals of this quickly evolving<br />
industry. My excitement of working in aviation grew as I gained more<br />
practical experience.<br />
Tell me about your experience prior to joining<br />
Asian Sky Group?<br />
I have almost 10 years of experience in the aviation industry. After<br />
completing my Aviation Management degree, I began an internship at<br />
Hong Kong-based aircraft engineering and maintenance group HAECO,<br />
where I was part of the Inventory Technical Management team for<br />
two months. This was an intensive period, where the department<br />
mainly dealt with aircraft on ground (AOG) assignments, requiring tight<br />
scheduling periods and close cooperation in replacing and sourcing<br />
aircraft parts around the world.<br />
I then worked full-time at a regional airline in Australia, Regional<br />
Express (REX). My first role at REX involved updating technical<br />
documentation onboard, sometimes this involved driving around the<br />
tarmac and playing ‘hide-and-seek’ with 40 aircraft. I then moved over<br />
to REX’s commercial team, where I was responsible for the airline’s<br />
route profitability analysis. The challenge of this role was to maintain<br />
competitiveness against larger Australian airlines, such as Qantas<br />
Group and Virgin Australia, while improving the bottom line.<br />
My first aviation consultancy experience was with Sydney-based<br />
Ailevon Pacific Aviation Consulting, a consultancy firm that provides<br />
air service solutions to the major airports in the Australasia region.<br />
The company assists airports in attracting new airline businesses,<br />
while lobbying policy makers to expand bilateral agreements. During<br />
my time with this company, there was an influx of inbound travellers<br />
visiting the Australasia region. Thus, airports were actively seeking<br />
solutions for more infrastructure.<br />
In 2014, I moved to Hong Kong to work with Flight Ascend Consultancy,<br />
the advisory division of FlightGlobal, which is one of the leading<br />
aviation data providers. One of my key responsibilities at Flight Ascend<br />
Consultancy was aircraft valuation, where I would put a ‘price-tag’ on<br />
aircraft. This included tracking aircraft transactions and identifying key<br />
trends of aircraft values. On top of that, I was responsible for strategic<br />
planning and market analysis for various aviation stakeholders.<br />
Throughout my time in the commercial aviation sector, I’ve been<br />
fortunate to participate in a broad spectrum of the business, learning<br />
a lot along the way from the people I’ve met and projects I’ve worked<br />
on. Working alongside knowledgeable industry veterans has been<br />
inspiring. Every consultancy project I participated in and contributed<br />
to was informative and telling of the growing industry.<br />
42 | ASIAN SKY QUARTERLY — THIRD QUARTER 2018
INDUSTRY INSIDER<br />
Are there trends you witnessed in commercial<br />
aviation that you expect to transfer to<br />
business aviation?<br />
Commercial aviation has changed significantly over the years, in terms<br />
of aircraft management and ownership — especially in Asia, where<br />
more and more airlines are leasing aircraft from aircraft lessors.<br />
Airlines understand the benefits of being more flexible with their<br />
fleet management. Consequently, this has created more investment<br />
opportunities for aircraft lessors.<br />
In recent years, this has attracted more investors to develop aircraft<br />
leasing businesses and created more competition in the commercial<br />
aircraft leasing industry. However, I believe this business model can<br />
be transferred to business aviation as well. Aircraft leasing companies<br />
will begin to diversify their portfolios with private jets and helicopters<br />
to seek new opportunities as the airline sectors become overcrowded.<br />
What is the biggest challenge to growing the<br />
business aviation industry?<br />
In different stages of my consultancy work, I helped major airports in<br />
evaluating their long-term strategic planning. Several times, airport<br />
managers have considered sacrificing business/general aviation (B/<br />
GA) capacity and infrastructure to compensate for commercial airline<br />
growth<br />
Unfortunately, this doesn’t consider the vital role B/GA plays in the<br />
industry, the community and for the economy. This requires constant<br />
education to change preconceived notions that this segment is<br />
unnecessary and not as lucrative as commercial.<br />
Every consultancy project I<br />
participated in and contributed<br />
to was informative and telling<br />
of the growing industry.<br />
What consulting services does ASG provide?<br />
ASG provides a wide-range of aviation consulting services,<br />
including transactional advisory, operation advisory and completion<br />
management. Our work extends to all facets and life cycles of an<br />
aircraft, from the moment there’s interest in acquiring an aircraft.<br />
We continue to aid in choosing the most suitable model and conduct<br />
extensive market research to find the right purchase or selling price.<br />
ASG also assists with furnishing the interior of an aircraft, management<br />
selection and aircraft charter needs.<br />
For aviation companies, ASG’s consulting division offers solutions<br />
to develop business strategies and maximize market reach. Our<br />
research and analysis can aid in determining the feasibility of projects,<br />
ultimately helping a company’s bottom line.<br />
The knowledge and insight that ASG puts forth can be seen in our<br />
industry reports. Our team works with the regional industry to analyze<br />
fleet numbers and forecast what’s to come. In turn, we put out<br />
insightful and highly-anticipated reports throughout that year. This<br />
same sort of analysis is a clear example of what we can do for clients,<br />
in a more tailored manner.<br />
What do you expect for the future of ASG’s<br />
consulting division?<br />
ASG’s consulting division has grown immensely over the past few<br />
years and we hope to continue this development. Supported by our<br />
network of multi-lingual analysts and an extensive network of support<br />
throughout the industry, ASG will provide more tailored data for clients<br />
to offer several different perspectives. My objective is to utilize what<br />
I’ve learned in the commercial aviation sector and translate it to the<br />
general aviation world.<br />
The goal is to collate and synergize our data, experience and knowledge<br />
so that we can support the wider general aviation community to tackle<br />
day-to-day and long-term challenges.<br />
www.asianskygroup.com<br />
THIRD QUARTER 2018 — ASIAN SKY QUARTERLY | 43
AIRCRAFT SPOTLIGHT<br />
GLOBAL SERIES LINEUP<br />
In 2018, Bombardier Business Aircraft unveiled two additions to its fleet:<br />
the Global 5500 and the Global 6500. The latest variants entered the Global<br />
series just as the Canadian manufacturer elevated its Global 7000 to the<br />
Global 7500, making the upgraded model the line’s flagship aircraft.<br />
THIRD QUARTER 2018 — ASIAN SKY QUARTERLY | 45
Global 7500<br />
The 7500 is set to enter service in late 2018 and is marketed as the<br />
largest and longest-range business jet ever built, with an increased<br />
range of 7,700 nautical miles and a top speed of Mach 0.925. It is<br />
now the only business jet that can connect New York to Hong Kong<br />
and Singapore to San Francisco, powered by GE Passport engines.<br />
Sophisticated wing design gives the aircraft a takeoff distance of 5,800<br />
feet, allowing it to access airports with shorter runways. The landing<br />
performance of the 7500 has also been improved, now rivalling the<br />
stopping distance of aircraft in the light jet category.<br />
With four living spaces, the Global 7500 offers an unprecedented<br />
collection of floor plans and furnishing options suitable for up to 19<br />
passengers. Its cabin height stands at 6 feet 2 inches, with a width of<br />
8ft and length of 54ft 5in. This aircraft is also the first in Bombardier’s<br />
Global series to feature the Nuage seat, designed for ergonomic<br />
comfort with capability for swivelling and deep recline.<br />
In the cockpit, the Global 7500 features the Bombardier Vision<br />
flight deck from Rockwell Collins with next generation fly-by-wire<br />
technology, four large display, as well as a Head-Up Display (HUD),<br />
Enhanced Vision System (EVS) and Synthetic Vision System (SVS).<br />
SPECS<br />
PERFORMANCES GLOBAL 5500 GLOBAL 6500<br />
GLOBAL 7500<br />
Maximum Range<br />
Passenger<br />
Top Speed<br />
Takeoff Distance<br />
Landing Distance<br />
Maximum Operating Altitude<br />
5,700 nm<br />
UP to 16<br />
0.90 Mach<br />
5,490 ft<br />
2,207 ft<br />
51,000 ft<br />
6,600 nm<br />
UP to 17<br />
0.90 Mach<br />
6,370 ft<br />
2,236 ft<br />
51,000 ft<br />
7,700 nm<br />
UP to 19<br />
0.925 Mach<br />
5,800 ft<br />
2,520 ft<br />
51,000 ft<br />
<strong>EN</strong>GINES<br />
Manufacturer<br />
Thrust<br />
Rolls-Royce Pearl<br />
15,125 lb (67.3 kN)<br />
Rolls-Royce Pearl<br />
15,125 lb (67.3 kN)<br />
GE Passport<br />
18,650 lb (83 kN)<br />
AVIONICS<br />
• Bombardier Vision flight deck<br />
• Four large displays<br />
• Combined Vision System (CVS), Head-Up Display (HUD)<br />
• Graphical flight planning, Airport Moving Map (AMM)<br />
• MultiScan TM weather radar<br />
• ADS-B in<br />
• Latest Performance Based Navigation (PBN):<br />
• SBAS/ WAAS<br />
• LPV approach<br />
• RNAV, en-route RNP & RNP AR approaches<br />
• Controller Pilot Data Link Communication (CPDLC)<br />
• Datalink, high-speed SATCOM<br />
46 | ASIAN SKY QUARTERLY — THIRD QUARTER 2018
UPCOMING AIRCRAFT<br />
Global 5500 and Global 6500<br />
The Global 5500 and Global 6500 join the 7500 in Bombardier’s largecategory<br />
family. The two new aircraft build on the success of the Global<br />
5000 and Global 6000 by offering increased range, with 5,700nm and<br />
6,600nmm, respectively. While the 5500 connects Sao Paolo and Paris<br />
and Moscow and Los Angeles, the 6500 connects Hong Kong and<br />
London. These aircraft each reach top speeds of Mach 0.90, powered<br />
by brand-new Rolls-Royce Pearl engines. The new engines contribute<br />
to an additional 1,000-pounds of thrust and decreased fuel burn of up<br />
to 13 percent.<br />
Both the 5500 and 6500 offer open living spaces for up to 16 and<br />
17 passengers, respectively. Their spacious cabins offer a variety of<br />
configurations and a sleek design, each including a kitchen. The 6500<br />
also features a dedicated crew suite.<br />
Featuring the Bombardier Vision flight deck, the avionics in the Global<br />
5500 and Global 6500 offer improved capabilities combining synthetic<br />
and infrared enhanced vision onto the HUD giving pilots<br />
improved situational awareness and clears the way for smooth<br />
landings in difficult conditions.<br />
Expected to enter service at the end of 2019, the Global 5500<br />
and Global 6500 aircraft boast operating costs that rival all other<br />
aircraft in their class. Bombardier offers owners an extensive<br />
support system backed by a worldwide presence, including two<br />
service centers in Asia; one in Singapore and the other in Tianjin,<br />
China.<br />
www.businessaircraft.bombardier.com<br />
RANGE MAP<br />
Global 7500 range map<br />
from Hong Kong<br />
Global 6500 range map<br />
from Hong Kong<br />
Global 6500 range map<br />
from Hong Kong<br />
THIRD QUARTER 2018 — ASIAN SKY QUARTERLY | 47
48 | ASIAN SKY QUARTERLY — THIRD QUARTER 2018
AIRCRAFT POSITIONING<br />
BUSINESS JETS<br />
CORP. AIRLINER<br />
LONG RANGE<br />
LARGE<br />
MEDIUM<br />
LIGHT<br />
VERY LIGHT<br />
ACJ321 BBJ3<br />
BBJ2<br />
ACJ320<br />
ACJ319<br />
BBJ<br />
ACJ318 G650ER<br />
G650<br />
GLOBAL 6000<br />
G550<br />
LINEAGE 1000E<br />
F8X<br />
GLOBAL 5000<br />
G500<br />
F7X<br />
G450<br />
F900LX<br />
24<br />
23<br />
22<br />
21<br />
20<br />
19<br />
18<br />
17<br />
16<br />
15<br />
14<br />
13<br />
12<br />
11<br />
10<br />
9<br />
8<br />
CIT. M2<br />
CIT. CJ1+<br />
CIT. CJ1<br />
PREMIER 1A<br />
HONDAJET<br />
CIT. XLS+<br />
CIT. XLS<br />
CIT. CJ3+<br />
CIT. SOVEREIGN+<br />
L75<br />
L70<br />
CIT. VII<br />
CIT. CJ4<br />
CIT. EXCEL<br />
CIT. CJ2+ CIT. CJ3<br />
DIAMOND 1A<br />
CIT. <strong>EN</strong>CORE+<br />
LEGACY 500<br />
LEGACY 600<br />
LEGACY 450<br />
CIT. SOVEREIGN<br />
H850XP<br />
NEXTANT 400XTI<br />
CIT. <strong>EN</strong>CORE CIT. ULTRA<br />
BEECHJET 400<br />
CIT. CJ2<br />
H400XP<br />
PH<strong>EN</strong>OM 100E<br />
CL850<br />
CIT. LATITUDE<br />
LEGACY 650<br />
CIT. X+<br />
CIT. X<br />
CL300<br />
H4000<br />
ASTRA SP<br />
CL350<br />
G350<br />
H900XP<br />
H800 H800XP<br />
PH<strong>EN</strong>OM 300<br />
L45XR L60XR<br />
L40XR<br />
G100<br />
CIT. BRAVO<br />
CL605<br />
F50EX<br />
G200<br />
GLOBAL EXPRESS XRS<br />
F2000LXS<br />
CL650<br />
F2000S<br />
GLOBAL EXPRESS<br />
G280<br />
F2000LX<br />
G-IVSP<br />
F900EX EASY<br />
F2000DX F900EX<br />
G-IV<br />
F2000<br />
G300 F2000EX<br />
G150<br />
CL604<br />
G600<br />
G-V<br />
7<br />
6<br />
4<br />
3<br />
2<br />
TOTAL ANNUAL COST (MILLION USD/YEAR)<br />
CIT. MUSTANG<br />
ECLIPSE 550<br />
500<br />
1,000<br />
1,500<br />
2,000<br />
2,500<br />
3,000<br />
3,500<br />
4,000<br />
4,500<br />
5,000<br />
5,500<br />
6,000<br />
6,500<br />
7,000<br />
7,500<br />
8,000<br />
1<br />
MAX RANGE (N.M.)<br />
* The estimated total yearly cost is based on aircraft ownership cost for 10 years including financing, plus annual operating costs and regional adjustments.<br />
Source: Conklin & de Decker 2017<br />
THIRD QUARTER 2018 — ASIAN SKY QUARTERLY | 49
AIRBUS<br />
0+4+0 0+0+0 4+0+<br />
4+0 0+0+0 4+0 0+0+0 4+0 0+5+0 0+0+0 5+0 0+0+0 5+0 1+0+0 5+0 4+0 0+ 0+0+0 5+0 0+0+0 5+0<br />
0+0+0 0+0+0 1+0+00+0+00+0<br />
SUMMARY -- JETS<br />
MARKET SUMMARY PER MODEL — BUSINESS JETS<br />
INV<strong>EN</strong>TORY LEVEL, PRICE TR<strong>EN</strong>D & TRANSACTIONS<br />
ACJ318<br />
• There are currently 5 Airbus ACJ318s available for sale, 2 on-market and 3<br />
off-market. The inventory level stayed at 5 in Q3 2018, which represents 25%<br />
of the total 20 aircraft in service.<br />
• Current asking prices range from US$33.5M for a 2008 model with 3,150<br />
hours to US$26M for a 2008 model with around 5,130 total hours. Average<br />
asking price of Q3 2018 went up to US$30.3M.<br />
• In Q3 2018, the average days on market for sale risen to 1,097 days.<br />
• There was one transaction completed in Q3 2018 and another under sales<br />
pending.<br />
Average Asking Price<br />
$30.3<br />
$30.0<br />
SPECS<br />
Max Range<br />
4,253 N.M. / 7,877 km (with ACTs)<br />
Max Speed<br />
Mach 0.82<br />
$29.3<br />
Typ. Passengers 19<br />
FOR SALE<br />
2018 Q3 2018 Q2<br />
For Sale vs. Sold<br />
No. for Sale<br />
5 (25.0%) 5 (25.0%)<br />
Avg Asking Price 30.3M USD 30.0M USD<br />
5 5 5 5 5 5 5<br />
Avg Days on Market 1,097 1,237<br />
4 4 4 4 4<br />
4<br />
1<br />
1<br />
2018 Q3 2018 Q2<br />
SOLD<br />
Past 12 Months 2<br />
2<br />
Sep Dec Mar Jun Sep<br />
2017 2018 Past 3 Months 0<br />
1<br />
For Sale Sold<br />
ACJ319<br />
0+10+0 0+0+0 12+0 14+0 0+0+0 0+14+0 2+0+0 14+0 0+ 0+0+0 14+0 0+14+0 0+0+0 18+0+<br />
2+0+0 20+0 0+16+0 0+0+0 20+0 0+0+0 0+18+0<br />
0+0+0<br />
0+0+0<br />
$39.0<br />
5<br />
6<br />
Average Asking Price<br />
For Sale vs. Sold<br />
7 7 7 7 7 7<br />
1<br />
1<br />
9<br />
$47.1<br />
$51.4<br />
10 10<br />
8<br />
$50.8<br />
Sep Dec Mar Jun Sep<br />
2017 2018<br />
Sold<br />
For Sale<br />
9<br />
• There are currently 9 Airbus ACJ319s available for sale; 6 on-market and 3<br />
off-market. This represents 13% of the total 70 aircraft in service. The inventory<br />
level increased only slightly from 8 in Q2.<br />
• Current asking prices range from US$70M for a 2011 model which entered<br />
service in 2017 to US$18M for a 1999 model with 8,678 total hours. The average<br />
asking price in Q3 increased to US$50.8M.<br />
• In Q3 2018, 2 aircraft entered the market while 1 aircraft moved off-market.<br />
• The average days on market for sale for the ACJ319 is 354 days.<br />
• No transactions were completed in Q3.<br />
SPECS<br />
Max Range<br />
Max Speed<br />
Typ. Passengers<br />
FOR SALE<br />
No. for Sale<br />
Avg Asking Price<br />
Avg Days on Market<br />
SOLD<br />
Past 12 Months<br />
Past 3 Months<br />
6,000 N.M. /11,112 km<br />
Mach 0.82<br />
19<br />
2018 Q3<br />
9 (12.9%)<br />
50.8M USD<br />
354<br />
2018 Q3<br />
2<br />
0<br />
2017 Q2<br />
10 (14.1%)<br />
39.3M USD<br />
322<br />
2017 Q2<br />
4<br />
0<br />
50 | ASIAN SKY QUARTERLY — THIRD QUARTER 2018<br />
Source: JETNET & ASG
MARKET SUMMARY -- JETS<br />
BBJ<br />
• There are currently 15 Boeing BBJs available for sale. This represents<br />
approximately 11% of the total 135 aircraft in service. The inventory level<br />
declined in Q2 2018 with 1 aircraft sold.<br />
• The BBJ pre-owned market is segmented into two main categories: 2008<br />
YOM & up, typically asking US$49 million and above; and 2002 YOM & down,<br />
typically asking low USD 20s million and down. Current asking prices range<br />
from US$92.5M for a 2011 model with only ferry hours to US$19.5M for a<br />
1999 model with 10,115 total hours.<br />
• Currently, the average days on market for sale in Q3 2018 keeps going up to<br />
814 days.<br />
SPECS<br />
Max Range<br />
Max Speed<br />
Typ. Passengers<br />
FOR SALE<br />
No. for Sale<br />
Avg Asking Price<br />
Avg Days on Market<br />
SOLD<br />
Past 12 Months<br />
Past 3 Months<br />
6,235 N.M. / 11,547 km (with 9 ACTs)<br />
Mach 0.82<br />
19<br />
2018 Q3 2018 Q2<br />
15(11.1%)<br />
39.3M USD<br />
819<br />
7<br />
1<br />
16 (11.9%)<br />
40.9M USD<br />
775<br />
2018 Q3 2018 Q2<br />
8<br />
1<br />
1+0+00+0+02+0+0+0+0+00+0+03+0+01+0+0 0+0+0 0+0+0 1+0+0 0+0+0<br />
$37.9<br />
16<br />
14<br />
Average Asking Price<br />
For Sale vs. Sold<br />
$33.8<br />
17 18 18 18 18 17 18<br />
$40.9<br />
16 16 15 15<br />
1 2<br />
3<br />
1 1<br />
$39.3<br />
Sep Dec Mar Jun Sep<br />
2017 2018<br />
Sold<br />
For Sale<br />
BOEING<br />
0+15+0 0+16+00+18+00+17+0<br />
0+18+0 0+18+0 0+18+00+17+00+14+00+16+0<br />
0+15+0<br />
BBJ2<br />
• The BBJ2 market is a very limited one with only 22 aircraft in service worldwide<br />
and it is very much concentrated in the Middle East, where more than<br />
50% of the aircraft are in service. Asia only represents 22% of the market - a<br />
mere 5 aircraft.<br />
• Currently there are only 4 BBJ2 for sale, 2 on-market and 2 off-market, same<br />
as last quarter. This represents approximately 18% of the total 22 aircraft in<br />
service.<br />
• There was no transaction completed in this quarter, and there was only 1<br />
transaction happened in the past 12 months.<br />
SPECS<br />
Max Range<br />
Max Speed<br />
Typ. Passengers<br />
FOR SALE<br />
No. for Sale<br />
Avg Asking Price<br />
Avg Days on Market<br />
SOLD<br />
Past 12 Months<br />
Past 3 Months<br />
5,620 N.M. / 10,408 km (with 7 ACTs)<br />
Mach 0.82<br />
19<br />
2018 Q3<br />
4 (18.2%)<br />
58.0M USD<br />
687<br />
2018 Q3<br />
1<br />
0<br />
2018 Q2<br />
4 (17.4%)<br />
59.0M USD<br />
811<br />
2018 Q2<br />
1<br />
1<br />
0+12+0+16+0 0+0+0 0+0+0 0+16+0 0+0+0 0+16+0 0+0+0 0+16+0+0+0 0+20+0+0+0 0+16+0 0+16+0 4+0+0 0+0+0+16+0 0+0+0+16+0<br />
$62.0<br />
3<br />
$69.6<br />
Average Asking Price<br />
For Sale vs. Sold<br />
4 4<br />
$69.0<br />
5<br />
4 4 4 4 4 4 4 4 4<br />
Sep Dec Mar Jun Sep<br />
2017 2018<br />
Sold<br />
For Sale<br />
1<br />
$58.0<br />
Source: JETNET & ASG<br />
THIRD QUARTER 2018 — ASIAN SKY QUARTERLY | 51
MARKET SUMMARY -- JETS<br />
CHALL<strong>EN</strong>GER 604/605<br />
• There were 19 CL604 and 10 CL605 on the market for sale, representing<br />
5.3% and 3,5% of the total fleet, respectively.<br />
• The average asking price of CL604 in Q3 2018 was US$5.2M, a 2% decrease<br />
from Q2 2018. The average asking price of CL605 was US$12.3M, decreasing<br />
by 1% from Q1 2018.<br />
• The average days on market of CL604 and CL605 were, respectively, 313 and<br />
429 days.<br />
• Q3 2018 recorded 12 CL604 transactions. In addition, 14 CL605 transactions<br />
were completed.<br />
BOMBARDIER<br />
$11.0<br />
$5.2<br />
$10.7<br />
$12.7 $12.4 $12.3<br />
CL605<br />
$4.9<br />
CL604<br />
$5.3<br />
$5.2<br />
52 52<br />
51 50 49 49 47<br />
13<br />
7 6 6 7 8 7 8 7 8<br />
3 2<br />
36<br />
39<br />
30 28 28 29<br />
5<br />
8+0+0 13+0+0 7+0+02+0+08+0+0<br />
3+0+07+0+08+0+0<br />
7+0+06+0+06+0+07+0+0<br />
0+29+00+28+00+28+0<br />
0+30+00+39+00+36+0<br />
0+47+00+49+00+52+0<br />
0+50+00+49+00+51+00+52+0<br />
5+0+0<br />
CHALL<strong>EN</strong>GER 850<br />
$7.2<br />
Average Asking Price<br />
SPECS<br />
Max Range<br />
Max Speed<br />
Typ. Passengers<br />
CL604<br />
4,027 N.M. / 7,458 km<br />
Mach 0.82<br />
9<br />
CL605<br />
4,000 N.M. / 7,408 km<br />
Mach 0.82<br />
9<br />
For Sale vs. Sold<br />
Sep Dec Mar Jun Sep<br />
2017 2018<br />
For Sale Sold<br />
FOR SALE<br />
No. for Sale<br />
Avg Asking Price<br />
Avg Days on Market<br />
SOLD<br />
Past 12 Months<br />
Past 3 Months<br />
2018 Q3 2018 Q2<br />
19 (5.3%)<br />
5.2M USD<br />
313<br />
2018 Q3 2018 Q2<br />
41 41<br />
12<br />
19 (5.3%)<br />
5.3M USD<br />
326<br />
9<br />
2018 Q3<br />
10 (3.5%)<br />
12.3M USD<br />
429<br />
2018 Q3<br />
39<br />
14<br />
2018 Q2<br />
11 (3.8%)<br />
12.4M USD<br />
332<br />
2018 Q2<br />
31<br />
8<br />
Average Asking Price<br />
For Sale vs. Sold<br />
9<br />
0+9+0 0+6+0 0+6+0 0+7+0<br />
2+0+0 0+0+0 0+0+0 1+0+0<br />
10<br />
$8.3<br />
$8.6<br />
11 12<br />
10 10<br />
11 11<br />
10 10<br />
0+0+01+0+0<br />
0+0+01+0+0<br />
0+0+0 0+0+0<br />
0+10+0 10+0 11+00+11+00+12+00+11+0<br />
0+10+0 0+10+0 0+10+0<br />
0+0+0<br />
• There were 71 CL850 operating worldwide and 10 were on market for sale,<br />
accounting for 14.1% of the total active fleet.<br />
• The average asking price in Q3 2018 was US$8.6M.<br />
• The average days on market of CL850 in Q3 2018 increased to 233 days, from<br />
221 days in Q2 2018.<br />
• In Q3 2018, 1 CL850 transaction was recorded, which is the same as the<br />
previous quarter.<br />
SPECS<br />
Max Range<br />
Max Speed<br />
Typ. Passengers<br />
FOR SALE<br />
No. for Sale<br />
Avg Asking Price<br />
Avg Days on Market<br />
2,811 N.M. / 5,206 km<br />
Mach 0.80<br />
14<br />
2018 Q3<br />
10 (14.1%)<br />
8.6M USD<br />
233<br />
2018 Q2<br />
11 (15.5%)<br />
8.3M USD<br />
221<br />
7 6<br />
6<br />
2<br />
1 1 1<br />
Sep Dec Mar Jun Sep<br />
2017 2018<br />
Sold<br />
For Sale<br />
SOLD<br />
Past 12 Months<br />
Past 3 Months<br />
2018 Q3<br />
4<br />
1<br />
2018 Q2<br />
4<br />
1<br />
Source: JETNET & ASG<br />
52 | ASIAN SKY QUARTERLY — THIRD QUARTER 2018
MARKET SUMMARY -- JETS<br />
GLOBAL 5000<br />
• There were 17 Global 5000 for sale in Q3 2018, rising from the previous<br />
quarter. With 222 operating worldwide, the for-sale fleet represented 7.7% of<br />
the total active fleet.<br />
• The average asking price in Q3 2018 was US$14.3M, a 7% decrease from Q2<br />
2018.<br />
• The asking prices ranged from US$ 8.5M to US$ 26.0M, which was slightly<br />
lower than the last quarter’s.<br />
• The average days on market was 286 days, up from 269 days in Q2 2018.<br />
• There were 2 Global 5000 transactions in Q3 2018.<br />
SPECS<br />
Max Range<br />
Max Speed<br />
Typ. Passengers<br />
FOR SALE<br />
No. for Sale<br />
Avg Asking Price<br />
Avg Days on Market<br />
SOLD<br />
Past 12 Months<br />
Past 3 Months<br />
5,200 N.M. / 9,630 km<br />
Mach 0.89<br />
13<br />
2018 Q3<br />
17 (7.7%)<br />
14.3M USD<br />
286<br />
2018 Q3<br />
19<br />
2<br />
2018 Q2<br />
14 (6.3%)<br />
15.4M USD<br />
269<br />
2018 Q2<br />
21<br />
7<br />
$19.0<br />
18<br />
1<br />
Average Asking Price<br />
For Sale vs. Sold<br />
1+0+0 1+0+0 3+0+0 1+0+0<br />
$13.9<br />
0+16+0 0+16+0 0+17+0 0+18+0<br />
$15.4<br />
$16.7<br />
$14.3<br />
17 18<br />
16 16<br />
17 17<br />
15 14 13 14 14 14<br />
3 4<br />
1 1 2 1 2 2 1 1 1<br />
0+0+0 1+0+02+0+04+0+0<br />
2+0+01+0+02+0+0<br />
0+17+00+14+0 0+14+00+17+00+13+0<br />
0+14+00+15+00+18+0<br />
1+0+0<br />
BOMBARDIER<br />
Sep Dec Mar Jun Sep<br />
2017 2018<br />
Sold<br />
For Sale<br />
GLOBAL 6000<br />
• There were 10 Global 6000 on the market and 275 in-operation aircraft. It<br />
represented 3.6% of the total active fleet.<br />
• The average asking price of Global 6000 in Q3 2018 was US$38.1M, which<br />
increased by 5% from US$36.3M in Q2 2018.<br />
• The asking prices ranged from US$28.5M to US$48M.<br />
• The average days on market for sale of Global 6000 was 275 days, down from<br />
280 days in Q2 2018.<br />
• In Q3 2018, there was 1 transaction, same as that of Q2 2018.<br />
SPECS<br />
Max Range<br />
Max Speed<br />
Typ. Passengers<br />
FOR SALE<br />
No. for Sale<br />
Avg Asking Price<br />
Avg Days on Market<br />
6,000 N.M. / 11,112 km<br />
Mach 0.88<br />
13<br />
2018 Q3<br />
10 (3.6%)<br />
38.1M USD<br />
275<br />
2018 Q2<br />
14 (5.3%)<br />
36.3M USD<br />
280<br />
$28.5<br />
Average Asking Price<br />
For Sale vs. Sold<br />
$38.0<br />
15 15<br />
0+0+0 0+0+01+0+01+0+04+0+0<br />
0+15+0 0+15+0 0+10+0 0+10+00+9+00+9+0<br />
1+0+0<br />
SOLD<br />
Past 12 Months<br />
Past 3 Months<br />
16<br />
$36.3<br />
$38.1<br />
2018 Q3<br />
5<br />
1<br />
2018 Q2<br />
12<br />
1<br />
12<br />
9 9 10 10 10 11 10<br />
4<br />
1 1 1 1 1<br />
Sep Dec Mar Jun Sep<br />
2017 2018<br />
Sold<br />
For Sale<br />
1+0+0 0+0+0 0+0+01+0+0<br />
0+10+00+11+00+12+0<br />
0+14+00+15+00+16+0<br />
0+0+0<br />
Source: JETNET & ASG<br />
THIRD QUARTER 2018 — ASIAN SKY QUARTERLY | 53<br />
15<br />
14
MARKET SUMMARY -- JETS<br />
FALCON 900DX/EX/EX EASy/LX<br />
Average Asking Price<br />
• There are 23 Falcon 900 series aircraft available on market for sale, including 2<br />
Falcon 900DX, 20 Falcon 900EXs/EASy and 1 Falcon 900LX. The inventory level<br />
remains stable, comparing to that in Q2 2018.<br />
• The average asking prices for Falcon 900EX and 900EX EASy are US$ 7.0M and US$<br />
16.4M; the average asking price for Falcon 900LX is US$ 18.5M, same with that in<br />
the last quarter.<br />
• Currently, the average days-on-market for Falcon 900 series is 309 days, lower than<br />
the data in Q2 2018, maintaining the stable state from last quarter.<br />
• In Q3 2018, there are only 3 Falcon 900 series aircraft transactions.<br />
DASSAULT<br />
0+26+00+23+0+24+0 0+25+0 0+25+0+26+0 0+26+0+23+0 0+24+0 0+24+0 0+24+00+23+0<br />
$21.0<br />
$15.6<br />
$11.5<br />
$6.6<br />
$18.3<br />
For Sale vs. Sold<br />
2+0+0 4+0+0 1+0+0 4+0+0<br />
F900DX<br />
F900EX<br />
$15.7<br />
$16.4<br />
$6.7 $7.0<br />
26 25 26 26 26<br />
23 24 25<br />
24 23 24 24 23<br />
0+0+0 0+0+0 4+0+06+0+03+0+0<br />
0+0+01+0+02+0+0<br />
2+0+0<br />
4<br />
F900LX<br />
$22.2<br />
F900EX EASy<br />
$18.5<br />
$18.5<br />
$12.9 $12.9<br />
SPECS<br />
Max Range<br />
Max Speed<br />
Typ. Passengers<br />
FOR SALE<br />
No. for Sale<br />
Avg Asking Price<br />
Avg Days on Market<br />
F900DX<br />
4,100 N.M. / 4,500 N.M. / 4,500 N.M. / 4,750 N.M. /<br />
7,593 km 8,334 km 8,334 km 8,800 km<br />
Mach 0.83<br />
12<br />
Reporting quarter vs. Previous quarter<br />
Q3 | Q2<br />
2 | 2<br />
12.9M USD |<br />
12.9M USD<br />
153 | 51<br />
F900EX<br />
Mach 0.83<br />
12<br />
Q3 | Q2<br />
10 | 8<br />
7.0M USD |<br />
6.7M USD<br />
336 | 324<br />
F900EX EASy<br />
Mach 0.83<br />
12<br />
Q3 | Q2<br />
10 | 11<br />
16.4M USD |<br />
15.7M USD<br />
391 | 204<br />
F900LX<br />
Mach 0.83<br />
12<br />
Q3 | Q2<br />
1 | 2<br />
18.5M USD |<br />
18.5M USD<br />
250 | 218<br />
6<br />
4 4<br />
1 2 2 3<br />
1<br />
2<br />
Sep Dec Mar Jun Sep<br />
2017 2018<br />
Sold<br />
For Sale<br />
SOLD<br />
Past 12 Months<br />
Past 3 Months<br />
Reporting quarter vs. Previous quarter<br />
Q3 | Q2<br />
1 | 1<br />
0 | 0<br />
Q3 | Q2<br />
14 | 16<br />
1 | 7<br />
Q3 | Q2<br />
5 | 6<br />
1 | 4<br />
Q3 | Q2<br />
5 | 6<br />
0 | 2<br />
FALCON 2000LX/LXS/S<br />
MAKE<br />
OFFER<br />
$19.0<br />
$15.8<br />
$27.9<br />
Average Asking Price<br />
$12.4<br />
For Sale vs. Sold<br />
FALCON 2000LXS<br />
FALCON 2000S<br />
FALCON 2000LX<br />
$25.0<br />
$16.0<br />
$12.8<br />
11 10 10 11 10<br />
8 8<br />
9 9<br />
7 8<br />
4<br />
5<br />
3 2 1 1 1 2 1 1 1 2<br />
$25.0<br />
$16.5<br />
$14.5<br />
Sep Dec Mar Jun Sep<br />
2017 2018<br />
Sold<br />
For Sale<br />
6<br />
2+0+01+0+0<br />
0+0+01+0+01+0+0<br />
0+6+00+5+00+8+0<br />
0+7+00+9+00+9+0<br />
0+0+0<br />
• There are 6 Falcon 2000 series aircraft on market for sale, including 2 Falcon<br />
2000LX, 2 Falcon 2000LXS and 2 Falcon 2000S. The inventory level is stable from<br />
the last quarter.<br />
• The average asking price for Falcon 2000LX is US$ 14.5M; the average asking price<br />
for Falcon 2000LXS is US$ 25M; the average asking price for Falcon 2000S is US$<br />
16.5M.<br />
• The average days on market for Falcon 2000 series aircraft is 169 days in Q3 2018,<br />
quite similar with the situation in the last quarter.<br />
• In Q3 2018, there are 3 transactions of Falcon 2000 series aircraft.<br />
SPECS<br />
Max Range<br />
Max Speed<br />
Typ. Passengers<br />
FOR SALE<br />
No. for sale<br />
Avg Asking Price<br />
Avg Days on Market<br />
SOLD<br />
Past 12 Months<br />
Past 3 Months<br />
2000LX<br />
4,000 N.M. /<br />
Mach 0.83<br />
10<br />
Reporting quarter vs. Previous quarter<br />
Q3 | Q2<br />
2 | 3<br />
14.5M USD |<br />
12.8M USD<br />
213 | 155<br />
Reporting quarter vs. Previous quarter<br />
Q3 | Q2<br />
Q3 | Q2<br />
11 | 17<br />
1 | 1<br />
2000LXS<br />
4,000 N.M. /<br />
Mach 0.83<br />
10<br />
Q3 | Q2<br />
2 | 2<br />
25.0M USD |<br />
25.0M USD<br />
45 | 143<br />
3 | 2<br />
1 | 1<br />
2000S<br />
3,350 N.M. /<br />
7,408 km 7,408 km 6,208 km<br />
Mach 0.83<br />
10<br />
Q3 | Q2<br />
2 | 2<br />
16.5M USD |<br />
16.0M USD<br />
243 | 153<br />
Q3 | Q2<br />
1 | 0<br />
1 | 0<br />
2+0+0 1+0+0 1+0+0 1+0+0 2+0+0 3+0+0<br />
0+10+0 0+11+0 0+10+0 0+8+0 0+8+0 0+10+<br />
Source: JETNET & ASG<br />
54 | ASIAN SKY QUARTERLY — THIRD QUARTER 2018
MARKET SUMMARY -- JETS<br />
FALCON 7X<br />
• There are 22 Falcon 7X aircraft on market for sale. The inventory level has<br />
been increasing from 19 to 25 since the beginning of 2018. Most Falcon 7Xs<br />
available for sale were manufactured in 2012 and 2013, which account for<br />
32% and 23%, respectively.<br />
• The average asking price for 7X in Q3 2018 is around US$ 25.9M, slightly<br />
lower than the price of Q2 2018.<br />
• Currently, the average days-on-market for sale in Q3 2018 is around 255<br />
days, much lower than the level of the last quarter.<br />
• In Q3 2018, there are 6 Falcon 7X transactions, indicating a continuously<br />
active market trend from the beginning of 2018.<br />
SPECS<br />
Max Range<br />
Max Speed<br />
Typ. Passengers<br />
FOR SALE<br />
No. for Sale<br />
Avg Asking Price<br />
Avg Days on Market<br />
5,950 N.M. / 11,018 km<br />
Mach 0.90<br />
12<br />
2018 Q3<br />
22 (7.9%)<br />
25.9M USD<br />
255<br />
2018 Q2<br />
23 (8.4%)<br />
26.9M USD<br />
306<br />
$26.8<br />
$24.9<br />
Average Asking Price<br />
For Sale vs. Sold<br />
24 24 25 25 24 25<br />
2+0+04+0+0<br />
1+0+04+0+02+0+00+0+0<br />
0+22+00+25+00+24+0<br />
0+25+0 0+25+00+24+00+24+0<br />
2+0+0<br />
$26.9<br />
22 23<br />
21 21 21 22<br />
19<br />
2+0+03+0+0<br />
0+0+01+0+03+0+0<br />
0+22+00+21+00+21+0<br />
0+23+00+21+00+19+0<br />
1+0+0<br />
$25.9<br />
DASSAULT<br />
SOLD<br />
Past 12 Months<br />
Past 3 Months<br />
2018 Q3<br />
25<br />
6<br />
2018 Q2<br />
23<br />
4<br />
4 4<br />
2 2 2 3 3<br />
1 1 2 1<br />
Sep Dec Mar Jun Sep<br />
2017 2018<br />
Sold<br />
For Sale<br />
Source: JETNET & ASG<br />
THIRD QUARTER 2018 — ASIAN SKY QUARTERLY | 55
MARKET SUMMARY -- JETS<br />
LINEAGE 1000/E<br />
$28.0<br />
7+0 0+7+0<br />
Average Asking Price<br />
$27.4<br />
For Sale vs. Sold<br />
0+7+0 0+8+0 0+7+0<br />
7+0 0+<br />
0+0+0 0+0+0 0+0+0<br />
0+7+0 0+<br />
$30.7<br />
$30.7<br />
• There were 6 Legacy 650s and 14 Legacy 600s on market for sale. With,<br />
respectively, 96 and 174 aircraft operating worldwide. The for sale fleet represented<br />
6.3% and 8.0%, respectively, of the total active fleet.<br />
• The average asking prices of a Legacy 650 in Q3 was US$12.8M, increasing by<br />
4% from US$12.3M in Q2. The average asking price of a Legacy 600 in Q3 was<br />
US$7.3M, in line with Q2 pricing.<br />
• The asking price of a Legacy 650 ranged from US$9.5M to US$15M, while the<br />
asking price of a Legacy 600 ranged from US$5.2M to US$9.5M.<br />
• The average days on market for sale of a Legacy 650 was 136 days, declining<br />
by 27% from 173 in Q2. The Legacy 600’s average days on market was 470<br />
days, increasing by 23% from 380 in Q2.<br />
• In Q3, there was one Legacy 650 transaction, down from five transactions in<br />
Q2. There were no 600 transactions, down from five in Q2.<br />
SPECS<br />
Max Range<br />
Max Speed<br />
Typ. Passengers<br />
FOR SALE<br />
No. for Sale<br />
Avg Asking Price<br />
Avg Days on Market<br />
Lineage 1000<br />
4,400 N.M. / 8,149 km<br />
Mach 0.82<br />
19<br />
2018 Q3<br />
6 (20.7%)<br />
30.7M USD<br />
623<br />
2018 Q2<br />
4 (20.0%)<br />
30.7M USD<br />
794<br />
Lineage 1000E<br />
4,600 N.M. / 8,520 km<br />
Mach 0.82<br />
19<br />
EMBRAER<br />
7 7<br />
7<br />
7<br />
7 8 7 7<br />
1<br />
Sep Dec Mar Jun Sep<br />
2017 2018<br />
For Sale Sold<br />
4<br />
5<br />
6<br />
6<br />
6<br />
SOLD<br />
Past 12 Months<br />
Past 3 Months<br />
2018 Q3<br />
1<br />
0<br />
2018 Q2<br />
1<br />
0<br />
0+0+0 0+0+0 0+0+0 0+0+0 0+0+0 0+0+0 0+0+0 0+0+0 1+0+0 0+<br />
0+6+0 0+6+0 0+5+00+4+00+7+0<br />
0+6+0<br />
LEGACY 600/650<br />
$13.2<br />
$7.2<br />
30<br />
1<br />
Average Asking Price<br />
For Sale vs. Sold<br />
$11.5<br />
Legacy 650<br />
Legacy 600<br />
24 23 22 22<br />
24<br />
$12.3<br />
20 20 20<br />
15 15<br />
17 17<br />
5<br />
3 5<br />
1<br />
3 4<br />
6<br />
1 1<br />
$12.8<br />
$7.3<br />
$6.8 $7.3<br />
Sep Dec Mar Jun Sep<br />
2017 2018<br />
For Sale Sold<br />
0+0+01+0+0<br />
0+0+06+0+04+0+0<br />
1+0+03+0+01+0+0<br />
0+20+0 0+20+0 0+17+00+15+00+15+0<br />
0+20+00+24+0<br />
0+0+0<br />
• There were 6 Legacy 650 and 14 Legacy 600 on market for sale. With respectively<br />
96 and 174 aircraft operating worldwide, the for-sale fleet represented 6.3% and<br />
8.0% respectively of the total active fleet.<br />
• The average asking prices of Legacy 650 in Q3 2018 was US$12.8M, increasing by<br />
4% from US$12.3M in Q2 2018. The average asking price of Legacy 600 in Q3 2018<br />
was US$ 7.3M, similar to Q2 2018.<br />
• The asking price of Legacy 650 ranged from US$9.5M to US$15.0M; while the<br />
asking price of Legacy 600 ranged from US$ 5.2M to US$ 9.5M.<br />
• The average days on market for sale of Legacy 650 were 136 days, decreasing by<br />
27% from 173 in Q2 2018. Legacy 600’s average days on market for sale was 470<br />
days; increasing by 23% from 380 in Q2 2018<br />
• In Q3 2018, there were one Legacy 650 transactions, down from five transactions in<br />
Q2 2018; there were no transactions of Legacy 600, down from five transactions in<br />
Q1 2018.<br />
SPECS<br />
Max Range<br />
Max Speed<br />
Typ. Passengers<br />
FOR SALE<br />
No. for Sale<br />
Avg Asking Price<br />
Avg Days on Market<br />
SOLD<br />
Past 12 Months<br />
Past 3 Months<br />
Legacy 600<br />
3,400 N.M. / 6,297 km<br />
Mach 0.80<br />
13<br />
2018 Q3 2018 Q2<br />
14 (8.0%)<br />
7.3M USD<br />
470<br />
2018 Q3 2018 Q2<br />
15<br />
1<br />
14 (8.0%)<br />
7.3M USD<br />
380<br />
17<br />
5<br />
Legacy 650<br />
3,640 N.M. / 7,112 km<br />
Mach 0.80<br />
13<br />
2018 Q3<br />
6 (6.3%)<br />
12.8M USD 12.3M USD<br />
136<br />
2018 Q3<br />
8<br />
0<br />
2018 Q2<br />
3 (3.1%)<br />
173<br />
2018 Q2<br />
8<br />
5<br />
0+22+0+22+0 0+23+0 0+24+0 0+30+0<br />
5+0+0 3+0+0 1+0+0 1+0+0<br />
Source: JETNET & ASG<br />
56 | ASIAN SKY QUARTERLY — THIRD QUARTER 2018
MARKET SUMMARY -- JETS<br />
G200 & G280<br />
• There were 21 G200/G280 aircraft on market in Q3 2018. The inventory level has<br />
decreased by 30% since Q2 2018. There has been an increase of 1.8% in the total<br />
number of aircraft in operation, from 244 G200 and 135 G280 in Q2 2018 to 246 G200<br />
and 140 G280 in Q3 2018.<br />
• The average asking prices for a G200 and G280 aircraft in Q3 2018 was around<br />
US$4.5M and US$17M respectively.<br />
• The average days on market for a G200 and G280 in Q3 2018 was 362 and 50 days<br />
respectively. This was an increase of 7% from 338 days for G200 and a decrease of<br />
77% from 216 days for G280 in Q2 2018.<br />
• There was only one G280 aircraft for sale on market in Q2 2018. This aircraft was<br />
moved to off-market in Q3 and the quarter saw two new aircraft being put on market<br />
for sale, thus drastically reducing the average days on market for the aircraft listed.<br />
• There were 12 G200 sold transactions in Q3 2018. This was an increase of 9% from<br />
the 11 G200 sold transactions in Q2 2018. There were no G280 sold transactions in<br />
Q3 2018 as compared to the two G280 sold transactions in Q2 2018.<br />
SPECS<br />
Max Range<br />
Max Speed<br />
Typ. Passengers<br />
FOR SALE<br />
No. for Sale<br />
Avg Asking Price<br />
Avg Days on Market<br />
SOLD<br />
Past 12 Months<br />
Past 3 Months<br />
G200<br />
3,050 N.M. / 5,651km<br />
Mach 0.81<br />
8<br />
2018 Q3 2018 Q2<br />
19 (7.7%)<br />
4.5M USD<br />
362<br />
2018 Q3 2018 Q2<br />
41 40<br />
12<br />
29 (11.9%)<br />
4.3M USD<br />
338<br />
11<br />
G280<br />
3,600 N.M. / 6,667 km<br />
Mach 0.84<br />
8<br />
2018 Q3<br />
2 (1.4%)<br />
17.0M USD 16.8M USD<br />
50<br />
2018 Q3<br />
4<br />
0<br />
2018 Q2<br />
1 (0.7%)<br />
216<br />
2018 Q2<br />
5<br />
2<br />
$16.0<br />
$5.2<br />
G280<br />
G200<br />
$12.5<br />
$16.8<br />
$18.3<br />
$17.0<br />
$4.3<br />
$4.1 $4.5<br />
40<br />
38<br />
34 33 34<br />
32 32<br />
29 30 30<br />
3<br />
Average Asking Price<br />
For Sale vs. Sold<br />
21 22 21<br />
6 6<br />
6<br />
4 4 4<br />
2<br />
3 3<br />
1 1<br />
Sep Dec Mar Jun Sep<br />
2017 2018<br />
Sold<br />
For Sale<br />
5<br />
4+0+03+0+0<br />
6+0+03+0+04+0+0<br />
6+0+01+0+06+0+0<br />
0+21+00+22+00+21+0<br />
0+30+00+32+00+32+0<br />
0+34+00+40+00+33+0<br />
5+0+0<br />
G450<br />
• There were 22 G450s on market in Q3 2018. The inventory level has<br />
decreased by 11% since Q2 2018.<br />
• The total number of aircraft in operation has remained constant at 354.<br />
• The average asking price for a G450 in Q3 2018 was around US$ 14M.<br />
• The average days on market for a G450 has decreased to 309 days in Q3 2018<br />
from 328 days in Q2 2018, a decrease of around 6%.<br />
• There were eight G450 sold transactions in Q3 2018. This was a decrease of<br />
11% from the nine G450 sold transactions in Q2 2018.<br />
2+0+04+0+03+0+0<br />
0+34+00+38+00+30+00+29+0<br />
1+0+0<br />
GULFSTREAM<br />
SPECS<br />
Max Range<br />
Max Speed<br />
Typ. Passengers<br />
FOR SALE<br />
No. for Sale<br />
Avg Asking Price<br />
Avg Days on Market<br />
4,350 N.M. / 8,056 km<br />
Mach 0.85<br />
13<br />
2018 Q3 2018 Q2<br />
22 (6.2%)<br />
14.0M USD 14.0M USD<br />
309<br />
26 (7.3%)<br />
328<br />
21 21<br />
2+0+03+0+0<br />
0+22+00+23+00+23+0<br />
3+0+0<br />
SOLD<br />
Past 12 Months<br />
Past 3 Months<br />
2018 Q3 2018 Q2<br />
31<br />
8<br />
35<br />
9<br />
$14.1<br />
32<br />
29<br />
Average Asking Price<br />
27<br />
$13.8<br />
For Sale vs. Sold<br />
24<br />
27<br />
2+0+0 3+0+01+0+02+0+06+0+0<br />
0+21+0 0+21+00+28+0<br />
0+24+00+27+00+29+00+32+0<br />
2+0+0<br />
21 21<br />
26<br />
23 23 22<br />
6<br />
$15.2<br />
$14.0 $14.0<br />
4<br />
2 3<br />
1 2 2 2 3 2 3 2 3<br />
Sep Dec Mar Jun Sep<br />
2017 2018<br />
Sold<br />
For Sale<br />
3+0+04+0+0<br />
0+26+00+21+00+21+0<br />
2+0+0<br />
Source: JETNET & ASG<br />
THIRD QUARTER 2018 — ASIAN SKY QUARTERLY | 57
MARKET SUMMARY -- JETS<br />
G550<br />
$23.6<br />
31<br />
5<br />
$22.8<br />
For Sale vs. Sold<br />
28<br />
Average Asking Price<br />
24<br />
$25.0<br />
Sep Dec Mar Jun Sep<br />
2017 2018<br />
Sold<br />
For Sale<br />
29<br />
24 24 24<br />
22 21<br />
19<br />
17<br />
$28<br />
5 5 4 4 4<br />
2 2 3 2 2 5<br />
1<br />
27<br />
26<br />
• There were 26 G550s on market in Q3 2018. The inventory level has decreased<br />
by 10% since Q2 2018.<br />
• There has been an increase of 1% in the total number of aircraft in operation,<br />
from 552 in Q2 2018 to 556 in Q3 2018.<br />
• The average age of the aircraft for sale on the market was six years in Q3<br />
2018. This represented a younger market as compared to Q2 2018 which had<br />
an average age of eight years.<br />
• The average asking price for a G550 in Q3 2018 was around US$28M - an<br />
increase of 20% from US$23.3M since Q2 2018. The dramatic increase in the<br />
prices could be attributed to the fact that the average age of the aircraft for<br />
sale on the market has been gradually decreasing since the end of Q2 2018,<br />
with younger models entering the market.<br />
• The average days on market for a G550 has decreased to 165 days in Q3 2018<br />
from 178 days in Q2 2018, a decrease of around 7%.<br />
• There were eight G550 sold transactions in Q3 2018. This was a decrease of<br />
11% from the nine G550 sold transactions in Q2 2018.<br />
SPECS<br />
Max Range<br />
Max Speed<br />
Typ. Passengers<br />
FOR SALE<br />
No. for Sale<br />
Avg Asking Price<br />
Avg Days on Market<br />
SOLD<br />
Past 12 Months<br />
Past 3 Months<br />
6,750 N.M. / 12,501 km<br />
Mach 0.87<br />
18<br />
2018 Q3 2018 Q2<br />
26 (5.3%)<br />
28M USD<br />
165<br />
2018 Q3 2018 Q2<br />
39<br />
8<br />
29 (5.3%)<br />
25.0M USD<br />
178<br />
41<br />
9<br />
GULFSTREAM<br />
G650 & G650 ER<br />
$58.5<br />
$57.3<br />
0+24+0 0+24+0 0+28+0 0+31+0<br />
Average Asking Price<br />
$65.8<br />
For Sale vs. Sold<br />
4+0+0 5+0+0 5+0+0 5+0+0<br />
5+0+0 2+0+04+0+03+0+0<br />
4+0+02+0+02+0+0<br />
0+26+00+27+00+24+0<br />
0+29+00+24+00+21+0<br />
0+19+00+17+00+22+0<br />
1+0+0<br />
0+17+0 0+18+0 0+16+0 0+16+0<br />
1+0+0 4+0+0 0+0+0 0+0+0<br />
$58.3<br />
$62.4<br />
$56.2<br />
$53.4<br />
$56.0<br />
$55.1<br />
20<br />
18<br />
16 16 17<br />
15 16 16<br />
15<br />
12 12 13<br />
11<br />
3+0+0 2+0+0 2+0+00+0+0<br />
3+0+02+0+02+0+0<br />
0+15+00+11+00+13+0<br />
0+16+00+20+00+16+0<br />
0+12+0 0+12+00+15+0<br />
2+0+0<br />
• There were 15 G650/650ER aircraft on market in Q3 2018. The inventory level<br />
has decreased by 6.2% since Q2 2018.<br />
• There has been an increase of 3.6% in the total number of aircraft in operation,<br />
from 201 G650 and 98 G650ER in Q2 2018 to 205 G650 and 102 G650ER<br />
in Q3 2018.<br />
• The average asking prices for a G650 and G650ER aircraft was around<br />
US$55.1M and US$56M respectively.<br />
• The average days on market for a G650 and G650ER in Q3 2018 was 236 and<br />
126 days respectively. This is a decrease of 33% from 354 days for G650 and<br />
an increase of 30% from 97 days for G650ER in Q2 2018.<br />
• There were four G650 and three G650ER sold transactions in Q3 2018. With a<br />
total of seven G650/G650ER sold transactions, the pre-owned market saw an<br />
increase in sales activity by 75% as compared to Q2 2018, which had only four<br />
G650/650ER sold transactions.<br />
SPECS<br />
Max Range<br />
Max Speed<br />
Typ. Passengers<br />
FOR SALE<br />
No. for Sale<br />
Avg Asking Price<br />
Avg Days on Market<br />
G650<br />
7,000 N.M. / 12,964 km<br />
Mach 0.90<br />
18<br />
2018 Q3 2018 Q2<br />
9 (4.4%)<br />
55.1M USD 56.2M USD<br />
236<br />
8 (4.0%)<br />
354<br />
G650ER<br />
7,500 N.M. / 13,890 km<br />
Mach 0.90<br />
18<br />
2018 Q3<br />
6 (5.9%)<br />
56.0M USD<br />
126<br />
2018 Q2<br />
8 (8.2%)<br />
62.4M USD<br />
97<br />
4<br />
1<br />
2 2 3 2 2 2 3 2<br />
Sep Dec Mar Jun Sep<br />
2017 2018<br />
Sold<br />
For Sale<br />
SOLD<br />
Past 12 Months<br />
Past 3 Months<br />
2018 Q3 2018 Q2<br />
17<br />
4<br />
15<br />
4<br />
2018 Q3<br />
6<br />
3<br />
2018 Q2<br />
3<br />
0<br />
Source: JETNET & ASG<br />
58 | ASIAN SKY QUARTERLY — THIRD QUARTER 2018
CIVIL HELICOPTERS<br />
Aircraft Acquisition Price vs Maximum Range<br />
8.00<br />
HEAVY<br />
(SUPER) MEDIUM<br />
LIGHT TWIN<br />
SINGLE TURBINE<br />
PISTON<br />
AC313*<br />
S-92<br />
H225<br />
AS332 L1E<br />
4.00<br />
AW189<br />
H175<br />
BELL 412EPI<br />
AW139<br />
S-76C++<br />
S-76D<br />
H155<br />
AC312*<br />
MD 520N<br />
MD 530F<br />
H145<br />
MD 902<br />
H135(T3)<br />
H130<br />
BELL 407<br />
BELL 206L4<br />
MD 500E<br />
BELL 430<br />
AW169<br />
BELL 429<br />
H135(P3)<br />
BELL 407GXP<br />
H125<br />
AC311*<br />
H120<br />
MD 600N<br />
EC145<br />
AW 109 GN<br />
AW109 POWER<br />
AW119KX<br />
2.00<br />
1.00<br />
AIRCRAFT ACQUISTION PRICE (MILLION USD)<br />
S-333<br />
0.50<br />
0.25<br />
200<br />
250<br />
300<br />
350<br />
400<br />
450<br />
500<br />
550<br />
600<br />
650<br />
700<br />
750<br />
<strong>EN</strong>480B<br />
R66<br />
R44 RAV<strong>EN</strong> II<br />
R22 BETA II<br />
MAX RANGE (N.M.)<br />
* The estimated total yearly cost is based on aircraft ownership cost for 10 years including financing, plus yearly operating cost and regional adjustments.<br />
Source: JETNET & ASG<br />
THIRD QUARTER 2018 — ASIAN SKY QUARTERLY | 59
SUMMARY -- HELICOPTERS<br />
MARKET SUMMARY PER MODEL — CIVIL HELICOPTERS<br />
INV<strong>EN</strong>TORY LEVEL, PRICE TR<strong>EN</strong>D & TRANSACTIONS<br />
EC135T2 & P2<br />
$2.7<br />
$1.8<br />
11<br />
Average Asking Price<br />
EC135P2<br />
EC135T2<br />
For Sale vs. Sold<br />
$3.1<br />
$2.5<br />
$2.4<br />
$2.5<br />
17 18 18 18<br />
14 14 14 15 15<br />
14 14 14<br />
1 1 2 2<br />
Sep Dec Mar Jun Sep<br />
$2.4<br />
2017 2018<br />
Sold<br />
For Sale<br />
EC135T2<br />
• There were six EC135T2 on market in Q3 2018. The inventory level has not<br />
changed since Q2 2018. The inventory accounted for 4.2% of the overall fleet<br />
in operation. There were three sold transactions in Q3 2018 as compared to<br />
only one in Q2 2018. The average days on market increased by 15.1% - from<br />
610 days in Q2 2018 to 702 days in Q3 2018. The average asking price has not<br />
changed since Q2 2018 and has remained at US$2.4M in Q3 2018.<br />
2+0+0 2+0+0 0+0+0 0+0+01+0+01+0+00+0+00+0+00+0+00+0<br />
0+14+0 0+14+0 0+14+0 0+18+0 0+18+0 0+18+0 0+17+00+15+00+15+0<br />
0+0+0<br />
EC135P2<br />
• There were eight EC135P2 on market in Q3 2018. The inventory level has<br />
decreased by 33.3% since Q2 2018. The inventory accounted for 5.2% of<br />
the overall fleet in operation. There was one sold transaction in Q3 2018 as<br />
compared to zero in Q2 2018. The average days on market increased by 22.5%<br />
- from 907 days in Q2 2018 to 1,111 days in Q3 2018. The average asking price<br />
has not changed since Q2 2018 and has remained at US$2.5M in Q3 2018.<br />
SPECS<br />
Max Range<br />
Max Speed<br />
Typ. Passengers<br />
FOR SALE<br />
No. for Sale<br />
Avg Asking Price<br />
Avg Days on Market<br />
SOLD<br />
Past 12 Months<br />
Past 3 Months<br />
EC135T2<br />
332 N.M. / 614 km<br />
127 Knots<br />
6<br />
2018 Q3 2018 Q2<br />
6 (4.2%)<br />
2.4M USD<br />
702<br />
2018 Q3 2018 Q2<br />
5<br />
3<br />
6 (4.2%)<br />
2.4M USD<br />
610<br />
2<br />
1<br />
EC135P2<br />
332 N.M. / 614 km<br />
127 Knots<br />
6<br />
2018 Q3<br />
8 (5.2%)<br />
2.5M USD<br />
1111<br />
2018 Q3<br />
1<br />
1<br />
2018 Q2<br />
12 (7.2%)<br />
2.5M USD<br />
907<br />
2018 Q2<br />
0<br />
0<br />
0+14+0 0+14+0 0+14+0 0+11+0<br />
AIRBUS<br />
AS332L1 & H225<br />
$22.4<br />
$8.5<br />
16<br />
Average Asking Price<br />
H225<br />
AS332L1<br />
For Sale vs. Sold<br />
$11.6<br />
$4.0<br />
$8.8<br />
$4.0<br />
18 18 18 19 20<br />
18 18 18 18 18 18 18<br />
1 1 1<br />
Sep Dec Mar Jun Sep<br />
2017 2018<br />
Sold<br />
For Sale<br />
0+0+01+0+0<br />
0+0+0 0+0+01+0+00+0+00+0+00+0+00+0<br />
0+18+0 0+18+00+20+0<br />
0+18+0 0+18+00+19+00+18+0<br />
1+0+0<br />
AS332L1<br />
• There were two AS332L1 on market in Q3 2018. The inventory level has<br />
decreased by 33.3% since Q2 2018. The inventory accounted for 3% of the<br />
overall 67 fleet in operation. There was one sold transaction in Q3 2018 as<br />
compared to zero in Q2 2018. The average days on market increased by 22.1%<br />
- from 1,103 days in Q2 2018 to 1,347 days in Q3 2018. The average asking<br />
price has not changed since Q2 2018 and has remained at US$4M in Q3 2018.<br />
H225<br />
• There were 16 H225 on market in Q3 2018. The inventory level has increased<br />
by 6.7% since Q2 2018. The inventory accounted for 9.5% of the overall fleet<br />
in operation. There was one sold transaction in Q3 2018 as compared to zero<br />
in Q2 2018. The average days on market increased by 9.4% - from 520 days<br />
in Q2 2018 to 569 days in Q3 2018. The average asking price has reduced to<br />
US$8.8M in Q3 2018 from US$11.6M in Q2 2018.<br />
SPECS<br />
Max Range<br />
Max Speed<br />
Typ. Passengers<br />
FOR SALE<br />
No. for Sale<br />
Avg Asking Price<br />
Avg Days on Market<br />
SOLD<br />
Past 12 Months<br />
Past 3 Months<br />
AS332L1<br />
452 N.M. / 837 km<br />
142 Knots<br />
19<br />
2018 Q3 2018 Q2<br />
2 (4.5%)<br />
4.0M USD<br />
1347<br />
2018 Q3 2018 Q2<br />
1 0<br />
1<br />
3 (4.5%)<br />
4.0M USD<br />
1103<br />
0<br />
H225<br />
452 N.M. / 837 km<br />
142 Knots<br />
19<br />
2018 Q3<br />
16 (8.9%)<br />
8.8M USD<br />
569<br />
2018 Q3<br />
2<br />
1<br />
2018 Q2<br />
15 (8.9%)<br />
19.0M USD<br />
520<br />
2018 Q2<br />
1<br />
0<br />
0+18+0 0+18+0 0+18+0 0+16+0<br />
Source: JETNET & ASG<br />
60 | ASIAN SKY QUARTERLY — THIRD QUARTER 2018
MARKET SUMMARY -- HELICOPTERS<br />
EC145<br />
• There were 11 EC145 on market in Q3 2018. The inventory level has<br />
increased by 37.5% since Q2 2018.<br />
• The inventory accounted for 1.2% of the overall fleet in operation.<br />
• The average days on market increased by 0.8% - from 249 days in Q2 2018<br />
to 251 days in Q3 2018. The slow increase in the average days on market can<br />
be attributed to the three aircraft that were added for sale into the market in<br />
Q3 2018.<br />
• The average asking price has decreased to US$3.6M in Q3 2018 from<br />
US$3.7M in Q2 2018.<br />
SPECS<br />
Max Range<br />
Max Speed<br />
Typ. Passengers<br />
FOR SALE<br />
No. for Sale<br />
Avg Asking Price<br />
Avg Days on Market<br />
SOLD<br />
Past 12 Months<br />
Past 3 Months<br />
461 N.M. / 855 km<br />
131 Knots<br />
9<br />
2018 Q3<br />
11 (1.2%)<br />
3.6M USD<br />
251<br />
2018 Q3<br />
4<br />
0<br />
2018 Q2<br />
8 (1.0%)<br />
3.7M USD<br />
249<br />
2018 Q2<br />
7<br />
4<br />
$5.4<br />
Average Asking Price<br />
For Sale vs. Sold<br />
9 9 9 9<br />
$3.8<br />
$3.6<br />
8 9 10 10<br />
11<br />
8 8 8 8<br />
1 2 2<br />
Sep Dec Mar Jun Sep<br />
2017 2018<br />
Sold<br />
For Sale<br />
0+0+0 0+0+0 2+0+00+0+02+0+0<br />
1+0+00+0+0 0+0+0 0+0+0 0+0+0 0+0+0<br />
0+11+00+8+0 0+8+00+10+00+10+0<br />
0+8+00+9+00+8+0<br />
0+9+0 0+9+0 0+9+0 0+9+0<br />
0+0+0<br />
EC155B & H155<br />
EC155B<br />
• There were 7 EC155B on market in Q3 2018. The inventory level has<br />
decreased by 12.5% since Q2 2018. The inventory accounted for 25% of the<br />
overall fleet in operation. There were no sold transactions in Q3 2018 as<br />
compared to one in Q2 2018. The average days on market decreased by 5.2%<br />
- from 1,062 days in Q2 2018 to 1,007 days in Q3 2018. The average asking<br />
price has not changed since Q2 2018 and has remained at US$2M in Q3<br />
2018.<br />
AIRBUS<br />
H155<br />
• There were 10 H225 on market in Q3 2018. The inventory level has decreased<br />
by 23.1% since Q2 2018. The inventory accounted for 6.8% of the overall fleet<br />
in operation. There were two sold transactions in Q3 2018 as compared to<br />
three in Q2 2018. The average days on market increased by 13.8% - from<br />
756 days in Q2 2018 to 860 days in Q3 2018. The average asking price has<br />
increased to US$5.6M in Q3 2018 from US$5.2M in Q2 2018.<br />
SPECS<br />
Max Range<br />
Max Speed<br />
Typ. Passengers<br />
FOR SALE<br />
No. for Sale<br />
Avg Asking Price<br />
Avg Days on Market<br />
EC155B<br />
516 N.M. / 955 km<br />
135 Knots<br />
13<br />
2018 Q3 2018 Q2<br />
7 (25.0%)<br />
2.0M USD<br />
1007<br />
8 (28.6%)<br />
2.0M USD<br />
1062<br />
H155<br />
516 N.M. / 955 km<br />
150 Knots<br />
13<br />
2018 Q3<br />
10 (6.8%)<br />
5.6M USD<br />
860<br />
2018 Q2<br />
13 (8.9%)<br />
5.2M USD<br />
756<br />
$4.6<br />
$3.3<br />
Average Asking Price<br />
For Sale vs. Sold<br />
H155<br />
EC155B<br />
$5.2<br />
$2.0<br />
24<br />
22 23 22 21 22<br />
20 20 21<br />
19<br />
20<br />
1+0+0 2+0+01+0+01+0+00+0+00+0+00+0+00+0+01+0+00+0+00+0+0<br />
0+17+00+18+00+20+0<br />
0+21+00+22+00+21+0<br />
0+20+00+22+00+23+0<br />
0+24+00+19+00+20+00+22+0<br />
0+0+0<br />
$5.6<br />
$2.0<br />
18 17<br />
SOLD<br />
Past 12 Months<br />
Past 3 Months<br />
2018 Q3 2018 Q2<br />
1<br />
0<br />
1<br />
1<br />
2018 Q3<br />
6<br />
2<br />
2018 Q2<br />
4<br />
3<br />
1 1 1 2 1 1<br />
Sep Dec Mar Jun Sep<br />
2017 2018<br />
Sold<br />
For Sale<br />
Source: JETNET & ASG<br />
THIRD QUARTER 2018 — ASIAN SKY QUARTERLY | 61
MARKET SUMMARY -- HELICOPTERS<br />
BELL 412EP/412HP<br />
$5.2<br />
$3.0<br />
Average Asking Price<br />
BELL 412EP<br />
BELL 412HP<br />
$4.0 $4.2<br />
$2.8 $3.0<br />
For Sale vs. Sold<br />
36 37 38 37<br />
35 35 35<br />
33 33 33 32<br />
30<br />
6<br />
3<br />
4<br />
1 2 1 2 3 3<br />
1 1 1<br />
Sep Dec Mar Jun Sep<br />
2017 2018<br />
Sold<br />
For Sale<br />
39<br />
1+0+03+0+02+0+00<br />
4+0+01+0+0<br />
0+39+00+37+00+38+0<br />
0+35+00+30+00+35+0<br />
0+32+00+33+00+33+0<br />
1+0+0<br />
2+0+0 6+0+0 1+0+0 3+0+0<br />
Bell 412EP<br />
• There were 34 Bell 412EP on market in Q3 2018. The inventory level has<br />
increased by 9.7% since Q2 2018. The inventory accounted for 6.2% of the<br />
overall fleet in operation. There were five sold transactions in Q3 2018 as<br />
compared to six in Q2 2018. The average days on market increased by 7.9%<br />
- from 509 days in Q2 2018 to 549 days in Q3 2018. The average asking price<br />
has increased to US$4.2M in Q3 2018 from US$4M in Q2 2018.<br />
Bell 412HP<br />
• There were 61 Bell 412HP on market in Q3 2018. The inventory level has not<br />
changed since Q2 2018. The inventory accounted for 8.2% of the overall fleet<br />
in operation. The pre-owned market activity has been stagnant with no sold<br />
transactions in both Q3 and Q2 2018. The average days on market increased<br />
by 16% - from 239 days in Q2 2018 to 206 days in Q3 2018. The average asking<br />
price has increased to US$3M in Q3 2018 from US$2.8M in Q2 2018.<br />
SPECS<br />
Max Range<br />
Max Speed<br />
Typ. Passengers<br />
FOR SALE<br />
No. for Sale<br />
Avg Asking Price<br />
Avg Days on Market<br />
SOLD<br />
Past 12 Months<br />
Past 3 Months<br />
Bell 412EP<br />
356 N.M. / 659 km<br />
140 Knots<br />
9<br />
2018 Q3 2018 Q2<br />
34 (6.2%)<br />
4.2M USD<br />
549<br />
2018 Q3 2018 Q2<br />
23 20<br />
4<br />
31 (5.6%)<br />
4.0M USD<br />
509<br />
6<br />
Bell 412HP<br />
349 N.M. / 646 km<br />
133 Knots<br />
14<br />
2018 Q3<br />
5 (8.2%)<br />
3.0M USD<br />
239<br />
2018 Q3<br />
2<br />
0<br />
2018 Q2<br />
4 (6.6%)<br />
2.8M USD<br />
206<br />
2018 Q2<br />
3<br />
0<br />
0+33+0 0+35+0 0+37+0 0+36+0<br />
BELL 429<br />
• There were 15 Bell 429 on market in Q3 2018. The inventory level has<br />
decreased by 21.1% since Q2 2018.<br />
• The inventory accounted for 4.7% of the overall fleet in operation.<br />
• There were four sold transactions in Q3 2018 as compared to zero in Q2 2018-<br />
showing a more active pre-owned market in Q3.<br />
• The average days on market increased by 18.6% - from 370 days in Q2 2018<br />
to 439 days in Q3 2018.<br />
• The average asking price has decreased to US$5.5M in Q3 2018 from<br />
US$5.7M in Q2 2018.<br />
BELL<br />
$5.4<br />
Average Asking Price<br />
$5.3<br />
For Sale vs. Sold<br />
0+17+0 0+17+0 0+17+0 0+15+0<br />
0+0+0 0+0+0 0+0+0 1+0+0<br />
$5.7<br />
16 16 17 17 17<br />
15 15<br />
16 15 16<br />
3+0+01+0+0<br />
0+19+0 0+19+0 0+19+0 0+16+00+15+00+16+0<br />
0+0+0<br />
0+0+0 0+0+0 0+0+0<br />
$5.5<br />
19 19 19<br />
0+15+0 0+15+0 0+17+0<br />
0+0+0 2+0+0 2+0+0<br />
SPECS<br />
Max Range<br />
Max Speed<br />
Typ. Passengers<br />
FOR SALE<br />
No. for Sale<br />
Avg Asking Price<br />
Avg Days on Market<br />
368 N.M. / 681 km<br />
130 Knots<br />
7<br />
2018 Q3<br />
15 (4.7%)<br />
5.5M USD<br />
439<br />
2018 Q2<br />
19 (6.1%)<br />
5.7M USD<br />
370<br />
1 1 1<br />
Sep Dec Mar Jun Sep<br />
2017 2018<br />
Sold<br />
For Sale<br />
3<br />
SOLD<br />
Past 12 Months<br />
Past 3 Months<br />
2018 Q3<br />
8<br />
0<br />
2018 Q2<br />
6<br />
0<br />
Source: JETNET & ASG<br />
62 | ASIAN SKY QUARTERLY — THIRD QUARTER 2018
MARKET SUMMARY -- HELICOPTERS<br />
A109E POWER/A109SP GRANDNEW<br />
A109E Power<br />
• There were 50 A109E Power on market in Q3 2018. The inventory level has<br />
decreased by 10.7% since Q2 2018. The inventory accounted for 13.4% of the<br />
overall fleet in operation. There were three sold transactions in Q3 2018 as<br />
compared to seven in Q2 2018. The 57.1% decrease in market activity may be<br />
interpreted a slowing pre-owned market for AE109E Power. The average days<br />
on market increased by 12.8% - from 619 days in Q2 2018 to 698 days in Q3<br />
2018. The average asking price has decreased to US$1.7M in Q3 2018 from<br />
US$1.8M in Q2 2018.<br />
A109SP Grandnew<br />
• There were 8 A109SP Grandnew on market in Q3 2018. The inventory level<br />
has not changed since Q2 2018. The inventory accounted for 5.1% of the<br />
overall fleet in operation. There were four sold transactions in Q3 2018 as<br />
compared to six in Q2 2018. The average days on market increased by 14.8%<br />
- from 183 days in Q2 2018 to 210 days in Q3 2018. The average asking price<br />
has increased to US$4.6M in Q3 2018 from US$3.8M in Q2 2018.<br />
$4.5<br />
Average Asking Price<br />
A109SP GRANDNEW<br />
$3.8<br />
$4.6<br />
SPECS<br />
Max Range<br />
Max Speed<br />
Typ. Passengers<br />
FOR SALE<br />
No. for Sale<br />
Avg Asking Price<br />
Avg Days on Market<br />
A109E Power<br />
353 N.M. / 654 km<br />
139 Knots<br />
7<br />
2018 Q3 2018 Q2<br />
50 (13.4%)<br />
1.7M USD<br />
698<br />
56 (16.0%)<br />
1.8M USD<br />
619<br />
A109SP Grandnew<br />
480 N.M. / 889 km<br />
130 Knots<br />
7<br />
2018 Q3<br />
8 (5.1%)<br />
4.6M USD<br />
210<br />
2018 Q2<br />
8 (5.1%)<br />
3.8M USD<br />
183<br />
$1.9 $1.8 $1.7<br />
A109E Power<br />
67<br />
For Sale vs. Sold<br />
70 71 69<br />
69<br />
65<br />
63 63 64<br />
62 62 60 58<br />
1+0+0 2+0+05+0+06+0+0<br />
5+0+03+0+01+0+0<br />
3+0+01+0+00+0+02+0+0<br />
0+58+00+60+00+62+0<br />
0+64+00+63+00+62+0<br />
0+63+00+65+00+69+00+69+00+71+00+70+00+67+0<br />
4+0+0<br />
SOLD<br />
Past 12 Months<br />
Past 3 Months<br />
2018 Q3 2018 Q2<br />
11 9<br />
3<br />
7<br />
2018 Q3<br />
22<br />
4<br />
2018 Q2<br />
24<br />
6<br />
2<br />
1 3 1 3 5 6 5<br />
2 2 1<br />
4<br />
Sep Dec Mar Jun Sep<br />
2017 2018<br />
For Sale Sold<br />
AW139<br />
• There were 25 AW139 on market in Q3 2018. The inventory level has<br />
decreased by 10.7% since Q2 2018.<br />
• The inventory accounted for 2.9% of the overall fleet in operation.<br />
• There were two sold transactions in Q3 2018 as compared to zero in Q2 2018.<br />
• The average days on market increased by 0.6% - from 478 days in Q2 2018<br />
to 481 days in Q3 2018. The slow increase in the average days on market can<br />
be attributed to the two aircraft that were added and four that were removed<br />
from market in Q3 2018.<br />
• The average asking price has increased to US$7.9M in Q3 2018 from<br />
US$7.3M in Q2 2018.<br />
SPECS<br />
Max Range<br />
Max Speed<br />
Typ. Passengers<br />
FOR SALE<br />
No. for Sale<br />
Avg Asking Price<br />
Avg Days on Market<br />
568 N.M. / 1,052 km<br />
140 Knots<br />
15<br />
2018 Q3<br />
25 (2.9%)<br />
7.9M USD<br />
481<br />
2018 Q2<br />
28 (3.3%)<br />
7.3M USD<br />
478<br />
$8.3<br />
Average Asking Price<br />
$7.3<br />
$7.9<br />
For Sale vs. Sold<br />
26<br />
29<br />
28 27 28<br />
24 25 24 23 24<br />
26 26 25<br />
0+0+02+0+0<br />
0+0+0 0+0+0 0+0+0 1+0+00+0+00+0+00+0+0<br />
0+25+00+26+00+26+0<br />
0+28+00+27+00+28+0<br />
0+29+00+24+00+23+0<br />
0+24+00+25+00+24+00+26+0<br />
0+0+0<br />
LEONARDO<br />
SOLD<br />
Past 12 Months<br />
Past 3 Months<br />
2018 Q3<br />
4<br />
2<br />
2018 Q2<br />
2<br />
0<br />
1<br />
1 2<br />
Sep Dec Mar Jun Sep<br />
2017 2018<br />
Sold<br />
For Sale<br />
Source: JETNET & ASG<br />
THIRD FIRST QUARTER 2018 — ASIAN SKY QUARTERLY | 63
MARKET SUMMARY -- HELICOPTERS<br />
S-76C+ / S-76C++<br />
$7.3<br />
$3.9<br />
53<br />
Average Asking Price<br />
$4.9<br />
S-76C++<br />
S-76C+<br />
For Sale vs. Sold<br />
56 55 56<br />
52 54 53 54 55<br />
$6.2<br />
49<br />
47 47 46<br />
$5.4<br />
$2.0<br />
5<br />
1 2<br />
2<br />
1 1<br />
Sep Dec Mar Jun Sep<br />
2017 2018<br />
For Sale Sold<br />
0+0+01+0+0<br />
0+0+0 0+0+02+0+05+0+0<br />
0+0+02+0+00+0+01+0+0<br />
0+46+00+47+00+47+0<br />
0+49+00+55+00+54+0<br />
0+53+00+54+00+52+0<br />
0+56+00+55+00+56+00+53+0<br />
1+0+0<br />
S76C+<br />
• There were 22 S-76C+ on market in Q3 2018. The inventory level has<br />
decreased by 4.3% since Q2 2018. The inventory accounted for 15.1% of<br />
the overall fleet in operation. There was one sold transaction in Q3 2018 as<br />
compared to two in Q2 2018. The average days on market increased by 13.3%<br />
- from 866 days in Q2 2018 to 981 days in Q3 2018. The average asking price<br />
has not changed since Q2 2018 and has remained at US$2M in Q3 2018.<br />
S76C++<br />
• There were 24 S-76C++ on market in Q3 2018. The inventory level has<br />
decreased by 7.7% since Q2 2018. The inventory accounted for 11.5% of<br />
the overall fleet in operation. There was one sold transaction in Q3 2018 as<br />
compared to two in Q2 2018. The average days on market increased by 16.2%<br />
- from 555 days in Q2 2018 to 645 days in Q3 2018. The average asking price<br />
has not changed since Q2 2018 and has remained at US$5.4M in Q3 2018.<br />
SPECS<br />
Max Range<br />
Max Speed<br />
Typ. Passengers<br />
FOR SALE<br />
No. for Sale<br />
Avg Asking Price<br />
Avg Days on Market<br />
SOLD<br />
Past 12 Months<br />
Past 3 Months<br />
S-76C+<br />
335 N.M. / 620 km<br />
155 Knots<br />
12<br />
2018 Q3 2018 Q2<br />
22 (15.1%)<br />
2.0M USD<br />
981<br />
2018 Q3 2018 Q2<br />
10<br />
1<br />
23 (15.8%)<br />
2.0M USD<br />
866<br />
10<br />
2<br />
S-76C++<br />
335 N.M. / 620 km<br />
155 Knots<br />
12<br />
2018 Q3<br />
24 (11.5%)<br />
5.4M USD<br />
645<br />
2018 Q3<br />
6<br />
1<br />
2018 Q2<br />
26 (12.4%)<br />
6.2M USD<br />
555<br />
2018 Q2<br />
6<br />
2<br />
S-92<br />
• There were 9 S-92 on market in Q3 2018. The inventory level has increased by<br />
28.6% since Q2 2018.<br />
• The inventory accounted for 3.2% of the overall fleet in operation.<br />
• The average days on market decreased by 10.1% - from 664 days in Q2 2018<br />
to 597 days in Q3 2018.<br />
• The average asking price has decreased to US$15.4M in Q3 2018 from<br />
US$16.1M in Q2 2018.<br />
SPECS<br />
Max Range<br />
Max Speed<br />
Typ. Passengers<br />
FOR SALE<br />
No. for Sale<br />
Avg Asking Price<br />
Avg Days on Market<br />
474 N.M. / 877 km<br />
155 Knots<br />
19<br />
SIKORSKY<br />
$20.1<br />
Average Asking Price<br />
For Sale vs. Sold<br />
0+8+0 0+8+0<br />
0+9+0 0+9+0 0+8+0<br />
$16.1<br />
0+7+0 0+7+0 0+9+0<br />
$15.4<br />
0+9+0 0+8+0 0+8+0<br />
0+0+0 0+0+0 0+0+0<br />
2018 Q3<br />
9 (3.2%)<br />
15.4M USD<br />
597<br />
2018 Q2<br />
7 (2.5%)<br />
16.7M USD<br />
664<br />
7 8 8 8 8 9 9 9<br />
7 8 8 9<br />
7<br />
Sep Dec Mar Jun Sep<br />
2017 2018<br />
Sold<br />
For Sale<br />
1<br />
SOLD<br />
Past 12 Months<br />
Past 3 Months<br />
2018 Q3<br />
1<br />
0<br />
2018 Q2<br />
1<br />
1<br />
1+0+0 0+0+0 0+0+0 0+0+0 0+0+0 0+0+0 0+0+0 0+0<br />
0+8+0+7+0<br />
Source: JETNET & ASG<br />
64 | ASIAN SKY QUARTERLY — THIRD QUARTER 2018
THIRD QUARTER 2018 — ASIAN SKY QUARTERLY | 65