„Contrast Agents in Sonography“ by T - European-Hospital
„Contrast Agents in Sonography“ by T - European-Hospital
„Contrast Agents in Sonography“ by T - European-Hospital

You also want an ePaper? Increase the reach of your titles
YUMPU automatically turns print PDFs into web optimized ePapers that Google loves.
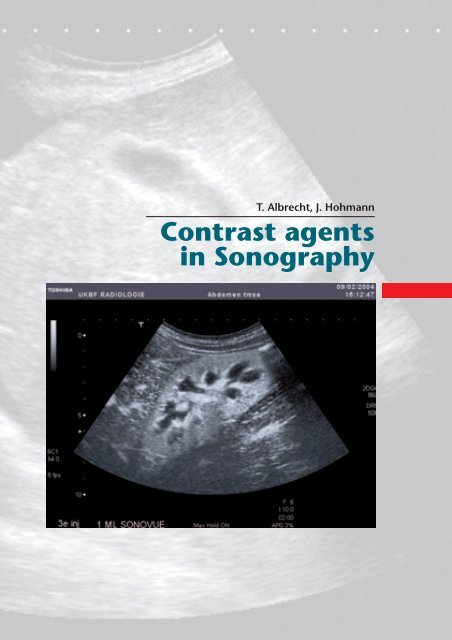
T. Albrecht, J. Hohmann<br />
Contrast agents<br />
<strong>in</strong> Sonography
4<br />
Physico-chemical<br />
and pharmacological<br />
properties<br />
Ultrasound contrast agents (USCA) or<br />
echo enhancers consist of m<strong>in</strong>ute gas conta<strong>in</strong><strong>in</strong>g<br />
microbubbles that have a high reflectivity<br />
when exposed to an ultrasound<br />
field. The history of USCA started <strong>in</strong> the mid<br />
of the 1960s. The cardiologist Joyner performed<br />
echo cardiography dur<strong>in</strong>g the <strong>in</strong>jection<br />
of sal<strong>in</strong>e solution <strong>in</strong>to the aortic root<br />
via a catheter. Dur<strong>in</strong>g the <strong>in</strong>jection he observed<br />
bright signals on M-mode imag<strong>in</strong>g.<br />
The first written publication of this phenomenon<br />
was <strong>by</strong> Gramiak and Shah and<br />
appeared <strong>in</strong> 1968 1 . Small highly reflective<br />
air bubbles with<strong>in</strong> the <strong>in</strong>jected fluid where<br />
recognized to be the reason for the observed<br />
signals.<br />
The reason for the high reflectivity of air<br />
bubbles is as follows: The ultrasound image<br />
consists of reflected echoes which occur<br />
when an ultrasound pulse encounters <strong>in</strong>terfaces<br />
of different materials or tissues. The<br />
larger the proportion of sound energy reflected<br />
at the <strong>in</strong>terface, the more <strong>in</strong>tense<br />
are the signals shown on the sonographic<br />
image. Each material has a characteristic<br />
acustic <strong>in</strong> impedance (Z). Z is def<strong>in</strong>ed as the<br />
product of the speed of sound <strong>in</strong> a specific<br />
material and its physical density. Table 1<br />
shows the density, speed of sound and<br />
acustic impedance of some typical substances<br />
relevant to cl<strong>in</strong>ical sonography. The<br />
degree of reflection at <strong>in</strong> <strong>in</strong>terface and thus<br />
the <strong>in</strong>tensity of the echoes displayed <strong>in</strong> the<br />
sonographic image depends on the difference<br />
<strong>in</strong> impedance between the two adjacent<br />
materials: The higher the difference <strong>in</strong><br />
impedance, the stronger the reflected<br />
echoes. Conversely the amplitude of the<br />
sound wave travell<strong>in</strong>g beyond the <strong>in</strong>terface<br />
decreases with higher impedances. As<br />
shown <strong>in</strong> table 1, the difference <strong>in</strong> acuostic<br />
impedance between air (and other gases) on<br />
the one hand and water or soft tissue on the<br />
other hand is very high, this leads to high reflectivity<br />
of gas <strong>in</strong> sonography. The reflectivity<br />
of air is so high that m<strong>in</strong>ute amounts of<br />
gas bubbles are sufficient to produce considerable<br />
signal enhancement <strong>in</strong> the entire<br />
blood pool (less than 1 ml of gas are <strong>in</strong>jected<br />
with a typical dose of USCA).<br />
In the 1970s cardiologists started to<br />
use agitated sal<strong>in</strong>e solutions as the first<br />
contrast agents for echocardiography.<br />
When <strong>in</strong>jected <strong>in</strong>travenously small air bubbles<br />
<strong>in</strong>cluded <strong>in</strong> the fluid produced signal<br />
enhancement <strong>in</strong> the right heart. These<br />
bubbles where however not able to withstand<br />
pulmonary passage so that there was<br />
no signal enhancement <strong>in</strong> the left heart.<br />
They were therefore used for detection of<br />
right to left shunts <strong>by</strong> demonstration of micro<br />
bubbles with<strong>in</strong> the left heart. Due to<br />
their lack of transpulmonary stability, such<br />
agitated fluids could neither be used for<br />
echocardiography of the left heart nor for<br />
extra-cardiac applications.<br />
Table 1: Acoustic Impedance (Z) of some<br />
materials relevant to cl<strong>in</strong>ical US.<br />
Material Density Speed of sound Acoustic Impedance<br />
(kg/m3) (m/s) (kg/m 2 s)<br />
Air 1,2 330 400<br />
Water 1000 1480 1 488 000<br />
Soft tissue 1100 1540 1 630 000<br />
Bone 1900 4080 7 800 000
Contrast agents<br />
<strong>in</strong> Sonography<br />
Abstract<br />
Ultrasound contrast agents<br />
consist of t<strong>in</strong>y gas bubbles encapsulated<br />
<strong>by</strong> a stabilis<strong>in</strong>g membrane<br />
or shell. When comb<strong>in</strong>ed<br />
with recent contrast-specific ultrasound<br />
techniques, they provide substantial enhancement<br />
of vessels and solid organs.<br />
The cl<strong>in</strong>ical use and the diagnostic value of<br />
ultrasound contrast agents are <strong>in</strong> pr<strong>in</strong>ciple<br />
comparable to contrast agents for CT and<br />
MRI. They add an additional dimension of<br />
<strong>in</strong>formation to sonography, which results<br />
<strong>in</strong> considerable improvement of diagnostic<br />
accuracy <strong>in</strong> many cases. They can also<br />
be used for functional imag<strong>in</strong>g studies of<br />
Albrecht, T.<br />
Hohmann, J.<br />
haemodynamics. This paper<br />
reviews the physico-chemical<br />
properties of various<br />
microbubble contrast agents,<br />
discusses non-l<strong>in</strong>ear bubble behaviour<br />
and contrast-specific imag<strong>in</strong>g techniques.<br />
An overview of the most important radiological<br />
cl<strong>in</strong>ical applications <strong>in</strong> the liver,<br />
kidney and spleen is given.<br />
Key words<br />
Contrast media – microbubbles - ultrasound,<br />
technology – liver, US – spleen, US – functional<br />
imag<strong>in</strong>g<br />
PD Dr. med. Thomas Albrecht<br />
Kl<strong>in</strong>ik und Polikl<strong>in</strong>ik für<br />
Radiologie und Nuklearmediz<strong>in</strong><br />
Campus Benjam<strong>in</strong> Frankl<strong>in</strong><br />
Charité – Universitätsmediz<strong>in</strong> Berl<strong>in</strong><br />
H<strong>in</strong>denburgdamm 30<br />
D-12200 Berl<strong>in</strong><br />
3
S<strong>in</strong>ce the mid 1990s<br />
transpulmonary microbubble<br />
contrast agents have become<br />
available. They distribute<br />
evenly throughout the<br />
entire blood pool and can be<br />
used for echocardiography of<br />
the left heart as well as for extracardiac<br />
ultrasound. Transpulmonary<br />
stability is<br />
achieved <strong>by</strong> the addition of a<br />
shell surround<strong>in</strong>g and thus<br />
stabilis<strong>in</strong>g the microbubble.<br />
Different materials are used<br />
for these shells: Soft shells<br />
consists of th<strong>in</strong> membranes<br />
or layers of phosphor lipids or<br />
surfactants. Other agents employ harder<br />
and more stable shells made of album<strong>in</strong> or<br />
polymers. The average diameter of the micro<br />
bubbles of all dedicated USCA ranges<br />
between approximately 2 and 7 µ, they are<br />
thus smaller then red cells and there is<br />
therefore no risk of capillary embolization.<br />
Contrast agent microbubbles consist of<br />
various types of gases. There are two ma<strong>in</strong><br />
groups: High solubility gas agents us<strong>in</strong>g air<br />
(e.g. Levovist, Scher<strong>in</strong>g AG, Berl<strong>in</strong>, Germany)<br />
and low solubility gas USCA us<strong>in</strong>g<br />
more stable perfluor gases (e.g. SonoVue,<br />
Bracco SPA, Milan, Italy). The much lower<br />
solubility of perfluor gases <strong>in</strong> plasma leads<br />
to a higher stability of these agents with<br />
stronger and longer last<strong>in</strong>g signal enhancement.<br />
Table 2 summarizes the most<br />
important USCA currently licenced or <strong>in</strong><br />
cl<strong>in</strong>ical development.<br />
USCA are blood pool agents, <strong>in</strong> contrast<br />
to conventional agents for CT or MRI<br />
they do not diffuse <strong>in</strong>to the extra cellular<br />
fluid compartment. Follow<strong>in</strong>g <strong>in</strong>tra venous<br />
<strong>in</strong>jection they rema<strong>in</strong> <strong>in</strong> the blood pool for<br />
several m<strong>in</strong>utes. The gas is gradually elim<strong>in</strong>ation<br />
from the blood <strong>by</strong> exhalation via the<br />
lungs, the shells are metabolized. All licensed<br />
USCA are well tolerated with few<br />
adverse reactions reported 2 . They are not<br />
nephrotoxic and allergic reactions are very<br />
rare and considerably less frequent then<br />
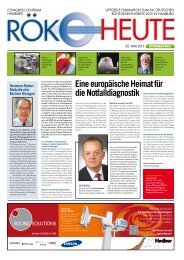
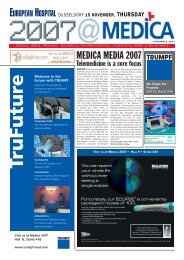
Figure 1: In vivo m<strong>in</strong>croscopie of a capillary<br />
with fluorescend microbubbles<br />
(bright green) und red cells (arrows).<br />
Courtesy of Dr. Jonathan L<strong>in</strong>dner, University<br />
of Virg<strong>in</strong>ia; from: Handbook of Contrast<br />
Echocardiography, Becher H und Burns PN,<br />
Spr<strong>in</strong>ger, Berl<strong>in</strong> 2000.<br />
with iod<strong>in</strong>ated X-ray contrast agents. Two<br />
USCM for radiological applications are currently<br />
available for cl<strong>in</strong>ical use <strong>in</strong> the <strong>European</strong><br />
Union: Levovist (Scher<strong>in</strong>g AG, Berl<strong>in</strong>,<br />
Germany) s<strong>in</strong>ce 1995 and SonoVue (Bracco<br />
SPA, Milan, Italy) s<strong>in</strong>ce 2001. Levovist<br />
consists of a galctose matrix, galactosaemia<br />
is thus a contra<strong>in</strong>dication.<br />
Non-l<strong>in</strong>ear properties of microbubbles<br />
and contrast-specific imag<strong>in</strong>g techniques<br />
USCA were orig<strong>in</strong>ally developed to enhance<br />
signals from flow<strong>in</strong>g blood <strong>in</strong> technically<br />
difficult spectral or colour Doppler<br />
studies. Due the rapid improvements <strong>in</strong><br />
equipment technology and particularly <strong>in</strong><br />
Doppler sensitivity, this application has become<br />
virtually obsolete.<br />
Outside the heart the agents do not<br />
provide sufficient signal enhancement on<br />
conventional B-mode imag<strong>in</strong>g. In order to<br />
5
6<br />
achieve cl<strong>in</strong>ically useful and Doppler <strong>in</strong>dependent<br />
extra-cardiac enhancement, contrast-specific<br />
imag<strong>in</strong>g techniques are required.<br />
Several such techniques have been<br />
developed <strong>in</strong> recent years. They all exploit<br />
the so called non-l<strong>in</strong>ear acoustic properties<br />
of microbubbles.<br />
When exposed to ultrasound ultrasound<br />
waves, microbubbles occilate. This<br />
occurs even at very low amplitude (energy)<br />
of the <strong>in</strong>sonat<strong>in</strong>g pulse. The occilations of<br />
the bubbles have a strong tendency to be<br />
resonant. The resonance frequency of a<br />
typical contrast agent microbubble measur<strong>in</strong>g<br />
3m <strong>in</strong> diameter is close to 3 Mhz and<br />
this frequency happens to be well with<strong>in</strong><br />
the typical frequency range used <strong>in</strong> abdom<strong>in</strong>al<br />
and some other medical ultrasound.<br />
This “lucky co<strong>in</strong>cidence” of <strong>in</strong>sonat<strong>in</strong>g<br />
and resonance frequency<br />
provides for a strong harmonic response of<br />
the microbubbles.<br />
The resonant behaviour of microbubbles<br />
is crucially dependent on the amplitude<br />
or energy of the transmitted pulse<br />
(transducer out-put). The standardised<br />
measure of transmit energy, which is displayed<br />
<strong>by</strong> modern ultrasound systems, is<br />
the mechanical <strong>in</strong>dex (MI). It is def<strong>in</strong>ed as<br />
the peak rarefactional pressure of an ultrasound<br />
longitud<strong>in</strong>al wave propagat<strong>in</strong>g <strong>in</strong> a<br />
uniform medium, divided <strong>by</strong> the square<br />
root of the centre frequency of the transmitted<br />
pulse. The MI is not measured dur-<br />
Table 2: The most important ultrasound<br />
contrast agents (as of July 2003)<br />
Name Manufacturer Gas Shell State of Development<br />
Bisphere Po<strong>in</strong>t Biomedical Air Polymer Cl<strong>in</strong>ical development<br />
BY963 Byk-Gulden Air Lipid Cl<strong>in</strong>ical development<br />
completed, no license<br />
application <strong>in</strong>tended<br />
EchoGen Sonus Dodeca- Surfactatant Licensed <strong>in</strong> EU,<br />
fluoropentan not marketed<br />
Echovist* Scher<strong>in</strong>g Air No shell, Licensed for<br />
galactose matrix echocardiography and<br />
hysterosalp<strong>in</strong>gography <strong>in</strong> a<br />
few <strong>European</strong> countries<br />
Def<strong>in</strong>ity Dupont Merck/ Schwefel- Liposoms Licensed for<br />
ImaRx hexafluorid echocardiography <strong>in</strong><br />
North America<br />
Imagent Alliance Perfluorohexan/ Surfactatant Cl<strong>in</strong>ical development<br />
Air completed<br />
Levovist Scher<strong>in</strong>g Air Palmitic acid Licensed <strong>in</strong> 70 <strong>European</strong> and<br />
galactose matrix Asian countries, not <strong>in</strong> USA<br />
Optison MBI/Amersham Pefluoropropan Album<strong>in</strong> Licensed for echocardiography<br />
Medical <strong>in</strong> EU and North America<br />
Sonavist Scher<strong>in</strong>g Air Polymer Cl<strong>in</strong>ical development stopped<br />
Sonazoid Amersham Medical Perfluorocarbon Lipid Cl<strong>in</strong>ical development <strong>in</strong> Japan<br />
SonoVue Bracco/ALTANA Schwefel- Phospholipid Licensed <strong>in</strong> EU and several<br />
hexafluorid Asian countries, not <strong>in</strong> Japan<br />
and USA<br />
*No transpulmonary stability
Resonance pressure changes<br />
Low<br />
amplitude<br />
Diameter of the microbubbles<br />
L<strong>in</strong>ear<br />
oscillation<br />
Non-operative status<br />
<strong>in</strong>g an exam<strong>in</strong>ation but calculated based<br />
on a number of assumptions. S<strong>in</strong>ce these<br />
assumptions are not fully met <strong>by</strong> patients <strong>in</strong><br />
cl<strong>in</strong>ical practise (e.g. uniform sound absorbtion<br />
throughout the entire image), MI<br />
read<strong>in</strong>gs should be regarded as estimates.<br />
The true energy deposited <strong>in</strong> tissue will vary<br />
between different parts of the image and<br />
between patients as well as between transducers<br />
and manufacturers. Nevertheless,<br />
the MI value displayed on the scanner has<br />
proven to be a very useful albeit imprecise<br />
<strong>in</strong>dicator of the transmit energy used dur<strong>in</strong>g<br />
cl<strong>in</strong>ical contrast enhanced exam<strong>in</strong>ations.<br />
Careful control of transmit energy is<br />
paramount when us<strong>in</strong>g contrast agents<br />
and transducer out-put is the most important<br />
mach<strong>in</strong>e sett<strong>in</strong>g that the operator<br />
must control carefully. MI sett<strong>in</strong>gs <strong>in</strong> cl<strong>in</strong>ical<br />
contrast-enhanced sonography range<br />
between approx. 0.05 and 1.8 depend<strong>in</strong>g<br />
ma<strong>in</strong>ly on the agent used.<br />
At very low transmit energy (MI <<br />
0.05), the oscillations of the microbubbles<br />
are symmetrical or l<strong>in</strong>ear and the changes<br />
of bubble radius are <strong>in</strong>versely proportional<br />
to the pressure changes <strong>in</strong> tissue: dur<strong>in</strong>g<br />
the positive phase of the US pulse the bubble<br />
is compressed and dur<strong>in</strong>g the negative<br />
phase it is expanded, both to the same degree.<br />
As the amplitude of the <strong>in</strong>sonnat<strong>in</strong>g<br />
US pulse is <strong>in</strong>creased, the bubble becomes<br />
High<br />
amplitude<br />
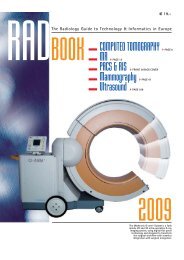
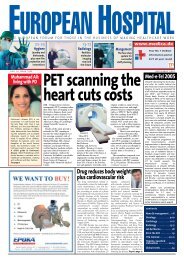
Figure 2: L<strong>in</strong>ear<br />
und non-l<strong>in</strong>ear<br />
(harmonic)<br />
resonance of<br />
microbubbles.<br />
At low amplitude<br />
the oscillations<br />
of the<br />
bubble match the pressure changes <strong>in</strong>duced<br />
<strong>by</strong> the sound wave. The reflected echo has<br />
the same frequency as the <strong>in</strong>sonat<strong>in</strong>g pulse<br />
(l<strong>in</strong>ear behaviour). At higher amplitude, the<br />
bubble shows stronger resistance to compression<br />
than to expansion and the oscillations<br />
become asymmetrical. The reflected echo<br />
thus conta<strong>in</strong>s frequencies (harmonics) which<br />
are different from that of the <strong>in</strong>sonat<strong>in</strong>g pulse<br />
(non-l<strong>in</strong>ear behaviour).<br />
Non-l<strong>in</strong>ear<br />
oscillation<br />
relatively more resistant to compression<br />
than to expansion which leads to assymetrical<br />
or non-l<strong>in</strong>ear occilations (Fig. 2). These<br />
non-l<strong>in</strong>ear oscillations conta<strong>in</strong> not only the<br />
<strong>in</strong>sonnat<strong>in</strong>g “fundamental” frequency but<br />
several other “harmonic” frequencies”.<br />
These harmonic components become part<br />
of the signal returned from the bubble to<br />
the transducer (bubble response) and are<br />
exploited <strong>by</strong> contrast-specific imag<strong>in</strong>g<br />
modes. Harmonic signals occur at multiples<br />
(two, three and four times) of the <strong>in</strong>sonat<strong>in</strong>g<br />
frequency. The second harmonic (double<br />
the <strong>in</strong>sonat<strong>in</strong>g frequency) has the highest<br />
amplitude among the harmonics (Fig.<br />
3) and is therefore the most relevant for<br />
contrast-specific imag<strong>in</strong>g.<br />
7
8<br />
At even higher amplitudes destruction<br />
of microbubbles occurs. The threshold for<br />
destruction is variable and depends on a<br />
number of different factors such as the size,<br />
shell material and gas of the bubble as well<br />
as the attenuation <strong>by</strong> the overlay<strong>in</strong>g tissue.<br />
For Albunex (no longer commercially available),<br />
the threshold MI for bubble destruction<br />
<strong>in</strong> vitro is 0.3 3 . The process of microbubble<br />
destruction is complex. Recent<br />
video-microscopic studies with extremely<br />
high temporal resolution have given some<br />
<strong>in</strong>sight <strong>in</strong>to the physical phenomena <strong>in</strong>volved.<br />
The most important mechanism is<br />
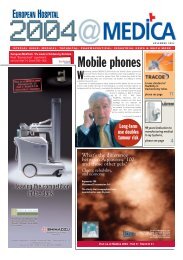
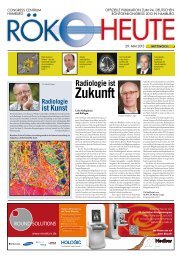
Figure 3: Frequency spectrum of Levovist<br />
<strong>in</strong>sonated at 3,75 MHz at <strong>in</strong>termediate<br />
amplitude. The strongest signal reflected<br />
is the fundamental which has the same<br />
frequency as the <strong>in</strong>sonat<strong>in</strong>g pulse. Another<br />
strong peak occurs at the second harmonic,<br />
which has twice the <strong>in</strong>sonationg frequency.<br />
Courtesy of Prof. Peter Burns, University<br />
of Toronto; from: Handbook Handbook<br />
of Contrast Echocardiography, Becher H<br />
und Burns PN, Spr<strong>in</strong>ger, Berl<strong>in</strong> 2000<br />
bubble fragmentation which is preceded<br />
<strong>by</strong> massive expansion of the bubble <strong>by</strong> a<br />
factor of 10 of its orig<strong>in</strong>al radius. Dur<strong>in</strong>g the<br />
next compression, the bubble can no<br />
longer withstand the changes <strong>in</strong> pressure<br />
and size, which results <strong>in</strong> fragmentation <strong>in</strong>to<br />
several smaller bubbles (Fig. 4). This<br />
process only lasts a few milliseconds after<br />
the start of <strong>in</strong>sonation. Another reason for<br />
bubble disruption is deflation of the bubbles<br />
<strong>by</strong> ultrasound-<strong>in</strong>duced diffusion 4,5 .<br />
Similar to break<strong>in</strong>g glass, an <strong>in</strong>tense<br />
and strongly non-l<strong>in</strong>ear signal is produced<br />
<strong>by</strong> the process of bubble disruption. This<br />
signal is very different from a signal returned<br />
from an <strong>in</strong>tact bubble (“decorrelation”)<br />
and has been termed stimulated<br />
acoustic emission (SAE) or transient scatter<strong>in</strong>g.<br />
It produces very bright but highly<br />
transient echoes <strong>in</strong> the US image.<br />
Contrast-specific imag<strong>in</strong>g techniques<br />
such as Pulse Subtraction Imag<strong>in</strong>g (PSI) or<br />
Vascular recognition Imag<strong>in</strong>g (VRI) (both<br />
<strong>by</strong> Toshiba) exploit the non-l<strong>in</strong>ear bubble<br />
response for a highly sensitive and specific<br />
display of contrast agents. PSI is based on<br />
modulation of the phase of two subsequent<br />
pulses (for details see separate section on<br />
page x). It is a grey-scale technique with<br />
high spatial and temporal resolution.
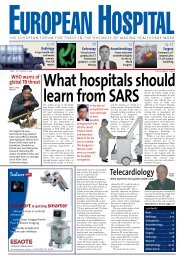
Figure 4: Videomicroscopic study of<br />
a SonoVue bubble exposed to a high<br />
amplitude (0,6 MPa) US pulse over an<br />
observation period of 5ms. Initial resonance<br />
is followed <strong>by</strong> rapid fragmentationv of the<br />
bubble. The graph shows the non-l<strong>in</strong>ear<br />
changes of radius over time.<br />
Courtesy of: Dr. Nico de Jong, Thoraxcenter,<br />
Rotterdam.<br />
VRI is a s<strong>in</strong>gle pulse colour Doppler<br />
technique display<strong>in</strong>g the contrast agent <strong>in</strong>formation<br />
as a colour overlay superimposed<br />
on the conventional B-mode image.<br />
Its advantage is the comb<strong>in</strong>ation of tissue<br />
and contrast <strong>in</strong>formation which can be displayed<br />
separately or simultaneously. Furthermore,<br />
VRI is the first contrast-specific<br />
imag<strong>in</strong>g mode to discrem<strong>in</strong>ate mov<strong>in</strong>g<br />
from stationary bubbles and to display the<br />
flow direction of bubbles. Stationary bubbles<br />
are shown <strong>in</strong> green, while mov<strong>in</strong>g<br />
bubbles are either red or blue, depend<strong>in</strong>g<br />
on their flow direction (Fig. 5).<br />
High versus low<br />
MI imag<strong>in</strong>g<br />
From the above it is clear, that the<br />
transmit energy has crucial <strong>in</strong>fluence on the<br />
signal returned from the microbubble. Different<br />
contrast media require different<br />
transducer out-put sett<strong>in</strong>gs and scann<strong>in</strong>g<br />
techniques. The two ma<strong>in</strong> categories are<br />
high and low MI imag<strong>in</strong>g.<br />
High MI imag<strong>in</strong>g<br />
Air-based agents such as Levovist provide<br />
only weak harmonic signals at low MI.<br />
At high MI (> 0.5), however, they show<br />
strong SAE produc<strong>in</strong>g bright transient signal<br />
enhancement. High MI techniques are<br />
thus required for cl<strong>in</strong>ically useful enhancement<br />
with air-based agents. On Advanced<br />
Dynamic Flow (ADF, Toshiba), SAE is displayed<br />
as bright high resolution colour signals<br />
superimposed on a conventional Bmode<br />
image. Aga<strong>in</strong>, the tissue and contrast<br />
<strong>in</strong>formation can be displayed separately or<br />
simultaneously (Fig. 6).<br />
The ma<strong>in</strong> limitation of high MI imag<strong>in</strong>g<br />
is that the SAE signal occurr<strong>in</strong>g dur<strong>in</strong>g bubble<br />
destruction is highly transient, last<strong>in</strong>g<br />
only 3 or 4 frames when scann<strong>in</strong>g <strong>in</strong> the<br />
same position. After that, almost all bubbles<br />
have been destroyed prohibit<strong>in</strong>g further<br />
enhancement. One way to overcome<br />
this problem is <strong>in</strong>termittent imag<strong>in</strong>g at low<br />
frame rates (one image every few seconds)<br />
to allow refill<strong>in</strong>g of the image plane before<br />
9
10<br />
Pulse Subtraction Imag<strong>in</strong>g<br />
Pulse subtraction imag<strong>in</strong>g is based on the<br />
pr<strong>in</strong>ciple of phase modulation for detection<br />
of non l<strong>in</strong>ear echo signals. It is a broad band<br />
technique, that displays signals returned<br />
from micro bubbles at a high spacial resolution<br />
<strong>in</strong> the entire B-mode image. PSI uses<br />
two pulses which are 180° out of phase (two<br />
exact mirror images). The two pulses are<br />
transmitted immediately back and the reflected<br />
echoes from these these pulses are<br />
summed to form one image frame.<br />
If the transmitted pulses encounter an<br />
exclusively l<strong>in</strong>ear reflector (such as tissue at<br />
low MI) the responses to the two <strong>in</strong>verted<br />
pulses are aga<strong>in</strong> identical mirror images of<br />
each other. if two pulses are added, the signal<br />
is completely cancelled, so that l<strong>in</strong>ear reflectors<br />
are not shown <strong>in</strong> the image. If, on<br />
the other hand, non-l<strong>in</strong>ear reflectors such as<br />
microbubbles are encountered <strong>by</strong> the two<br />
pulses, each of these pulses is distorted due<br />
to the production of harmonics. The distortion<br />
also means that the two reflected pulses<br />
are no longer identical mirror images to<br />
each other. As a consequence, addition of<br />
these two pulses will no longer result <strong>in</strong> cancellation;<br />
the harmonic component of the<br />
two pulses is used for the image. S<strong>in</strong>ce microbubbles<br />
are strong harmonic reflectors,<br />
this technique is idealy suited selectively to<br />
display microbubbles and suppress<strong>in</strong>g tissue<br />
signal at low MI.<br />
At high MI the first of the two<br />
pulses will destroy the bubble and<br />
lead to an <strong>in</strong>tense broad band nonl<strong>in</strong>ear<br />
signal. The second pulse can no<br />
longer be reflected <strong>by</strong> the destroyed<br />
bubble and there is subsequently no<br />
response from the second pulse.<br />
Add<strong>in</strong>g the two pulses means that the<br />
strong reflections from the first pulse<br />
will be displayed without modification.<br />
In cl<strong>in</strong>ical practice this means<br />
that there is a strong but extremely<br />
short lived response from micro bubbles<br />
such as Levovist on high MI PSI.<br />
PSI is a B-mode technique with non-l<strong>in</strong>ear<br />
signals displayed <strong>in</strong> the entire imag<strong>in</strong>g<br />
<strong>in</strong>dependent of any region of <strong>in</strong>terest or<br />
colour box. The stronger the non-l<strong>in</strong>ear signal<br />
<strong>in</strong>tensity from the micro bubbles, the<br />
brighter is the signal <strong>in</strong> the image of the pixel<br />
represent<strong>in</strong>g that bubble <strong>in</strong> the image.<br />
At high MI, tissue also produces harmonics.<br />
For that reason, PSI is also used for tissue<br />
harmonic imag<strong>in</strong>g.<br />
Pr<strong>in</strong>ciple of PSI. Two pulses that are 180°<br />
out of phase are sent immediately back-toback,<br />
and the returned signals are summed<br />
to build a US frame. In case of exclusively<br />
l<strong>in</strong>ear scatter<strong>in</strong>g without distortion, this<br />
summation produces a signal void.<br />
Nonl<strong>in</strong>ear response from microbubbles,<br />
<strong>in</strong>clud<strong>in</strong>g harmonic resonance and stimulated<br />
acoustic emission (//SAE), distorts the<br />
returned signals; thus, the summation of<br />
two pulses no longer results <strong>in</strong> a signal void.<br />
The resultant signal is particularly strong <strong>in</strong><br />
the presence of bubble destruction, as the<br />
destroyed bubble can no longer produce a response<br />
to the second pulse so that the strong<br />
signal from the first pulse is used without any<br />
subtraction from the second pulse.
Figure 5: Kidney of a healthy subject on<br />
Vascular Recognition Imag<strong>in</strong>g (VRI) post<br />
SonoVue. Stationary microbubbles are<br />
displayed <strong>in</strong> green, flow<strong>in</strong>g bubbles are<br />
coded <strong>in</strong> red and blue, depend<strong>in</strong>g on flow<br />
direction relative to the transducer.<br />
the next destructive US frame. Alternatively,<br />
the so-called sweep technique can be<br />
used: The transducer is cont<strong>in</strong>uously<br />
moved through an organ so that a new<br />
area with undestroyed bubbles is scanned<br />
with each new frame. This allowes one to<br />
obta<strong>in</strong> one or two brightly enhanced<br />
sweeps of an entire organ and the c<strong>in</strong>e loop<br />
is used to review the sweeps. The images<br />
obta<strong>in</strong>ed us<strong>in</strong>g this approach are of high<br />
quality and <strong>in</strong> has been shown to be cl<strong>in</strong>ically<br />
usefull <strong>in</strong> experienced hands. However,<br />
the sweep technique requires tra<strong>in</strong><strong>in</strong>g<br />
and is somewhat cumbersome, as the real<br />
time nature of the exam<strong>in</strong>ation is lost and<br />
further sweeps can often not be performed<br />
unless a second <strong>in</strong>jection is adm<strong>in</strong>istered.<br />
Low MI imag<strong>in</strong>g<br />
The more recent perfluor agents such<br />
as SonoVue have a much stronger harmonic<br />
response even at low MI. The optimal<br />
MI for imag<strong>in</strong>g with SonoVue is between<br />
approx. 0.07 and 0.2 . Imag<strong>in</strong>g at<br />
such low amplitude provides for good signal<br />
enhancement with little bubble destruction.<br />
Contrast-enhanced real time imag<strong>in</strong>g<br />
is thus possible. It can be used e.g.for<br />
dynamic assessment of perfusion of tumours<br />
or for complete real time assessment<br />
of organs such as the liver <strong>by</strong> multiple slow<br />
sweeps performed over several m<strong>in</strong>utes.<br />
Low MI imag<strong>in</strong>g is very similar to conventional<br />
US and much more user friendly than<br />
the high MI technique. Low MI imag<strong>in</strong>g<br />
has thus replaced the high MI approach <strong>in</strong><br />
most centres. PSI and VRI are well suited for<br />
low MI imag<strong>in</strong>g with SonoVue.<br />
11
12<br />
Figure 6: Normal liver<br />
scanned at high MI us<strong>in</strong>g<br />
Advanced Dynamic flow<br />
<strong>in</strong> the liver-specific late<br />
phase 4:50 m<strong>in</strong> post<br />
Levovist. ADF can be<br />
displayed (a) as conventional<br />
B-mode only,<br />
(b) as a comb<strong>in</strong>ation<br />
of B-mode and colourised<br />
contrast <strong>in</strong>formation<br />
or (c) as a contrast only<br />
image.<br />
a<br />
b<br />
c
USCA can also be used as tracers for<br />
functional imag<strong>in</strong>g of organs or tumours.<br />
Such applications are currently at an experimental<br />
stage and is discussed below <strong>in</strong><br />
a separate section.<br />
Cl<strong>in</strong>ical applications<br />
Doppler enhancement, which was the<br />
orig<strong>in</strong>al <strong>in</strong>dication for USCA, has become<br />
almost obsolete <strong>in</strong> most areas due to improvements<br />
<strong>in</strong> equipment performance. It<br />
still has a role, however, <strong>in</strong> transcranial<br />
Doppler studies 18-20 and <strong>in</strong> some rare abdom<strong>in</strong>al<br />
applications such as evaluation of<br />
TIPS shunts 21-24 , Budd-Chiari-Syndrome or<br />
renal ve<strong>in</strong> thrombosis.<br />
a<br />
b<br />
Figure 7: (a) Basel<strong>in</strong>e<br />
US shows ascites and<br />
a slightly heterogenous<br />
liver but no focal<br />
lesions. (b) On VRI <strong>in</strong><br />
the delayed phase post<br />
SonoVue (2.59 m<strong>in</strong> p.i.)<br />
several non-enhanc<strong>in</strong>g<br />
small metastases<br />
(arrows) are shown.<br />
Current cl<strong>in</strong>ical use of USCA is ma<strong>in</strong>ly<br />
based on the dynamic assessment of contrast<br />
enhancement of vessels, organs and<br />
pathologies such as tumours or absesses<br />
and parallels the use of contrast agents <strong>in</strong><br />
CT or MRI. The most established cl<strong>in</strong>ical<br />
application of USCA is the liver, followed<br />
<strong>by</strong> kidney (especially test<strong>in</strong>g for reflux <strong>in</strong><br />
children) and spleen. In these areas, the<br />
cl<strong>in</strong>ical value of USCA has been proven<br />
and they are <strong>in</strong>creas<strong>in</strong>gly used <strong>in</strong> rout<strong>in</strong>e<br />
practise. Other potential areas for use are<br />
e.g. pancreas, small bowel, prostate,<br />
breast and eye, but these should be regarded<br />
as ma<strong>in</strong>ly experimental at the current<br />
stage.<br />
13
14<br />
Figure 8: Dynamic CEUS<br />
of a haemangioma<br />
(arrows) us<strong>in</strong>g VRI<br />
and SonoVue.<br />
(a) Peripheral nodular<br />
enhancement <strong>in</strong> the arterial<br />
phase.<br />
(b) Partial centripetal<br />
fill<strong>in</strong>g of the lesion <strong>in</strong> the<br />
portal venous phase.<br />
(c) Subtotal fill<strong>in</strong>g of the<br />
lesion <strong>in</strong> the delayed<br />
phase (2:30 m<strong>in</strong> p.i.).<br />
a<br />
b<br />
c
Liver<br />
Levovist and SonoVue (albeit to a lesser<br />
extent) have a property which makes<br />
them particularly suitable for liver imag<strong>in</strong>g:<br />
Several m<strong>in</strong>utes after adm<strong>in</strong>istration the<br />
micobubbles accumulate <strong>in</strong> normal liver<br />
parenchyma, while other tissue such as<br />
metastases and most HCC are spared from<br />
this delayed enhancement effect. The<br />
cause of the delayed enhancement effect<br />
rema<strong>in</strong>s unknown. There is circumstantial<br />
evidence that the liver- specific late phase<br />
of Levovist is mediated <strong>by</strong> <strong>in</strong>teraction with<br />
the Kuppfer-cells of the RES. In case of<br />
SonoVue, pool<strong>in</strong>g <strong>in</strong> the liver s<strong>in</strong>usoids is<br />
the more likely explanation, therefore the<br />
term s<strong>in</strong>usoidal phase is also used.<br />
Delayed phase imag<strong>in</strong>g is important<br />
for detection (and characterization, as discussed<br />
below) of malignant liver lesions. By<br />
analogy with MRI us<strong>in</strong>g liver specific contrast<br />
agents, detection of metastases is substantially<br />
improved s<strong>in</strong>ce metastases show<br />
little or no contrast up-take and are therefore<br />
easily discrim<strong>in</strong>ated from the enhanc<strong>in</strong>g<br />
normal liver tissue 28-34 . The same effect<br />
can usually also be observed dur<strong>in</strong>g the<br />
portal venous phase <strong>in</strong> most patients, albeit<br />
to a lesser extent. The contrast between<br />
metastases and surround<strong>in</strong>g hepatic<br />
parenchyma is <strong>in</strong>creased dur<strong>in</strong>g the delayed<br />
phase of Levovist <strong>by</strong> approximately 11 dB <strong>in</strong><br />
comparison to basel<strong>in</strong>e imag<strong>in</strong>g 28 . In pr<strong>in</strong>ciple,<br />
HCC have similar properties on delayed<br />
phase imag<strong>in</strong>g as metastases, however<br />
some HCC (typically highly differentiated<br />
tumors) will show delayed enhancement<br />
similar to surround<strong>in</strong>g liver and this makes<br />
their detection more difficult.<br />
Delayed phase imag<strong>in</strong>g is particularly<br />
useful for detection of small malignant lesions<br />
or lesions which are isoreflective on<br />
basel<strong>in</strong>e imag<strong>in</strong>g and therefore often <strong>in</strong>visible.<br />
Lesions up to 5 mm <strong>in</strong> size are well<br />
demonstrated <strong>by</strong> CEUS and even lesions<br />
smaller than 5 mm are not <strong>in</strong>frequently<br />
found 28,29,32 . The sensitivity of CEUS <strong>in</strong> the<br />
detection of liver metastases is comparable<br />
to that of dual phase spiral-CT 33 . The de-<br />
tection of other malignant liver tumours<br />
such as HCC or cholangio carc<strong>in</strong>oma is also<br />
improved.<br />
UCA have also been shown to improve<br />
characterization of focal liver lesions substantially.<br />
When low MI real time imag<strong>in</strong>g<br />
with SonoVue is used, the dynamic contrast<br />
properties of a lesion can be assessed dur<strong>in</strong>g<br />
the arterial, portal venous and delayed<br />
phase. The dynamic images are <strong>in</strong>terpreted<br />
us<strong>in</strong>g essentially the same criteria that<br />
are used for dynamic CT or MRI. Haemangioma<br />
show typical peripheral nodular enhancement<br />
<strong>in</strong> the arterial phase followed<br />
<strong>by</strong> partial or complete centripetal fill<strong>in</strong>g <strong>in</strong><br />
the subsequent phases (Fig. 8). Focal nodular<br />
hyperplasia shows strong arterial hyperenhancement<br />
(often with a “spoke wheel”<br />
central feed<strong>in</strong>g artery) followed <strong>by</strong> isoechogenecity<br />
compared to normal liver <strong>in</strong><br />
the portal venous and delayed phases.<br />
Some FNH also show a non-enhanc<strong>in</strong>g<br />
central scare on delayed imag<strong>in</strong>g. Focal fatty<br />
change will show the same contrast enhancement<br />
as normal liver <strong>in</strong> all three phases.<br />
In summary, all common benign liver<br />
lesions show considerable contrast up-take<br />
dur<strong>in</strong>g the delayed phase, they are therefore<br />
easily differentiated from malignant lesions<br />
which do not enhance at this stage.<br />
Up to 90 % of all focal liver lesions can<br />
be characterized <strong>by</strong> contrast enhanced ultrasound<br />
(CEUS) with regards to their specific<br />
diagnosis 36,38 . Differentiation of benign<br />
and malignant lesions is possible than <strong>in</strong><br />
over 90 % of cases 38,40 . In our cl<strong>in</strong>ical experience<br />
CEUS is superior to CT <strong>in</strong> characterization<br />
of focal liver lesions and comparable<br />
to MRI. In patients with <strong>in</strong>conclusive CT (or<br />
MRI) exam<strong>in</strong>ations, CEUS can serve as a<br />
fast and non-<strong>in</strong>vasive a problem solver <strong>in</strong><br />
many <strong>in</strong>stances.<br />
Kidney<br />
Test<strong>in</strong>g for reflux <strong>in</strong> children after <strong>in</strong>travesical<br />
adm<strong>in</strong>istration of USCA – so called<br />
void<strong>in</strong>g urosonography – is a well established<br />
exam<strong>in</strong>ation <strong>in</strong> paediatric radiology.<br />
Void<strong>in</strong>g urosonography is highly sensitive<br />
15
16<br />
Figure 9: Dynamic CEUS<br />
of a FNH (arrows) us<strong>in</strong>g<br />
PSI and SonoVue.<br />
(a) Unenhanced power<br />
Doppler shows no <strong>in</strong>tralesional<br />
vessels. The FNH is<br />
slightly hyperechoic.<br />
(b) Homogenous<br />
enhancement of the lesion<br />
<strong>in</strong> the arterial phase,<br />
additionally a typical<br />
feed<strong>in</strong>g artery is identified<br />
(arrow head).<br />
(c) Early <strong>in</strong> the portal<br />
venous phase (45 s p.i.)<br />
the lesion becomes<br />
isoechoic and is hardly<br />
discernable from<br />
normal liver.<br />
a<br />
b<br />
c
a<br />
b<br />
c<br />
Figure 10: (a) Basel<strong>in</strong>e<br />
image of a large almost<br />
isoechoic HCC (arrows).<br />
(b) Strong arterial enhancement<br />
of the HCC<br />
17 s post SonoVue on PIS.<br />
The contrast between the<br />
tumour and surround<strong>in</strong>g<br />
liver is <strong>in</strong>creased.<br />
(c) In the portal venous<br />
phase (1:47 m<strong>in</strong> p.i.)<br />
the lesion shows as a well<br />
def<strong>in</strong>ed relative enhancement<br />
defect on PSI.<br />
17
18<br />
Fig. 11: Dynamic CEUS of<br />
“hypovascular” hepatic<br />
metastasis from breast<br />
carc<strong>in</strong>oma us<strong>in</strong>g PSI and<br />
SonoVue.<br />
(a) In the arterial phase<br />
the lesion displays strong<br />
peripheral rim enhancement<br />
(arrow).<br />
(b) Portal venous phase<br />
imag<strong>in</strong>g shows fad<strong>in</strong>g of<br />
the rim.<br />
(c) In the delayed phase,<br />
the lesion presents as a<br />
hypoechoic enhancement<br />
defect with sharp<br />
marg<strong>in</strong>s.<br />
a<br />
b<br />
c
and specific to reflux and at least equivalent<br />
to X-ray void<strong>in</strong>g cystourethrography <strong>in</strong> this<br />
application 41-43 .<br />
The disadvantage of void<strong>in</strong>g urosonography<br />
is <strong>in</strong>complete visualization of the<br />
male urethra, so that the <strong>in</strong>itial <strong>in</strong>vestigation<br />
of a reflux <strong>in</strong> boys still requires the use<br />
of X-ray void<strong>in</strong>g cystourethrography. All<br />
other <strong>in</strong>vestigations (<strong>in</strong>itial <strong>in</strong>vestigations <strong>in</strong><br />
girls and all follow up imag<strong>in</strong>g) should<br />
nowadays be performed us<strong>in</strong>g ultrasound<br />
as this avoids significant radiation exposure<br />
of these young children.<br />
Another application of USCA <strong>in</strong> the<br />
kidney is assessment of focal lesions. Tumours,<br />
<strong>in</strong>farcts and traumatic hemorrhage<br />
are better visualized follow<strong>in</strong>g contrast adm<strong>in</strong>istration.<br />
This is particularly relevant for<br />
a<br />
b<br />
Fig. 12: Renal cell<br />
carc<strong>in</strong>oma.<br />
(a) Basel<strong>in</strong>e US shows<br />
a 6 cm heterogenous<br />
hyperechoic tumor.<br />
(b) The tumour is seen<br />
as a hypovascular lesion<br />
50 s p.i. on VRI.<br />
Courtesy of: Dr. Cochl<strong>in</strong>,<br />
Radiology Department,<br />
University <strong>Hospital</strong><br />
Wales, UK<br />
<strong>in</strong>farcts and haematomas which are often<br />
occult on conventional sonography. Probably<br />
the most important cl<strong>in</strong>ical application<br />
with regards to focal renal lesions is the differentiation<br />
of pseudo tumors from true lesions.<br />
Pseudo tumors will show the same<br />
enhancement characteristics as normal<br />
parenchyma with normal vessels, while tumours<br />
show either more or less enhancement<br />
than the surround<strong>in</strong>g parenchyma<br />
and often an abnormal and irregular<br />
macro-vascular pattern. Conversely, the<br />
role of CEUS <strong>in</strong> the characterization of true<br />
renal tumours is currently very limited,<br />
s<strong>in</strong>ce various types of tumours such as renal<br />
cell carc<strong>in</strong>oma and angiomyolipoma<br />
show a considerable overlap of their contrast<br />
behaviour 47 .<br />
19
20<br />
Spleen<br />
The delayed phase of Levovist and<br />
SonoVue applies not only to the liver<br />
but also to the spleen: both agents<br />
pool <strong>in</strong> normal splenic parenchyma for<br />
many m<strong>in</strong>utes. This can be exploited<br />
for detection of tumors such as focal<br />
lymphoma (Fig.14), <strong>in</strong>farcts and<br />
haematomas 48-50 . In children with blunt<br />
abdom<strong>in</strong>al trauma, <strong>in</strong>juries of the<br />
spleen (and other organs) are readily<br />
visualised on CEUS, which is a good alternative<br />
to CT. Characterisation of<br />
splenic tumors with CEUS is much<br />
more difficult and probably not possible<br />
at this stage.<br />
Summary<br />
Recent contrast-specific imag<strong>in</strong>g<br />
techniques are highly sensitive<br />
to USCA and provide<br />
contrast-enhanced<br />
images at excellent<br />
quality. The cl<strong>in</strong>ical use<br />
of USCA is similar that<br />
of contrast agents for<br />
CT and MRI as. They<br />
give crucial additional<br />
<strong>in</strong>formation for the diagnosis<br />
of abdom<strong>in</strong>al<br />
organs, especially for<br />
detection and<br />
characterisation<br />
of focal liver lesions.<br />
CEUS often<br />
provides a def<strong>in</strong>itive<br />
diagnosis<br />
and obviates the<br />
need for further imag<strong>in</strong>g<br />
<strong>in</strong> many patients.<br />
Functional<br />
haemodynamic<br />
studies<br />
with USCA<br />
USCA can be used as tracers for dynamic<br />
studies of arterio-venous transit<br />
time of organs such as the liver, kidney<br />
or bra<strong>in</strong>. This is based on time-<strong>in</strong>tensity<br />
curves measured <strong>in</strong> artery and ve<strong>in</strong>.<br />
There are three advantages of CEUS <strong>in</strong><br />
this application:<br />
1. The contrast volume is small (<strong>in</strong> the order<br />
of 1 ml) which makes an <strong>in</strong>jected bolus<br />
very compact (short and dense).<br />
2. At frame rates of 10 – 20/s, CEUS has<br />
very high temporal resolution.<br />
3. There is a l<strong>in</strong>ear relationship between<br />
contrast agent concentration and signal<br />
<strong>in</strong>tensity, which is a prerequisite<br />
for mean<strong>in</strong>gful quantification.<br />
The Aplio system (Toshiba)<br />
has a software package that generates<br />
time-<strong>in</strong>tensity curves. The<br />
relevant organ is scanned <strong>in</strong> a<br />
s<strong>in</strong>gle imag<strong>in</strong>g plane dur<strong>in</strong>g and<br />
after contrast <strong>in</strong>jection. The scan<br />
is recorded as a digital loop for<br />
analysis. Several regions of <strong>in</strong>terest<br />
(ROI) can be placed <strong>in</strong> vessels<br />
and/or parenchyma. For each<br />
ROI, the signal changes are calculated<br />
over time and displayed<br />
as a curve (Figure). From these<br />
curves, <strong>in</strong>dices such as arrival<br />
time, paek enhancement or<br />
transit time can be extracted.<br />
There are some promis<strong>in</strong>g<br />
applications for this technique,<br />
which are however still at an experimental<br />
stage. It has been<br />
shown that patients with cirrhosis<br />
have a much shorter transit time
than patients with normal livers or chronic<br />
hepatitis (9-11) . This is due to arterialisation<br />
that occurs <strong>in</strong> cirrhotic livers. Arterialsation<br />
and shorten<strong>in</strong>g of transit time is also observed<br />
<strong>in</strong> livers with early metastases (13,14) .<br />
Exploit<strong>in</strong>g this phenomonen, hepatic transit<br />
time analysis may become useful for early<br />
detection of metastases <strong>in</strong> the future.<br />
Anther approach for haemodynamic<br />
studies of organs or tumours are the destruction<br />
reperfusion or negative bolus technique.<br />
For this technique a steady state of<br />
microbuuble concentration is required and<br />
this is achieved <strong>by</strong> cont<strong>in</strong>uous <strong>in</strong>fusion of<br />
USCA. Dur<strong>in</strong>g the steady state, microbubbles<br />
<strong>in</strong> the imag<strong>in</strong>g plane are destroyed <strong>by</strong><br />
short <strong>in</strong>sonation at high MI. Subsequent<br />
scann<strong>in</strong>g (either <strong>in</strong>termittend at high MI or<br />
cont<strong>in</strong>uous t low MI) is performed to assess<br />
the time required for the signal to recover<br />
from the destruction, as this time is directly<br />
related to perfusion. Aga<strong>in</strong> time-<strong>in</strong>tensity<br />
curves are used; perfusion is calculated<br />
based on the slope of the curve and fractional<br />
vascular volume depends on the high<br />
of the plateau. The most important cl<strong>in</strong>ical<br />
application of the destruction reperfusion<br />
technique is assessment of myocardial perfusion,<br />
which is start<strong>in</strong>g to f<strong>in</strong>d its way <strong>in</strong>to<br />
cl<strong>in</strong>ical practise. Other applications such as<br />
assessment of renal perfusion <strong>in</strong> various<br />
conditions or of tumour perfusion e.g. dur<strong>in</strong>g<br />
anti-angiogenic therapy are still experimental.<br />
Time <strong>in</strong>tensity curves generated <strong>in</strong> the<br />
porta hepatis with ROIs <strong>in</strong> the hepatic<br />
artery, portal ve<strong>in</strong> and hepastic ve<strong>in</strong>.<br />
The frame shown corresponds to the<br />
white vertical l<strong>in</strong>e <strong>in</strong> the graph: at this<br />
time po<strong>in</strong>t the contrast has arrived <strong>in</strong> the<br />
artery (ROI and curve A) but not yet <strong>in</strong><br />
the ve<strong>in</strong>s (ROIs and curves B and C).<br />
21
22<br />
a<br />
Fig. 13: Splenic haematoma.<br />
(a) Basel<strong>in</strong>e shows a poorly<br />
def<strong>in</strong>ed, slightly hyperechoic<br />
band-like area (arrow) <strong>in</strong> the<br />
spleen and some perisplenic<br />
fluid (arrow). Courtesy<br />
of Dr. Cochl<strong>in</strong>, Radiology Dept.<br />
University <strong>Hospital</strong> Wales, UK.<br />
(b) Post SonoVue an extensive<br />
haematoma is shown as an<br />
irregular non-enhanc<strong>in</strong>g area on<br />
PSI. Courtesy of Dr. C. Klemm,<br />
St. Georg <strong>Hospital</strong>, Leipzig,<br />
Germany.<br />
Fig. 14: Large focal splenic<br />
lymphoma. (a) The lymphoma<br />
shows as a large hypoechoic area<br />
<strong>in</strong> the lower half of the spleen.<br />
(b) Post SonoVue, there is<br />
homogenous enhancement of<br />
the normal part of the spleen<br />
(show<strong>in</strong>g <strong>in</strong> green, VRI) while<br />
there is almost no up-take <strong>in</strong> the<br />
lymphoma. Courtesy of: Dr.<br />
Cochl<strong>in</strong>, Radiology Department,<br />
University <strong>Hospital</strong> Wales, UK<br />
b<br />
a<br />
b
Literature<br />
1. Gramiak, R.,Shah, P.M., Echocardiography<br />
of the aortic root. Invest Radiol,<br />
1968. 3: 356-366.<br />
2. Scher<strong>in</strong>g, Levovist Monograph. 1996,<br />
London: Churchill Communications Europe.<br />
12.<br />
3. Klibanov, A.L., Ferrara, K.W., Hughes,<br />
M.S., Wible, J.H., Jr., Wojdyla, J.K., Dayton,<br />
P.A., Morgan, K.E.,Brandenburger, G.H.,<br />
Direct video-microscopic observation of<br />
the dynamic effects of medical ultrasound<br />
on ultrasound contrast microspheres. Invest<br />
Radiol, 1998. 33: 863-870.<br />
4. de Jong, N., Fr<strong>in</strong>k<strong>in</strong>g, P.J., Bouakaz, A.,<br />
Goorden, M., Schourmans, T., J<strong>in</strong>gp<strong>in</strong>g,<br />
X.,Mastik, F., Optical imag<strong>in</strong>g of contrast<br />
agent microbubbles <strong>in</strong> an ultrasound<br />
field with a 100-MHz camera. Ultrasound<br />
Med Biol, 2000. 26: 487-492.<br />
5. Chomas, J.E., Dayton, P., Allen, J., Morgan,<br />
K.,Ferrara, K.W., Mechanisms of<br />
contrast agent destruction. IEEE Trans<br />
Ultrason Ferroelectr Freq Control, 2001.<br />
48: 232-248.<br />
6. Uhlendorf, V.,Hoffmann, C., Non l<strong>in</strong>ear<br />
acoustic response of coated microbubbles<br />
<strong>in</strong> diagnostic ultrasound. Proc IEEE:<br />
Ultrason. Symp., 19941559-1562.<br />
7. Bauer, A., Schlief, R., Zomack, M., Urbank,<br />
A.,Niendorf, H.-P., Acoustically<br />
stimulated microbubbles <strong>in</strong> diagnostic<br />
ultrasound: properties and implications<br />
for diagnostic use. 2nd ed. 1997, Lancaster:<br />
Kluwer Academic Publishers.<br />
669-684.<br />
8. Fritsch, T., Heldmann, D.,Re<strong>in</strong>hardt, M.,<br />
The potential of a novel contrast medium,<br />
<strong>in</strong> Ultrasound Contrast <strong>Agents</strong>, B. Goldberg,<br />
Editor. 1997, Mart<strong>in</strong> Dunitz: London.<br />
p. 169-176.<br />
9. Albrecht, T., Blomley, M.J., Cosgrove,<br />
D.O., et al., Non-<strong>in</strong>vasive diagnosis of<br />
hepatic cirrhosis <strong>by</strong> transit-time analysis<br />
of an ultrasound contrast agent. Lancet,<br />
1999. 353: 1579-1583.<br />
10. Bang, N., Nielsen, M.B., Rasmussen,<br />
A.N., Osterhammel, P.A.,Pedersen, J.F.,<br />
Hepatic ve<strong>in</strong> transit time of an ultrasound<br />
contrast agent: simplified procedure<br />
us<strong>in</strong>g pulse <strong>in</strong>version imag<strong>in</strong>g. Br J<br />
Radiol, 2001. 74: 752-755.<br />
11. Sugimoto, H., Kaneko, T., Hirota, M.,<br />
Tezel, E.,Nakao, A., Earlier hepatic ve<strong>in</strong><br />
transit-time measured <strong>by</strong> contrast ultrasonography<br />
reflects <strong>in</strong>trahepatic hemo-<br />
dynamic changes accompany<strong>in</strong>g cirrhosis.<br />
J Hepatol, 2002. 37: 578-583.<br />
12. Blomley, M.J., Albrecht, T., Cosgrove,<br />
D.O., et al., Liver vascular transit time<br />
analyzed with dynamic hepatic venography<br />
with bolus <strong>in</strong>jections of an US contrast<br />
agent: early experience <strong>in</strong> seven patients<br />
with metastases. Radiology, 1998.<br />
209: 862-866.<br />
13. Leen, E., Goldberg, J.A., Angerson,<br />
W.J.,McArdle, C.S., Potential role of<br />
doppler perfusion <strong>in</strong>dex <strong>in</strong> selection of<br />
patients with colorectal cancer for adjuvant<br />
chemotherapy. Lancet, 2000. 355:<br />
34-37.<br />
14. Harvey, C.J., Blomley, M., Lynch, M., Eckersley,<br />
R., Pilcher, J.M.,Cosgrove, D.O.,<br />
Liver vascular transit time measured us<strong>in</strong>g<br />
the carotid delay time with bolus <strong>in</strong>jections<br />
of the microbubble Levovist can<br />
predict the presence of occult liver metastases<br />
<strong>in</strong> colorectal cancer. Radiology,<br />
2001. 221(P): 269.<br />
15. Foster, F.S., Burns, P.N., Simpson, D.H.,<br />
Wilson, S.R., Christopher, D.A.,Goertz,<br />
D.E., Ultrasound for the visualization<br />
and quantification of tumor microcirculation.<br />
Cancer Metastasis Rev, 2000. 19:<br />
131-138.<br />
16. Lafitte, S., Higashiyama, A., Masugata,<br />
H., Peters, B., Strachan, M., Kwan,<br />
O.L.,DeMaria, A.N., Contrast echocardiography<br />
can assess risk area and <strong>in</strong>farct<br />
size dur<strong>in</strong>g coronary occlusion and reperfusion:<br />
experimental validation. J Am Coll<br />
Cardiol, 2002. 39: 1546-1554.<br />
17. Porter, T.R.,Xie, F., Cl<strong>in</strong>ical experience <strong>in</strong><br />
the detection of coronary artery disease<br />
with myocardial contrast echocardiography.<br />
Echocardiography, 2002. 19:<br />
399-407.<br />
18. R<strong>in</strong>gelste<strong>in</strong>, E.B., Echo-enhanced ultrasound<br />
for diagnosis and management <strong>in</strong><br />
stroke patients. Eur J Ultrasound, 1998. 7<br />
Suppl 3: S3-15.<br />
19. Iglseder, B., Patt, C.M., Raffer, E., Hess-<br />
Eberle, I., Huemer, M., Staffen,<br />
W.,Ladurner, G., Verbesserung der<br />
Darstellbarkeit <strong>in</strong>trakranieller Gefäße mit<br />
farbkodierter Duplexsonographie durch<br />
den Echosignalverstärker Levovist. Ultraschall<br />
Med, 2000. 21: 107-111.<br />
20. Gahn, G., Gerber, J., Hallmeyer, S., Hahn,<br />
G., Ackerman, R.H., Reichmann, H.,von<br />
Kummer, R., Contrast-enhanced transcranial<br />
color-coded duplexsonography <strong>in</strong> stroke<br />
patients with limited bone w<strong>in</strong>dows. AJNR<br />
Am J Neuroradiol, 2000. 21: 509-514.<br />
23
24<br />
21. Gebel, M., Caselitz, M., Bowen-Davies,<br />
P.E.,Weber, S., A multicenter, prospective,<br />
open label, randomized, controlled phase<br />
IIIb study of SH U 508 a (Levovist) for<br />
Doppler signal enhancement <strong>in</strong> the portal<br />
vascular system. Ultraschall Med,<br />
1998. 19: 148-156.<br />
22. Leutloff, U.C., Scharf, J., Richter, G.M.,<br />
Libicher, M., Wunsch, A., Schenk,<br />
J.P.,Kauffmann, G.W., Der E<strong>in</strong>satz des Ultraschallkontrastmittels<br />
Levovist <strong>in</strong> der<br />
Nachsorge von Lebertransplantationen.<br />
Radiologe, 1998. 38: 399-404.<br />
23. Gutberlet, M., Venz, S., Neuhaus, R., et<br />
al., Kontrastmittelgestützte Duplexsonographie:<br />
Darstellung der Arteria hepatica<br />
noch orthotopischer Lebertransplantation.<br />
Rofo Fortschr Geb Rontgenstr<br />
Neuen Bildgeb Verfahr, 1997. 166: 411-<br />
416.<br />
24. Uggowitzer, M.M., Kugler, C., Machan,<br />
L., Hausegger, K.A., Groell, R., Quehenberger,<br />
F., L<strong>in</strong>dbichler, F.,Schreyer, H.,<br />
Value of echo-enhanced Doppler sonography<br />
<strong>in</strong> evaluation of transjugular <strong>in</strong>trahepatic<br />
portosystemic shunts. AJR Am<br />
J Roentgenol, 1998. 170: 1041-1046.<br />
25. Albrecht, T., Blomley, M.J., Heckemann,<br />
R.A., et al., Stimulierte akustische Emission<br />
mit dem Ultraschallkontrastmittel<br />
Levovist: e<strong>in</strong> kl<strong>in</strong>isch nutzbarer Effekt mit<br />
leberspezifischen Eigenschaften. Rofo<br />
Fortschr Geb Rontgenstr Neuen Bildgeb<br />
Verfahr, 2000. 172: 61-67.<br />
26. Blomley, M.J., Albrecht, T., Cosgrove,<br />
D.O., et al., Stimulated acoustic emission<br />
to image a late liver and spleen-specific<br />
phase of Levovist <strong>in</strong> normal volunteers<br />
and patients with and without liver disease.<br />
Ultrasound Med Biol, 1999. 25:<br />
1341-1352.<br />
27. Iijima, M., S<strong>in</strong>usoidal endothelium and<br />
microbubble: Kupffer imag<strong>in</strong>g and bioeffect.<br />
Ultrasound <strong>in</strong> Medic<strong>in</strong>e and Biology,<br />
2003. 29: S222.<br />
28. Albrecht, T., Blomley, M.J., Burns, P.N., et<br />
al., Improved detection of hepatic metastases<br />
with pulse-<strong>in</strong>version US dur<strong>in</strong>g the<br />
liver-specific phase of SHU 508A: multicenter<br />
study. Radiology, 2003. 227:<br />
361-370.<br />
29. Albrecht, T., Hoffmann, C.W., Schmitz,<br />
S.A., Schettler, S., Overberg, A., Germer,<br />
C.T.,Wolf, K.J., Phase-<strong>in</strong>version sonography<br />
dur<strong>in</strong>g the liver-specific late phase of<br />
contrast enhancement: improved detection<br />
of liver metastases. AJR Am J<br />
Roentgenol, 2001. 176: 1191-1198.<br />
30. Dalla Palma, L., Bertolotto, M., Quaia,<br />
E.,Locatelli, M., Detection of liver metastases<br />
with pulse <strong>in</strong>version harmonic imag<strong>in</strong>g:<br />
prelim<strong>in</strong>ary results. Eur Radiol,<br />
1999. 9: S382-387.<br />
31. Harvey, C.J., Blomley, M.J., Eckersley, R.J.,<br />
Cosgrove, D.O., Patel, N., Heckemann,<br />
R.A.,Butler-Barnes, J., Hepatic malignancies:<br />
improved detection with pulse-<strong>in</strong>version<br />
US <strong>in</strong> late phase of enhancement<br />
with SH U 508A-early experience. Radiology,<br />
2000. 216: 903-908.<br />
32. Harvey, C.J., Blomley, M.J., Eckersley, R.J.,<br />
Heckemann, R.A., Butler-Barnes, J.,Cosgrove,<br />
D.O., Pulse-<strong>in</strong>version mode imag<strong>in</strong>g<br />
of liver specific microbubbles: improved<br />
detection of subcentimetre<br />
metastases. Lancet, 2000. 355: 807-<br />
808.<br />
33. Albrecht, T., Hoffmann, C.W., Schmitz,<br />
S.A., Schettler, S., Bolze, X.,Wolf, K.J.,<br />
Detection of liver metastases: comparison<br />
of contrast-enhanced phase <strong>in</strong>version<br />
ultrasound and dual phase spiral<br />
CT with <strong>in</strong>traoperative sonographic correlation.<br />
Radiology, 2000. 207(P): 459.<br />
34. Beissert, M., Jenett, M., Keberle, M.,<br />
Kessler, C., Kle<strong>in</strong>, D., Beer, M.,Hahn, D.,<br />
Vergleich von Contrast Harmonic Imag<strong>in</strong>g<br />
im B-Mode mit stimulierter akustischer<br />
Emission, konventionellem B-Mode<br />
US und Spiral-CT <strong>in</strong> der Detektion fokaler<br />
Leberläsionen. Rofo Fortschr Geb Rontgenstr<br />
Neuen Bildgeb Verfahr, 2000.<br />
172: 361-366.<br />
35. Khalili, K., Metser, U.,Wilson, S.R., Hilar<br />
biliary obstruction: prelim<strong>in</strong>ary results<br />
with Levovist-enhanced sonography. AJR<br />
Am J Roentgenol, 2003. 180: 687-693.<br />
36. Bryant, T.H., Blomley, M.J., Albrecht, T.,<br />
et al., Liver phase uptake of a liver specific<br />
microbubble improves characterization<br />
of liver lesions: a prospective multicenter<br />
study. Radiology, 2003. <strong>in</strong> press.<br />
37. Strobel, D., Raeker, S., Martus, P., Hahn,<br />
E.G.,Becker, D., Phase <strong>in</strong>version harmonic<br />
imag<strong>in</strong>g versus contrast-enhanced<br />
power Doppler sonography for the characterization<br />
of focal liver lesions. Int J Colorectal<br />
Dis, 2003. 18: 63-72.<br />
38. Hohmann, J., Skrok, J., Puls, R.,Albrecht,<br />
T., Charakterisierung fokaler Leberläsionen<br />
mit kontrast-mittelgestütztem „low<br />
MI real time" Ultraschall und SonoVue.<br />
Rofo Fortschr Geb Rontgenstr Neuen<br />
Bildgeb Verfahr, 2003. 175: 835-843.<br />
39. Albrecht, T., Overberg, A., Hoffmann,<br />
C.W., Eckersley, R.J., Schmitz, S.A.,Wolf,
K.J., Late phase enhancement patterns<br />
of various benign and malignant liver lesions:<br />
a quantitative study. Radiology,<br />
2000. 207(P): 304-305.<br />
40. von Herbay, A., Vogt, C.,Hauss<strong>in</strong>ger, D.,<br />
Late-phase pulse-<strong>in</strong>version sonography<br />
us<strong>in</strong>g the contrast agent levovist: differentiation<br />
between benign and malignant<br />
focal lesions of the liver. AJR Am J<br />
Roentgenol, 2002. 179: 1273-1279.<br />
41. Radmayr, C., Oswald, J., Klauser, A.,<br />
Bartsch, G.,Frauscher, F., Kontrastmittelverstärkte<br />
Refluxsonographie bei<br />
K<strong>in</strong>dern: E<strong>in</strong> Vergleich zur herkömmlichen<br />
radiologischen Untersuchungstechnik.<br />
Urologe A, 2002. 41: 548-551.<br />
42. Mentzel, H.J., Vogt, S., John, U.,Kaiser,<br />
W.A., Void<strong>in</strong>g urosonography with ultrasonography<br />
contrast medium <strong>in</strong> children.<br />
Pediatr Nephrol, 2002. 17: 272-276.<br />
43. Darge, K., Troeger, J., Duett<strong>in</strong>g, T.,<br />
Zieger, B., Rohrschneider, W., Moehr<strong>in</strong>g,<br />
K., Weber, C.,Toenshoff, B., Reflux <strong>in</strong><br />
young patients: comparison of void<strong>in</strong>g<br />
US of the bladder and retrovesical space<br />
with echo enhancement versus void<strong>in</strong>g<br />
cystourethrography for diagnosis. Radiology,<br />
1999. 210: 201-207.<br />
44. Darge, K., Ghods, S., Zieger, B.,<br />
Rohrschneider, W.,Troeger, J., Reduction<br />
<strong>in</strong> void<strong>in</strong>g cystourethrographies after the<br />
<strong>in</strong>troduction of contrast enhanced sonographic<br />
reflux diagnosis. Pediatr Radiol,<br />
2001. 31: 790-795.<br />
45. Kim, J.H., Eun, H.W., Lee, H.K., Park,<br />
S.J., Sh<strong>in</strong>, J.H., Hwang, J.H., Goo,<br />
D.E.,Choi, D.L., Renal perfusion abnormality.<br />
Coded harmonic angio US with<br />
contrast agent. Acta Radiol, 2003. 44:<br />
166-171.<br />
46. Ascenti, G., Zimbaro, G., Mazziotti, S.,<br />
Gaeta, M., Lamberto, S.,Scribano, E.,<br />
Contrast-enhanced power Doppler US <strong>in</strong><br />
the diagnosis of renal pseudotumors. Eur<br />
Radiol, 2001. 11: 2496-2499.<br />
47. Ascenti, G., Zimbaro, G., Mazziotti, S.,<br />
Gaeta, M., Sett<strong>in</strong>eri, N.,Scribano, E.,<br />
Usefulness of power Doppler and contrast-enhanced<br />
sonography <strong>in</strong> the differentiation<br />
of hyperechoic renal masses.<br />
Abdom Imag<strong>in</strong>g, 2001. 26: 654-660.<br />
48. Hoffmann, C.W., Albrecht, T., Schettler,<br />
S.,Overberg, A., Non-l<strong>in</strong>ear ultrasound<br />
of the spleen dur<strong>in</strong>g the late phase of<br />
Levovist: Improved detection of focal lesions.<br />
<strong>European</strong> Radiology, 2000.<br />
10(suppl1).<br />
49. Dietrich, C.F., Kontrastverstärkte 3D-<br />
Bildgebung unter Echtzeitbed<strong>in</strong>gungen,<br />
e<strong>in</strong>e neue Technik. Rofo Fortschr Geb<br />
Rontgenstr Neuen Bildgeb Verfahr,<br />
2002. 174: 160-163.<br />
50. Catalano, O., Lobianco, R., Sandomenico,<br />
F.,Siani, A., Splenic trauma: evaluation<br />
with contrast-specific sonography<br />
and a second-generation contrast medium:<br />
prelim<strong>in</strong>ary experience. J Ultrasound<br />
Med, 2003. 22: 467-477.<br />
25
Aplio<br />
The most important<br />
requirement for complex<br />
diagnosis and research is<br />
the ability to perform<br />
high-quality exam<strong>in</strong>ations.<br />
Aplio’s groundbreak<strong>in</strong>g<br />
system architecture produces<br />
excellent diagnostic<br />
performance and offers<br />
great potential for new<br />
and advanced applications.<br />
But Aplio has<br />
even more to offer like<br />
<strong>in</strong>novative workflow<br />
management, sophisticated<br />
quantification analysis<br />
tools or communication<br />
and data management<br />
facilities just to name but<br />
a few advantages.
visions<br />
No 6 . Volume 4 . 2004<br />
The little reference guide to<br />
<strong>„Contrast</strong> <strong>Agents</strong> <strong>in</strong> <strong>Sonography“</strong><br />
<strong>by</strong> T. Albrecht and J. Hohmann, Toshiba VISIONS 6/2004,<br />
is very <strong>in</strong>terest<strong>in</strong>g:<br />
� I would like to subscribe to Toshiba VISIONS<br />
� Please send a copy also to:<br />
free of charge<br />
Name:<br />
Name:<br />
Institute:<br />
Institute:<br />
Department:<br />
Department:<br />
Street:<br />
Street:<br />
ZIP-Code, City:<br />
ZIP-Code, City:<br />
Email:<br />
Email:<br />
Please return to: Toshiba Medical Systems Europe, Mr Jack Hoogendoorn<br />
Zilverstraat 1, NL-2718 RP Zoetermeer or via email: visions@tmse.nl
Toshiba VISIONS 6/2004