Download Presentation (PDF) - GN Store Nord
Download Presentation (PDF) - GN Store Nord
Download Presentation (PDF) - GN Store Nord

Create successful ePaper yourself
Turn your PDF publications into a flip-book with our unique Google optimized e-Paper software.
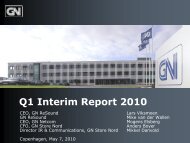
Q2 Interim Report 2010<br />
CEO, <strong>GN</strong> ReSound Lars Viksmoen<br />
CEO, <strong>GN</strong> Netcom Mogens Elsberg<br />
CFO, <strong>GN</strong> <strong>Store</strong> <strong>Nord</strong> Anders Boyer<br />
Director IR & Communications, <strong>GN</strong> <strong>Store</strong> <strong>Nord</strong> Mikkel Danvold<br />
Copenhagen, August 11, 2010
August 11, 2010<br />
Financial Highlights Q2 2010<br />
Continued improvement in revenue and EBITA<br />
• <strong>GN</strong> continued to see clear results of the<br />
comprehensive restructuring<br />
• Positive organic growth for the second<br />
consecutive quarter – fuelled by UC<br />
• Q2 showed strong improvement in<br />
EBITA – up DKK 111 million compared to<br />
Q2 2009<br />
• Revenue and EBITA outlook for 2010<br />
confirmed<br />
• DKK 88 million share buyback program<br />
announced and completed during Q2<br />
Revenue:<br />
DKK 1,286m<br />
EBITA:<br />
DKK 113m<br />
Free cash flow:<br />
DKK 78m<br />
NIBD:<br />
DKK 1,014m<br />
Q2 2009<br />
DKK 1,196m<br />
Q2 2009<br />
DKK 2m<br />
Q2 2009<br />
DKK 89m<br />
Q2 2009<br />
DKK 1,438m<br />
2<br />
Slide 2
August 11, 2010<br />
Additional Highlights<br />
TPSA<br />
• In the DPTG/TPSA arbitration proceedings, <strong>GN</strong> is awaiting a decision from the<br />
Arbitration Tribunal on DPTG’s claim for phase 1 (1994 to mid-2004). The<br />
parties to the DPTG/TPSA arbitration proceedings have been informed by the<br />
Arbitration Tribunal in Vienna that a decision on the award will not be issued<br />
before September 2010 due to logistical reasons<br />
Claim against the Federal Cartel Office<br />
• On May 5, <strong>GN</strong> received the complete wording of the ruling in which the<br />
German Federal Supreme Court declared the decision made by the German<br />
Federal Cartel Office on April 11, 2007 prohibiting the sale of <strong>GN</strong> ReSound to<br />
Sonova unlawful<br />
• <strong>GN</strong> will file a claim against the German Federal Cartel Office claiming<br />
compensation for the losses imposed on <strong>GN</strong> which as of July 2010<br />
amount to around EUR 1 billion<br />
Long-term financial targets<br />
• As mentioned in the Q1 Interim Report 2010, <strong>GN</strong> will announce its aspirations<br />
in regards to long-term financial targets during the fall<br />
3<br />
Slide 3
Capital structure<br />
• It is <strong>GN</strong>’s long-term target to maintain a capital structure consisting of a<br />
combination of debt and equity, subject to a net interest-bearing debt of<br />
up to a maximum of 2.0 x EBITDA<br />
Dividend and share buyback policy<br />
• <strong>GN</strong> aims to pay out a dividend corresponding to 15-25% of the annual<br />
net result<br />
• <strong>GN</strong> will initiate share buyback programs when deemed appropriate<br />
• Dividend payments and share buybacks are subject to among others<br />
cash requirements to support the ongoing operations, strategic<br />
opportunities and capital structure<br />
Plan for the fiscal year 2010<br />
• Based on the expected significant improvement in EBITA for <strong>GN</strong> <strong>Store</strong><br />
<strong>Nord</strong> from DKK 8 million in 2009 to DKK 425-525 million in 2010, the<br />
Board of Directors plans to recommend the initiation of a share buyback<br />
program in addition to a dividend pay-out based on the net result for<br />
2010<br />
• The use of the potential proceeds from TPSA will be dealt with separately<br />
and as a one-time event<br />
4<br />
August 11, 2010<br />
Dividend, Share Buyback & Capital Structure<br />
Slide 4
August 11, 2010<br />
<strong>GN</strong> Netcom<br />
5<br />
Slide 5
(DKK million)<br />
August 11, 2010<br />
<strong>GN</strong> Netcom – Financial Highlights<br />
20% organic growth in Q2, excl OEM<br />
Q1<br />
2009<br />
Q2<br />
2009<br />
Q3<br />
2009<br />
Q4<br />
2009<br />
FY<br />
2009<br />
Q1<br />
2010<br />
6<br />
Q2<br />
2010<br />
Revenue 421 435 412 468 1,736 446 495<br />
Organic growth (36)% (30)% (32)% (19)% (30)% 9% 8%<br />
Gross margin 35% 42% 43% 50% 43% 52% 53%<br />
SG&A, R&D etc. (229) (224) (187) (284) (924) (205) (211)<br />
EBITA (82) (43) (11) (48) (184) 26 52<br />
EBITA margin (19.5)% (9.9)% (2.7)% (10.3)% (10.6)% 5.8% 10.5%<br />
Non-recurring costs 41 36 25 126 228 - -<br />
• Excluding the OEM business, organic growth in Q2 was 20%<br />
• Accelerating deployment of UC<br />
• Strong operational leverage resulting in a double-digit EBITA-margin<br />
Slide 6
August 11, 2010<br />
<strong>GN</strong> Netcom Balance Sheet and Cash Flow<br />
Continued strong cash flow<br />
Balance sheet selected items<br />
(DKK million)<br />
Q1<br />
2009<br />
Q2<br />
2009<br />
Q3<br />
2009<br />
Q4<br />
2009<br />
FY<br />
2009<br />
Q1<br />
2010<br />
7<br />
Q2<br />
2010<br />
Inventories 179 128 101 - 87 74 91<br />
Trade receivables 279 275 270 - 289 265 288<br />
Trade payables 97 118 102 - 140 127 168<br />
Cash flow (DKK million)<br />
Cash flow before working capital 14 34 36 72 156 61 84<br />
Change in working capital &<br />
restructuring/non-recurring costs<br />
paid 49 37 2 (2) 86 11 17<br />
Cash flow from investing activities (20) (25) (25) (20) (90) (13) (19)<br />
Free cash flow excl. tax & financial<br />
items<br />
43 46 13 50 152 59 82<br />
• Net working capital continued to decline and was only DKK 35 million<br />
at the end of Q2. Net working capital is expected to increase during<br />
the remaining part of 2010.<br />
Slide 7
August 11, 2010<br />
Unified Communications<br />
• UC brings together the many disparate communication systems that exist<br />
today – voice, video, collaboration, conferencing, instant messaging, mail<br />
etc<br />
• The first step towards achieving full benefit from UC is voice integration –<br />
which requires a headset solution<br />
• Today, many people have three telephones: a mobile, their landline, and a<br />
soft phone application<br />
• <strong>GN</strong> Netcom helps you achieve true UC, switching seamlessly from one<br />
device to the other<br />
Instant benefits from UC<br />
• Reduce costs<br />
• Telecommunications<br />
• Conferencing<br />
• Travel & commuting<br />
• Real estate<br />
• Supporting environmental initiatives<br />
• Increase productivity and collaboration<br />
• Reduce latency<br />
• Work everywhere and at any time<br />
• Work together across locations<br />
8
400 million<br />
office workers<br />
world wide<br />
August 11, 2010<br />
The UC Market Opportunity<br />
Based on <strong>GN</strong> Netcom’s current 30% share of the CC&O market, UC<br />
translates into a significant CC&O revenue opportunity<br />
• Full benefit of UC requires a headset<br />
solution – headsets becomes part of<br />
the core infrastructure<br />
• UC will drive significantly higher<br />
headset attachment rates<br />
• UC vendors and systems integrators<br />
drive the market<br />
• <strong>GN</strong> Netcom’s revenue from UC<br />
enabled products increased by more<br />
than 50% in Q2 2010 compared to<br />
prior year<br />
Of which 50<br />
million are<br />
using UC<br />
With a 50% headset<br />
attachment<br />
rate<br />
<strong>GN</strong> Netcom CC&O revenue opportunity<br />
2009 2014<br />
DKK 10bn market<br />
in 2014*<br />
* Source: Frost and Sullivan, <strong>GN</strong> estimates<br />
9
August 11, 2010<br />
Broad Deployment of UC in H2 2010<br />
Proof of<br />
concept,<br />
technology is in<br />
place<br />
Projects with<br />
early adaptors<br />
Broad<br />
deployment<br />
H2 2010<br />
2006 2009 2010-12<br />
• Companies are beginning transition towards UC solutions<br />
• Broad deployment is accelerating and is happening now<br />
"Through 2013, 40% of knowledge workers will have<br />
abandoned their desk phones and headsets will<br />
become essential communication tools.”<br />
Analyst Steve Blood,<br />
Gartner Group<br />
10<br />
Slide 10
August 11, 2010<br />
<strong>GN</strong> Netcom UC status<br />
• <strong>GN</strong> Netcom has the largest installed<br />
base of UC devices<br />
• <strong>GN</strong> Netcom is the most experienced<br />
UC headset supplier in the world<br />
• <strong>GN</strong> Netcom has delivered the<br />
world’s largest UC installation in<br />
one single company – close to<br />
100,000 headsets installed<br />
• In Q2 2010, <strong>GN</strong> Netcom won<br />
several very large UC customers<br />
including customers installing more<br />
than 100,000 headsets<br />
• New product portfolio ready to<br />
support Microsoft’s Wave 14<br />
11
August 11, 2010<br />
<strong>GN</strong> Netcom’s UC Strategy<br />
• Win early adopters in the UC market<br />
• Stay in the front and benefit from Jabra’s state-of-the art product<br />
portfolio<br />
• Continued focus on developing user friendly products compatible with<br />
all major UC applications<br />
• Maintain and develop successful partnering with UC vendors and<br />
systems integrators<br />
• Strong focus on new opportunities arising out of the UC development<br />
• Sales focus towards systems integrators<br />
12
August 11, 2010<br />
Plug-and-play with all Leading UC Applications<br />
UC integrates technologies such as voice, email and instant messaging<br />
<strong>GN</strong> Netcom’s UC headsets are plug-and-play with all leading UC applications<br />
13
August 11, 2010<br />
Wide Range of Jabra UC Solutions<br />
Jabra has a wide range of UC ready<br />
audio end-points for all major UC<br />
platforms<br />
Solutions in four categories:<br />
- Corded headsets<br />
- Wireless headsets<br />
- Speakerphones<br />
- Software: Jabra PC suite allows IT<br />
departments to maintain and update<br />
Jabra headsets as any other standard<br />
infrastructure solution.<br />
14
August 11, 2010<br />
New Products from <strong>GN</strong> Netcom<br />
Expansion of the product portfolio – UC speaker phones and<br />
corded mobile headsets<br />
Jabra STONE – now also in<br />
white<br />
Jabra SPEAK TM 410 – your<br />
portable conference room<br />
(launch in October)<br />
During the next few months, Mobile Headsets will enter the market for<br />
corded mobile stereo headsets. The market for corded mobile headsets<br />
constitutes some 20% of the total handsfree market.<br />
15<br />
Slide 15
mDKK<br />
7.000<br />
6.000<br />
5.000<br />
4.000<br />
3.000<br />
2.000<br />
1.000<br />
0<br />
August 11, 2010<br />
Mobile Market and Prospect<br />
Unchanged growth rates – but corded up and Bluetooth mono<br />
down<br />
2009 2010 2011 2012<br />
BT Mono BT Stereo Speakerphones Corded<br />
Source: Strategy analytics, NPD, GFK and team analysis.<br />
Key Trends:<br />
• Mono Bluetooth ® headsets are still<br />
the largest part of the market, but<br />
market value declines slightly<br />
• Significant growth in corded<br />
headsets – constitute 20% of the<br />
market<br />
• Bluetooth ® stereo headsets show<br />
highest growth of all handsfree<br />
categories, although from a low<br />
base<br />
• The speakerphone category makes<br />
up 20% of the total mobile<br />
handsfree market and continues to<br />
grow strongly<br />
16<br />
Slide 16
August 11, 2010<br />
Drivers and Challenges for <strong>GN</strong> Netcom<br />
Key Value Drivers Challenges<br />
• Prospect of significant mid/longterm<br />
market growth from UC.<br />
• No additional investments are<br />
required to participate in the<br />
attractive UC opportunity.<br />
• Attractive margins in the CC&O<br />
industry.<br />
• High operational leverage and<br />
low working capital.<br />
• Very strong product portfolio<br />
from both Mobile and CC&O<br />
Headsets.<br />
• Build a long-term sustainable<br />
business model for Mobile<br />
Headsets.<br />
• Leverage on <strong>GN</strong> Netcom’s strong<br />
UC base and remain a key<br />
player on the UC market.<br />
• Gain market share in North<br />
America.<br />
17<br />
Slide 17
August 11, 2010<br />
<strong>GN</strong> ReSound<br />
ReSound Alera TM<br />
18<br />
Slide 18
August 11, 2010<br />
Continued Focus on Fundamentals<br />
2010 Focus Unchanged<br />
• Competitive new launches based on innovative technology<br />
• Further develop and leverage collaborations with key accounts<br />
• Expand position in Emerging markets<br />
• Continued cost containment except selected growth initiatives<br />
• Accelerate end-to-end supply chain transformation<br />
Achieved YTD<br />
� Positive sales trend development<br />
� Successful nano-coating introduction<br />
� Significant growth with Strategic Accounts including VA<br />
� Launch of first true wireless hearing aid: ReSound Alera with<br />
improved Surround Sound by ReSound technology<br />
� MADSEN AccuScreen TM and AURICAL FreeFit TM launched by <strong>GN</strong><br />
Otometrics<br />
� Supply chain transformation well on track<br />
19<br />
Slide 19
August 11, 2010<br />
<strong>GN</strong> ReSound - Financial Highlights<br />
ReSound broke the negative growth seen during the last 5 quarters<br />
(DKK million)<br />
Q1<br />
2009<br />
Q2<br />
2009<br />
Q3<br />
2009<br />
Q4<br />
2009<br />
FY<br />
2009<br />
Q1<br />
2010<br />
• Revenue in <strong>GN</strong> ReSound improved in Q2 and broke the negative organic<br />
growth seen during the last five quarters.<br />
• <strong>GN</strong> ReSound expects to outgrow the market in the second half of 2010<br />
and therefore confirms the revenue outlook for 2010 provided in the Q1<br />
Interim Report 2010.<br />
• Excluding DKK 19 million costs related to the supply chain transformation,<br />
the EBITA-margin was 10.4%.<br />
20<br />
Q2<br />
2010<br />
Revenue 774 757 693 757 2,981 726 789<br />
Organic growth (4)% (7)% (13)% (3)% (6)% (2)% 0%<br />
Gross margin 62% 61% 60% 60% 61% 59% 59%<br />
SG&A, R&D etc. (448) (405) (364) (367) (1,584) (359) (399)<br />
EBITA 29 54 55 87 225 70 63<br />
EBITA margin 3.7% 7.1% 7.9% 11.4% 7.5% 9.6% 8.0%<br />
Slide 20
August 11, 2010<br />
Positive Sales Trend Development<br />
mDKK<br />
900<br />
850<br />
800<br />
750<br />
700<br />
650<br />
600<br />
<strong>GN</strong> ReSound Revenue<br />
Q1 Q2 Q3 Q4 Q1 Q2 Q3 Q4 Q1 Q2<br />
2008 2009 2010<br />
15%<br />
10%<br />
5%<br />
0%<br />
-5%<br />
-10%<br />
-15%<br />
Organic growth<br />
Q1 Q2 Q3 Q4 Q1 Q2 Q3 Q4 Q1 Q2<br />
2008 2009 2010<br />
• 90% of Top segment sales and 80% of Plus segment sales in Q2<br />
came from products launched within the last 24 months<br />
21<br />
Slide 21
August 11, 2010<br />
<strong>GN</strong> ReSound Balance Sheet & Cash Flow<br />
Inventory increases driven by nano-coating and ReSound Alera<br />
Balance sheet selected items<br />
(DKK million)<br />
Q1<br />
2009<br />
Q2<br />
2009<br />
Q3<br />
2009<br />
Q4<br />
2009<br />
FY<br />
2009<br />
Q1<br />
2010<br />
22<br />
Q2<br />
2010<br />
Inventories 373 332 310 - 288 312 337<br />
Trade receivables 741 687 658 - 705 721 738<br />
Trade payables 155 126 135 - 190 172 202<br />
Cash flow (DKK million)<br />
Cash flow before working capital 100 113 115 149 477 134 133<br />
Change in working capital &<br />
restructuring/non-recurring costs<br />
paid 72 52 48 6 178 (66) (59)<br />
Cash flow from investing activities (75) (61) 16 (77) (197) (42) (82)<br />
Free cash flow excl. tax & financial<br />
items<br />
97 104 179 78 458 26 (8)<br />
• Cash flow impact from investing activities was at DKK (82) million up from<br />
DKK (61) million in Q2 2009 driven by investment in distribution and<br />
production technology/facilities.<br />
Slide 22
August 11, 2010<br />
Solid Long-term Market Growth<br />
Market Volume Drivers<br />
• Ageing population<br />
• Higher prevalence<br />
• Improving adoption rates<br />
• Improving binaural fitting rates<br />
• Additional replacement cycles<br />
• Developing countries’ potential<br />
Solid long-term<br />
market growth<br />
rates expected<br />
Million<br />
units<br />
11<br />
10<br />
9<br />
8<br />
7<br />
6<br />
5<br />
World HI market<br />
2009 2012<br />
23<br />
Slide 23
Canada +4% (Q1)<br />
August 11, 2010<br />
The Market is Growing at Healthy Rates<br />
Hearing aid market unit growth data - 2010 vs. 2009<br />
US Total market +3% (Q2)<br />
VA market +12%<br />
Private market +1%<br />
UK Total market -18% (Q1)<br />
UK NHS -22%<br />
UK private +2%<br />
Netherlands +12% (Q2)<br />
Italy +9% (Q2)<br />
Germany +15% (Q2)<br />
France +9% (Q1)<br />
Japan +3% (Q2)<br />
New Zealand +5% (Q1) 24<br />
24
August 11, 2010<br />
ReSound Alera TM<br />
Groundbreaking advance in wireless<br />
ReSound Alera<br />
• Improved Surround Sound<br />
by ReSound TM<br />
• Breakthrough technology<br />
- first truly wireless connectivity<br />
- with nothing to wear around your neck!<br />
• Slim, small with award-winning design<br />
With ReSound Unite wireless accessories<br />
25<br />
Slide 25
August 11, 2010<br />
iSolate Nanotech Introduction<br />
Water-repellent and ”wear & tear proof” products<br />
• ReSound Live and dot 2 by ReSound recently introduced<br />
with iSolate nano-coating at AudiologyNOW! 2010.<br />
• The technology provides the best protection in the<br />
industry, with every component – internally and<br />
externally – coated.<br />
• More than 90% of all Behind-The-Ear (BTE) instruments<br />
manufactured by <strong>GN</strong> ReSound now come with a<br />
hypoallergenic nano-layer of protective coating.<br />
All of these benefits are achieved while maintaining the<br />
superior ReSound sound quality.<br />
26<br />
Slide 26
August 11, 2010<br />
Supply Chain Transformation<br />
Progressing as planned<br />
• End-to-end transformation is progressing as planned<br />
A major milestone was reached with the recent opening of a new<br />
regional operations center in Oxford, UK.<br />
• All critical global systems and infrastructure are expected to be in<br />
place already by the end of 2010 and subsequently production and<br />
customers will gradually be converted to the new set-up.<br />
• The expected cost reductions are equivalent to a further<br />
improvement of <strong>GN</strong> ReSound's EBITA margin by 6-7%-points at<br />
unchanged revenue level.<br />
The transformation builds on three pillars<br />
Manufacturing Warehousing Service & Repairs<br />
27<br />
Slide 27
August 11, 2010<br />
2010 Focus per Area remain<br />
North America<br />
• Win top end share<br />
• Grow share in Veterans Affairs<br />
• Expand distribution<br />
• Grow and protect market share<br />
in Canada<br />
APAC/Emerging markets<br />
• China and India expansion strategy<br />
• Optimize key account management<br />
in more mature markets<br />
Europe<br />
• Refocus Germany and France<br />
• Grow Strategic Accounts<br />
• EuroShape – focus on sales & marketing<br />
<strong>GN</strong> Otometrics<br />
• China strategy execution<br />
• Launch new products<br />
in fitting and new screening category<br />
• Global launch of product roadmap<br />
28<br />
Slide 28
August 11, 2010<br />
Drivers and Challenges for <strong>GN</strong> ReSound<br />
Key Value Drivers Challenges<br />
• Solid long-term market growth<br />
in an industry with attractive<br />
margins<br />
• Leverage attractive partner<br />
strategy<br />
• Strong position in Emerging<br />
markets<br />
• Strengthening of position with<br />
VA<br />
• Scalable and competitive cost<br />
base<br />
• Continued innovation resulting in<br />
new and groundbreaking<br />
products<br />
• Comprehensive transformation<br />
of the supply chain in 2010<br />
• Pressure on average prices<br />
• Win top end share<br />
• Shorter product life cycles,<br />
demanding more effective R&D<br />
• Outgrow competition with no<br />
growth in spending<br />
29<br />
Slide 29
August 11, 2010<br />
Outlook for 2010<br />
<strong>GN</strong> confirms outlook provided in Q1 Interim Report 2010<br />
Revenue (DKK/USD 5.5)<br />
<strong>GN</strong> Netcom’s organic revenue growth for 2010<br />
is expected to be at least 5%.<br />
<strong>GN</strong> ReSound’s revenue is expected to show<br />
positive organic growth for 2010.<br />
<strong>GN</strong>’s total revenue is expected to show positive<br />
organic growth of 3-5%.<br />
EBITA<br />
<strong>GN</strong> Netcom DKK 150-200 million<br />
<strong>GN</strong> ReSound DKK 300-350 million<br />
Other Around DKK (30) million<br />
<strong>GN</strong> Total DKK 425-525 million<br />
Amortization, finance etc. DKK ~(50) million<br />
DKK million<br />
500<br />
400<br />
300<br />
200<br />
100<br />
0<br />
EBITA<br />
2006 2007 2008 2009 2010<br />
Outlook<br />
30<br />
Slide 30
August 11, 2010<br />
Safe Harbour Statement<br />
The forward-looking statements in this interim report reflect<br />
management's current expectations of certain future events and<br />
financial results. Statements regarding 2010 are, of course, subject<br />
to risks and uncertainties which may result in material deviations<br />
from the outlook set forth. Furthermore, some of these<br />
expectations are based on assumptions regarding future events<br />
which may prove incorrect.<br />
Factors that may cause actual results to deviate materially from<br />
expectations include – but are not limited to – general economic<br />
developments and developments in the financial markets,<br />
technological developments, changes and amendments to<br />
legislation and regulations governing <strong>GN</strong>’s markets, changes in the<br />
demand for <strong>GN</strong>'s products, competition, fluctuations in subcontractor<br />
supplies and developments in ongoing litigation<br />
(including but not limited to class action and patent infringement<br />
litigation in the United States).<br />
This interim report, announcement or presentation should not be<br />
considered an offer to sell or buy securities in <strong>GN</strong> <strong>Store</strong> <strong>Nord</strong>.<br />
31<br />
Slide 31
Q2 Interim Report 2010<br />
Q&A
(DKK million)<br />
August 11, 2010<br />
Profit and Loss<br />
FY<br />
2008<br />
Q1<br />
2009<br />
Q2<br />
2009<br />
Q3<br />
2009<br />
Q4<br />
2009<br />
FY<br />
2009<br />
Q1<br />
2010<br />
33<br />
Q2<br />
2010<br />
Revenue 5,624 1,198 1,196 1,108 1,227 4,729 1,174 1,286<br />
Gross Profit 2,901 627 644 598 692 2,561 662 727<br />
SG&A, R&D etc. (2,836) (692) (642) (553) (666) (2,553) (576) (614)<br />
EBITA 65 (65) 2 45 26 8 86 113<br />
Amort., finance,<br />
associates etc.<br />
(148) (54) (13) 83 (25) (9) (7) (9)<br />
EBT (83) (119) (11) 128 1 (1) 79 104<br />
Slide 33
(DKK million)<br />
August 11, 2010<br />
Balance Sheet & Cash Flow<br />
End<br />
Q2/2009<br />
End<br />
Q3/2009<br />
End<br />
Q4/2009<br />
End<br />
Q1/2010<br />
End<br />
Q2/2010<br />
Goodwill 2,651 2,563 2,605 2,754 2,991<br />
Other intangible assets 1,169 1,158 1,157 1,158 1,184<br />
Tangible & other noncurrent<br />
assets 1,414 1,389 1,344 1,349 1,402<br />
Current assets 2,265 2,034 2,029 2,099 2,250<br />
Equity 4,427 4,445 4,435 4,684 5,006<br />
Liabilities 3,072 2,699 2,700 2,676 2,821<br />
Total assets/liabilities 7,499 7,144 7,135 7,360 7,827<br />
NIBD 1,438 1,135 1,029 987 1,014<br />
Free cash flow 89 305 566 58 78<br />
34<br />
Slide 34