PDF, 3.2 MB - Pfleiderer AG
PDF, 3.2 MB - Pfleiderer AG
PDF, 3.2 MB - Pfleiderer AG

You also want an ePaper? Increase the reach of your titles
YUMPU automatically turns print PDFs into web optimized ePapers that Google loves.
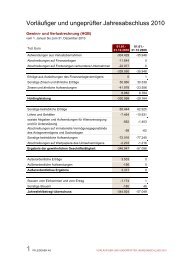
Key Figures<br />
2004 2003<br />
No. of shares 42,685,000 42,685,000<br />
Market capitalization as of Dec. 31 in million euros 362.40 227.51<br />
Price as of Dec. 31 (Xetra) euros 8.49 5.33<br />
High/low euros 8.52/3.93 5.33/1.65<br />
Dividend euros 0.00 0.00<br />
EPS euros 0.79 –1.07<br />
Av. daily trading 67,623 34,575<br />
During the summer break in the third quarter, profit-taking by some investors following publication<br />
of the first-half figures at the beginning of August pushed the price back, consolidating it for<br />
a while at 6.00 euros during low trading.<br />
However, the fourth quarter saw the share pick up again during higher trading, reaching a peak<br />
of 8.52 euros in December 2004. Market capitalization of the <strong>Pfleiderer</strong> Group increased to<br />
363.7 million euros, the share having clearly outperformed the SDAX.<br />
Trading in the <strong>Pfleiderer</strong> Share<br />
Around 17.3 million shares of <strong>Pfleiderer</strong> <strong>AG</strong> with a value of 107 million euros were traded in fiscal<br />
2004 in the Xetra electronic trading system and on the floor of the Frankfurt Stock Exchange.<br />
Turnover per trading day averaged 67,623. The weakest month was August 2004 averaging 29,429<br />
shares, while October 2004 was the month with the highest trading, averaging 115,642 shares<br />
per trading day.<br />
Earnings per Share/Dividend<br />
Earnings per share (EPS) are calculated from the Group’s net income/loss for the year divided<br />
by the weighted average of issued shares. In fiscal 2004, the <strong>Pfleiderer</strong> Group achieved an EPS<br />
of 0.79 euros as against –1.07 euros in the previous year. This result includes one-off earnings<br />
from the disposal of the Business Units Poles & Towers USA and Europe. Accordingly, this report<br />
also shows EPS excluding this one-off effect: EPS for continued operations increased from<br />
0.10 euro in 2003 to 0.13 euro in 2004.<br />
56