PDF, 3.2 MB - Pfleiderer AG
PDF, 3.2 MB - Pfleiderer AG PDF, 3.2 MB - Pfleiderer AG
Multi-Year Summary 130 2004 2003 2003 2002 2001 as of proforma as of as of as of as of ‘000 euros (US-GAAP) Dec. 31, 2004 Dec 31, 2004 1) Dec 31, 2003 Dec 31, 2002 Dec 31, 2001 Balance sheet ratios Assets Current assets Liquid funds and short-term securities 82,728 67,154 68,735 58,255 61,914 Inventories 104,554 101,173 133,716 114,397 192,909 Other current assets 88,766 89,081 108,806 157,245 277,439 Assets of discontinued operations 4,940 106,388 14,731 35,045 – Fixed assets Property, plant and equipment 328,283 299,279 331,054 381,546 580,326 Intangible assets 93,751 92,643 95,950 102,435 70,401 Financial assets 17,625 2,218 2,231 2,072 3,841 Other fixed assets 18,885 21,320 24,033 36,440 – Liabilities and stockholders’ equity Accruals Accruals for pensions 60,420 57,825 62,414 61,263 56,275 Other accruals 69,171 38,492 46,396 41,306 105,560 Financial liabilities 205,677 322,992 329,465 365,488 565,310 Other liabilities 146,051 148,248 169,935 194,798 236,787 Liabilities of discontinued operations 17,090 72,468 31,816 23,314 – Stockholders’ equity and minority interests 241,123 139,231 139,230 201,266 222,898 Balance sheet total 739,532 779,256 779,256 887,435 1,186,830 As share of balance sheet total Fixed assets (asset intensity) 62.0% 53.3% 58.2% 58.9% 55.2% Current assets 38.0% 46.7% 41.8% 41.1% 44.8% Stockholders’ equity including minority interests 32.6% 17.9% 17.9% 22.7% 18.8% Financial debt 27.8% 41.5% 42.3% 41.2% 47.6% Ratios Property, plant and equipment financed by equity 73.5% 46.5% 42.1% 52.8% 38.4% Fixed assets financed by equity 52.6% 33.5% 30.7% 38.5% 34.1% Fixed assets and inventories financed by equity 42.8% 27.0% 23.7% 31.6% 26.3%
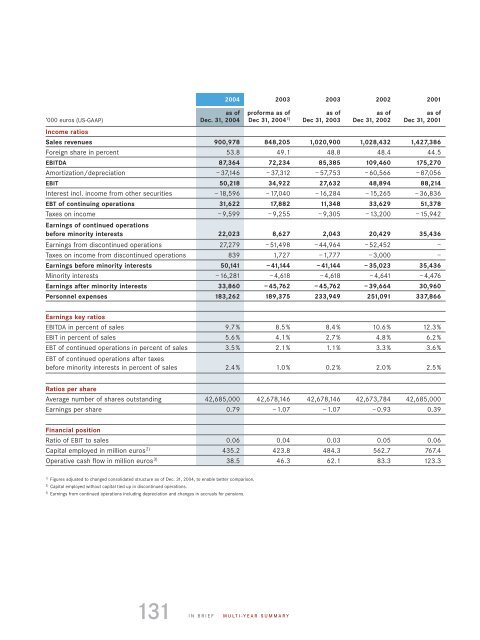
Income ratios Sales revenues 900,978 848,205 1,020,900 1,028,432 1,427,386 Foreign share in percent 53.8 49.1 48.8 48.4 44.5 EBITDA 87,364 72,234 85,385 109,460 175,270 Amortization/depreciation –37,146 –37,312 –57,753 –60,566 –87,056 EBIT 50,218 34,922 27,632 48,894 88,214 Interest incl. income from other securities –18,596 –17,040 –16,284 –15,265 –36,836 EBT of continuing operations 31,622 17,882 11,348 33,629 51,378 Taxes on income –9,599 –9,255 –9,305 –13,200 –15,942 Earnings of continued operations before minority interests 22,023 8,627 2,043 20,429 35,436 Earnings from discontinued operations 27,279 –51,498 –44,964 –52,452 – Taxes on income from discontinued operations 839 1,727 –1,777 –3,000 – Earnings before minority interests 50,141 –41,144 –41,144 –35,023 35,436 Minority interests –16,281 –4,618 –4,618 –4,641 –4,476 Earnings after minority interests 33,860 –45,762 –45,762 –39,664 30,960 Personnel expenses 183,262 189,375 233,949 251,091 337,866 Earnings key ratios EBITDA in percent of sales 9.7% 8.5% 8.4% 10.6% 12.3% EBIT in percent of sales 5.6% 4.1% 2.7% 4.8% 6.2% EBT of continued operations in percent of sales 3.5% 2.1% 1.1% 3.3% 3.6% EBT of continued operations after taxes before minority interests in percent of sales 2.4% 1.0% 0.2% 2.0% 2.5% Ratios per share Average number of shares outstanding 42,685,000 42,678,146 42,678,146 42,673,784 42,685,000 Earnings per share 0.79 –1.07 –1.07 –0.93 0.39 Financial position Ratio of EBIT to sales 0.06 0.04 0.03 0.05 0.06 Capital employed in million euros 2) 435.2 423.8 484.3 562.7 767.4 Operative cash flow in million euros 3) 38.5 46.3 62.1 83.3 123.3 1) Figures adjusted to changed consolidated structure as of Dec. 31, 2004, to enable better comparison. 2) Capital employed without capital tied up in discontinued operations. 3) Earnings from continued operations including depreciation and changes in accruals for pensions. 131 2004 2003 2003 2002 2001 as of proforma as of as of as of as of ‘000 euros (US-GAAP) Dec. 31, 2004 Dec 31, 2004 1) Dec 31, 2003 Dec 31, 2002 Dec 31, 2001 IN BRIEF MULTI-YEAR SUMMARY
- Page 83 and 84: Property, Plant and Equipment Prope
- Page 85 and 86: Accruals for Pensions and Similar O
- Page 87 and 88: 1. Liquid funds 2. Securities class
- Page 89 and 90: 7. Intangible assets As in the prev
- Page 91 and 92: 11. Financial liabilities 12. Other
- Page 93 and 94: 16. Long-term deferred income 17. D
- Page 95 and 96: 18. Stockholders’ equity The foll
- Page 97 and 98: Stock Appreciation Rights 2000 Unde
- Page 99 and 100: 20. Derivative financial instrument
- Page 101 and 102: Derivative financial instruments ar
- Page 103 and 104: The following table reconciles the
- Page 105 and 106: 22. Pensions and similar obligation
- Page 107 and 108: The following table explains the ch
- Page 109 and 110: 1. Contingent liabilities VII. Othe
- Page 111 and 112: 3. Pending litigation and claims 4.
- Page 113 and 114: Geographical Information Sales Reve
- Page 115 and 116: 1. Leases 2. Valuation of inventori
- Page 117 and 118: 8. Discontinued operations Under US
- Page 119 and 120: Accumulated amortization/depreciati
- Page 121 and 122: Pfleiderer track systems B.V. Deven
- Page 123 and 124: 119
- Page 125 and 126: Pfleiderer AG Statement of Income 2
- Page 127 and 128: Accumulated amortization/depreciati
- Page 129 and 130: Hanno C. Fiedler Chairman of the ma
- Page 131 and 132: Economic Glossary Asset deal Descri
- Page 133: P Particleboard 30, 32, 34, 43, 54
- Page 137 and 138: Financial Calendar 2005 April 7, 20
- Page 139 and 140: July Pfleiderer track systems wins
Income ratios<br />
Sales revenues 900,978 848,205 1,020,900 1,028,432 1,427,386<br />
Foreign share in percent 53.8 49.1 48.8 48.4 44.5<br />
EBITDA 87,364 72,234 85,385 109,460 175,270<br />
Amortization/depreciation –37,146 –37,312 –57,753 –60,566 –87,056<br />
EBIT 50,218 34,922 27,632 48,894 88,214<br />
Interest incl. income from other securities –18,596 –17,040 –16,284 –15,265 –36,836<br />
EBT of continuing operations 31,622 17,882 11,348 33,629 51,378<br />
Taxes on income –9,599 –9,255 –9,305 –13,200 –15,942<br />
Earnings of continued operations<br />
before minority interests 22,023 8,627 2,043 20,429 35,436<br />
Earnings from discontinued operations 27,279 –51,498 –44,964 –52,452 –<br />
Taxes on income from discontinued operations 839 1,727 –1,777 –3,000 –<br />
Earnings before minority interests 50,141 –41,144 –41,144 –35,023 35,436<br />
Minority interests –16,281 –4,618 –4,618 –4,641 –4,476<br />
Earnings after minority interests 33,860 –45,762 –45,762 –39,664 30,960<br />
Personnel expenses 183,262 189,375 233,949 251,091 337,866<br />
Earnings key ratios<br />
EBITDA in percent of sales 9.7% 8.5% 8.4% 10.6% 12.3%<br />
EBIT in percent of sales 5.6% 4.1% 2.7% 4.8% 6.2%<br />
EBT of continued operations in percent of sales 3.5% 2.1% 1.1% 3.3% 3.6%<br />
EBT of continued operations after taxes<br />
before minority interests in percent of sales 2.4% 1.0% 0.2% 2.0% 2.5%<br />
Ratios per share<br />
Average number of shares outstanding 42,685,000 42,678,146 42,678,146 42,673,784 42,685,000<br />
Earnings per share 0.79 –1.07 –1.07 –0.93 0.39<br />
Financial position<br />
Ratio of EBIT to sales 0.06 0.04 0.03 0.05 0.06<br />
Capital employed in million euros 2) 435.2 423.8 484.3 562.7 767.4<br />
Operative cash flow in million euros 3) 38.5 46.3 62.1 83.3 123.3<br />
1) Figures adjusted to changed consolidated structure as of Dec. 31, 2004, to enable better comparison.<br />
2) Capital employed without capital tied up in discontinued operations.<br />
3) Earnings from continued operations including depreciation and changes in accruals for pensions.<br />
131<br />
2004 2003 2003 2002 2001<br />
as of proforma as of as of as of as of<br />
‘000 euros (US-GAAP) Dec. 31, 2004 Dec 31, 2004 1) Dec 31, 2003 Dec 31, 2002 Dec 31, 2001<br />
IN BRIEF MULTI-YEAR SUMMARY


