

Stream-Profile Analyses Using a Step-Backwater Model for ... - USGS
Stream-Profile Analyses Using a Step-Backwater Model for ... - USGS
Stream-Profile Analyses Using a Step-Backwater Model for ... - USGS

You also want an ePaper? Increase the reach of your titles
YUMPU automatically turns print PDFs into web optimized ePapers that Google loves.
58 <strong>Stream</strong>-<strong>Profile</strong> <strong>Analyses</strong> <strong>Using</strong> a <strong>Step</strong>-<strong>Backwater</strong> <strong>Model</strong> <strong>for</strong> Selected Reaches in the Chippewa Creek Basin in Ohio<br />
Elevation, in feet above North American Vertical Datum of 1988<br />
1,000<br />
995<br />
990<br />
985<br />
980<br />
975<br />
970<br />
965<br />
960<br />
955<br />
950<br />
945<br />
940<br />
935<br />
930<br />
Railroad<br />
N Lawrence Rd / Deerfield Rd / S 2nd Ave<br />
SR 21 / Great Lakes Blvd<br />
Railroad<br />
Black Diamond Rd / Bieri Rd<br />
Coal Bank Rd<br />
Porr Rd / Twp Rd 261<br />
SR 95 / SR 585 / Akron Rd / Mt Eaton Rd<br />
SR 57 / Wadsworth Rd<br />
S Main St<br />
Low head dam<br />
River Styx<br />
Little Chippewa Creek<br />
Private drive<br />
Blough Rd<br />
Shorle Rd<br />
Frick Rd / Twp Rd 215<br />
Seville Rd / Co Hwy 60<br />
Sterling Rd / Co Hwy 504<br />
Miller Rd / Chestnut Rd<br />
Railroad<br />
Doylestown Rd<br />
0 10,000 20,000 30,000 40,000 50,000 60,000 70,000 80,000 90,000 100,000 110,000 120,000<br />
Mill Rd<br />
SR 3 / West Main St<br />
Distance upstream of mouth, in feet<br />
I-76 / SR 224<br />
Greenwich Rd<br />
Pipeline<br />
I-71<br />
Westfield Ditch<br />
Buffham Rd / Twp Rd 72<br />
Kennard Rd<br />
Low head dam<br />
WS elevation<br />
Chippewa Rd<br />
EXPLANATION<br />
WS elev after 5% reduction<br />
to the channel n<br />
WS elev after 10% reduction<br />
to the channel n<br />
WS elev after 15% reduction<br />
to the channel n<br />
WS elev after 20% reduction<br />
to the channel n<br />
Minimum channel elevation<br />
Hydraulic structure<br />
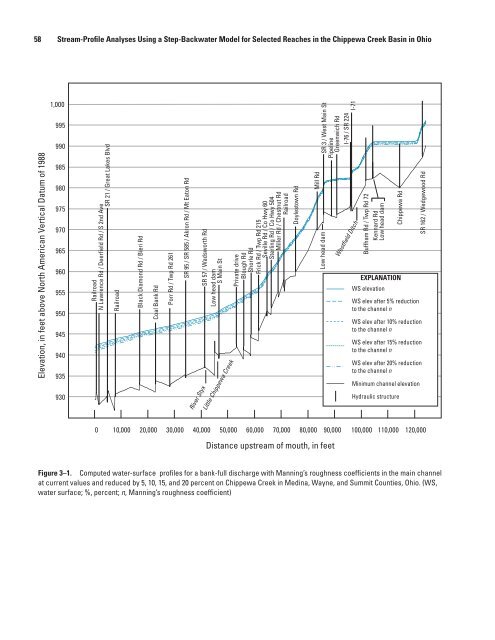
Figure 3–1. Computed water-surface profiles <strong>for</strong> a bank-full discharge with Manning’s roughness coefficients in the main channel<br />
at current values and reduced by 5, 10, 15, and 20 percent on Chippewa Creek in Medina, Wayne, and Summit Counties, Ohio. (WS,<br />
water surface; %, percent; n, Manning’s roughness coefficient)<br />
Low head dam<br />
SR 162 / Wedgewood Rd


