Offshore Wind Arrives. Will Renewables Prosper? - Standard & Poor's
Offshore Wind Arrives. Will Renewables Prosper? - Standard & Poor's
Offshore Wind Arrives. Will Renewables Prosper? - Standard & Poor's

Create successful ePaper yourself
Turn your PDF publications into a flip-book with our unique Google optimized e-Paper software.
Bottom Lines Placed Here<br />
Placed Here (p. xx)<br />
Bottom Lines Placed Here<br />
Placed Here (p. xx)<br />
| Multimedia Edition<br />
CreditWeek ®<br />
The Global Authority On Credit Quality | May 23, 2012<br />
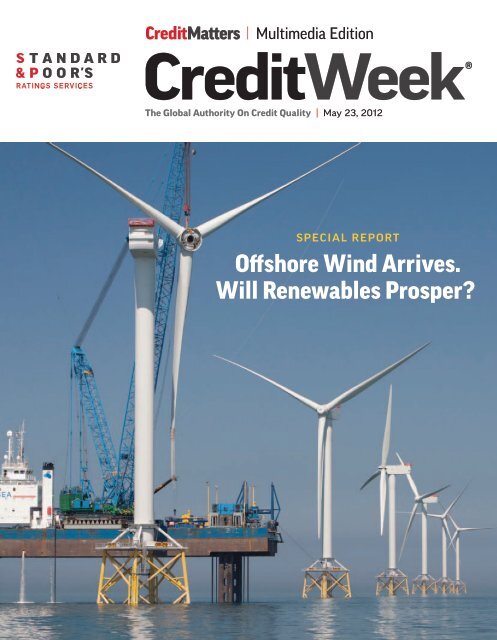
Special RepoRt<br />
<strong>Offshore</strong> <strong>Wind</strong> <strong>Arrives</strong>.<br />
<strong>Will</strong> <strong>Renewables</strong> <strong>Prosper</strong>?<br />
Bottom Lines Placed Here<br />
Placed Here (p. xx)<br />
Bottom Lines Placed Here<br />
Placed Here (p. xx)
COVER IMAGE: CORBIS/ANTHONY WEST<br />
CONTENTS<br />
2 www.creditweek.com<br />
May 23, 2012 | Volume 32, No. 19<br />
SPECIAL REPORT<br />
Renewable Energy Requires Renewable—<br />
And Plentiful—Funding To Meet Global Policy Goals<br />
By Terry A. Pratt, New York<br />
8 Strong Growth Of Global <strong>Offshore</strong> <strong>Wind</strong> Power<br />
Needs Substantial Investment<br />
By Terry A. Pratt, New York<br />
Electricity comes from many sources, but there is one<br />
source that only a few countries in Western Europe,<br />
along with China, take advantage of, and it is in<br />
growing abundance: offshore wind power. The<br />
industry began in Sweden and Denmark in 1991 but<br />
had not grown significantly until recently. Countries<br />
are increasingly relying on offshore wind power to<br />
help meet social and economic policies over the next<br />
decade, but the investment required is immense.<br />
18 Basel III And Solvency II Regulations Could Bring<br />
A Sea Change In Global Project Finance Funding<br />
By Trevor D’Olier-Lees, New York<br />
Banking institutions have<br />
traditionally dominated global<br />
project finance lending.<br />
And while traditions can<br />
be tough to change, we<br />
believe stricter regulations<br />
governing bank<br />
lending under<br />
Basel III—the<br />
Basel Committee<br />
on Banking<br />
Supervision’s global standards for banks’ liquidity<br />
and capital adequacy—will bring profound changes to<br />
the global project finance sector and the ways it<br />
pursues funding.<br />
4<br />
Not long ago, investment in renewable energy seemed like a low-risk<br />
proposition with politically supported goals of increasing energy<br />
independence and security, mitigating climate change, and creating<br />
jobs. Countries worldwide adopted policies to aid investment.<br />
Unfortunately, budget constraints and financial crises have introduced<br />
an element of uncertainty into the future of renewable energy.<br />
23 Support For Renewable Energy Inches<br />
Ahead While Global Energy Demand<br />
Grows By Leaps And Bounds<br />
By Beth Ann Bovino, New York<br />
With energy consumption<br />
worldwide projected to roughly<br />
double in the next 35 years,<br />
conventional wisdom says renewable<br />
sources of power will play a big role in<br />
meeting demand. The conventional wisdom may be<br />
wrong. Cost, feasibility, and political wrangling all stand<br />
in the way of near-term renewable-energy expansion,<br />
globally and in the U.S.<br />
26 U.S. <strong>Offshore</strong> <strong>Wind</strong> Investment Needs More<br />
Than A Short-Term Production Tax Credit Fix<br />
By Terry A. Pratt, New York<br />
Renewable energy sources usually produce electricity<br />
more cheaply than conventional fuels that supply<br />
most markets. Investment in renewable energy<br />
depends on government support. The U.S. wind power<br />
industry is trying to get Congress to continue the<br />
main source of federal support, the production tax<br />
credit, beyond 2012. Without the tax credit,<br />
investment drops quickly.<br />
CREDIT FAQ<br />
32 Why Regulatory Risk Hinders Renewable<br />
Energy Projects In Europe<br />
By Jose R. Abos, Madrid<br />
Ambitious targets for clean energy generation in the EU<br />
have put renewable energy at the forefront of<br />
discussions about meeting Europe’s energy needs. And<br />
political reactions to the nuclear crisis in Japan—which<br />
prompted Germany, for example, to shift its energy policy<br />
toward renewables and away from nuclear—are also<br />
fueling the interest in renewable energy. But regulatory<br />
risk is becoming a bigger issue for these projects.
37 After A Decade Of <strong>Wind</strong> Power,<br />
The Unexpected Is Still Always Expected<br />
By Grace D. Drinker, San Francisco<br />
The U.S. and Europe have undergone big shifts in<br />
their emphasis on renewable energy. <strong>Wind</strong> power<br />
has developed into the renewable technology of<br />
choice, given its superior economics. Comparing 10<br />
years of these projects’ actual performance to<br />
original expectations has helped us to better<br />
understand why their cash flow is so volatile.<br />
41 <strong>Will</strong> Securitization Help Fuel The<br />
U.S. Solar Power Industry?<br />
By Andrew J. Giudici, New York<br />
As the U.S. solar power industry expands,<br />
developers will need<br />
financing to fund their<br />
growth. Securitization—<br />
a financing technique<br />
that aggregates pools<br />
of assets, financial<br />
contracts, or loans, and<br />
through a structuring<br />
process transforms their<br />
future cash flows into a<br />
security—may be a<br />
viable option for<br />
developers that wish to<br />
monetize cash flows from future lease or power<br />
purchase agreement payments.<br />
CREDIT FAQ<br />
45 Could Spain’s Halt On Renewable Energy<br />
Incentives Take The <strong>Wind</strong> Out Of Projects,<br />
Developers, And Utilities?<br />
49 Can Gas Smooth Australia’s Transition From Coal<br />
Or <strong>Will</strong> <strong>Renewables</strong> Leap Ahead?<br />
MULTIMEDIA<br />
9 CMTV: <strong>Offshore</strong> <strong>Wind</strong> <strong>Arrives</strong>: Exploring The Credit<br />
Issues For Renewable Energy Projects<br />
18 CMTV: Basel III: How It <strong>Will</strong> Reshape The Playing<br />
Field For Global Project Finance Funding<br />
27 CMTV: Government Support For <strong>Offshore</strong> <strong>Wind</strong><br />
Investment Creates A Big Opportunity For Global<br />
Project Finance<br />
37 CMTV: Why U.S. And European <strong>Wind</strong> Power<br />
Projects Have Faced Rough Sailing<br />
<strong>Standard</strong> & Poor’s Ratings Services CreditWeek | May 23, 2012 3
FEATURES<br />
4 www.creditweek.com<br />
SPECIAL REPORT
Renewable Energy<br />
Requires Renewable—<br />
And Plentiful—Funding To<br />
Meet Global Policy Goals<br />
Overview<br />
● Support schemes take various forms, and all are subject to long-term fiscal<br />
constraints.<br />
● Some asset classes will likely retain more support than others in times of fiscal<br />
constraint.<br />
● U.S. budgetary constraints are hampering renewable projects that rely on the<br />
federal production tax credit (PTC), especially wind power.<br />
● <strong>Standard</strong> & Poor’s thinks strong growth in the renewable-energy sector will<br />
require new investment sources, such as pension funds and capital markets, and<br />
more private equity.<br />
Not long ago, investment in all renewable-energy asset<br />
classes seemed like a low-risk proposition with politically<br />
supported goals of increasing energy independence and<br />
security, mitigating climate change, and, more recently, creating<br />
jobs. Countries worldwide have been adopting policies to aid<br />
investment in renewable-energy technologies despite strong<br />
opposition in many to the high cost of such programs. European<br />
policies have been supportive for years. The U.S. has provided<br />
more limited support for renewable energy but has recently<br />
added stimulus spending for it. China has been building such<br />
projects rapidly to counter its high reliance on coal, and Australia<br />
is about to introduce a carbon tax that will spur renewableenergy<br />
investment. Unfortunately, budget constraints and<br />
financial crises have introduced an element of uncertainty into<br />
the future of renewable energy, especially in Europe and the U.S.<br />
<strong>Standard</strong> & Poor’s Ratings Services CreditWeek | May 23, 2012 5
FEATURES<br />
6 www.creditweek.com<br />
SPECIAL REPORT<br />
Support schemes take various forms, such<br />
as subsidies (direct support) and usage<br />
requirements and carbon taxes (indirect<br />
support), all of which are subject to longterm<br />
fiscal constraints. Governments want<br />
to keep electricity rates low to help economic<br />
recovery, and many countries and<br />
U.S. states such as California are committed<br />
to mitigating climate change and<br />
creating “green” jobs, so continued investment<br />
is critical. Limitations on the government’s<br />
ability to provide support suggest<br />
that it will be reallocated to more efficient,<br />
larger-scale technologies. This greater<br />
focus might expand the investor pool and<br />
add sustainability to the industry.<br />
<strong>Standard</strong> & Poor’s Ratings Services<br />
believes some asset classes will likely retain<br />
more support than others in times of fiscal<br />
constraint. The U.K. and Germany strongly<br />
support offshore wind to meet climatechange<br />
and jobs goals (see “Strong Growth<br />
Of Global <strong>Offshore</strong> <strong>Wind</strong> Power Needs<br />
Substantial Investment,” on p. 16). By 2014,<br />
the U.K. will have more than 4,000<br />
megawatts (MW) of offshore wind capacity,<br />
up from just over 500 MW in 2008. And<br />
Germany’s decision to retire its nuclear<br />
plants, which provide about one-quarter of<br />
its electricity, will require more investment<br />
in renewable energy, particularly offshore<br />
wind. The factors that make offshore wind<br />
projects attractive globally are that they can<br />
be very large and take advantage of wind<br />
regimes that are often far superior to those<br />
on land. And, offshore projects are increasingly<br />
being built in deeper water, and therefore<br />
farther from public view.<br />
Solar Power Has Had<br />
Some Dark Days<br />
As relatively new as the industry is on a<br />
big scale, some segments of the renewable<br />
world have already experienced big<br />
setbacks, especially solar photovoltaic<br />
power. Solar investment in Spain,<br />
Germany, and Italy has grown rapidly in<br />
the past few years and far exceeded government<br />
goals thanks to favorable longterm<br />
subsidies. But constrained budgets in<br />
Spain and Italy have forced those countries<br />
to greatly reduce solar subsidies,<br />
which led to reduced investment (see<br />
“Credit FAQ: Could Spain’s Halt On<br />
Renewable Energy Incentives Take The <strong>Wind</strong><br />
Out Of Projects, Developers, And Utilities?”<br />
on p. 53). In Spain and the Czech Republic,<br />
we believe regulatory risk has become a<br />
bigger issue following these governments’<br />
decisions to alter their support framework<br />
for projects that are already financed (see<br />
“Credit FAQ: Why Regulatory Risk Hinders<br />
Renewable Energy Projects In Europe,” on p.<br />
40). These abrupt reductions for solar photovoltaic<br />
power have led to a large decline<br />
in demand for solar panels, resulting in<br />
numerous failures of once-prominent<br />
panel makers.<br />
Uncertainty Is A Big Factor In<br />
U.S. Government Funding<br />
U.S. budgetary constraints are hampering<br />
renewable projects that rely on<br />
the federal production tax credit (PTC),<br />
especially wind power. The PTC, which<br />
provides about 20% of a project’s cost<br />
over its 10-year life from the start of<br />
operations, has been the foundation of<br />
renewable-energy growth for the past<br />
decade. The current PTC expires at the<br />
end of 2012. Congress has extended the<br />
PTC several times in the past (although<br />
often after some delay), but the sheer<br />
cost of this funding in a time of record<br />
deficits could result in its discontinuation.<br />
If that happens, investment in<br />
onshore wind would decline substantially,<br />
and the nascent offshore wind<br />
industry that East Coast states favor<br />
would also be jeopardized (see “U.S.<br />
<strong>Offshore</strong> <strong>Wind</strong> Investment Needs More<br />
Than A Short-Term Production Tax Credit<br />
Fix,” on p. 34). Less at risk is the solar<br />
sector, whose investment tax credit runs<br />
through 2016, and prices for solar photovoltaic<br />
panels are declining rapidly.<br />
The drop in the price of natural gas to<br />
about $2 per million Btu adds to the<br />
debate about the cost of the U.S. renewable<br />
sector. Until recently, the high price<br />
of natural gas led to high power prices,<br />
which made renewable energy look<br />
more competitive and was a powerful<br />
incentive for Congress to provide support.<br />
But the currently low power prices<br />
now make cost parity a tougher argument<br />
to make. The continuing decline in<br />
solar panel prices might help the solar<br />
industry deal with this problem, but the<br />
wind industry faces a tougher challenge.
Still, many U.S. states, especially<br />
California, attract investment through<br />
Renewable Portfolio <strong>Standard</strong>s (RPS),<br />
which require a certain share of renewable<br />
electricity in the total supply, and<br />
from other investment support programs.<br />
Two planned offshore wind projects in<br />
the U.S., in Rhode Island and Nantucket<br />
Sound, are now in the advanced stages of<br />
development thanks to RPS.<br />
RPS standards are likely to remain in<br />
effect even if federal support for renewable<br />
energy wanes. A similar support<br />
scheme in the U.K., the Renewable<br />
Obligation program, is a major factor<br />
behind the recent burst of offshore wind<br />
power investment there.<br />
Alternative Funding Methods<br />
Are Taking Hold In Some Regions<br />
Indirect support through taxes on carbon<br />
also helps renewable energy by raising the<br />
cost of electricity derived from traditional<br />
fossil fuels. Denmark makes good use of<br />
this tool, and Australia will soon, creating<br />
an interesting dynamic that could open the<br />
door to significant investment (see “Can<br />
Gas Smooth Australia’s Transition From Coal<br />
Or <strong>Will</strong> <strong>Renewables</strong> Leap Ahead?” on p. 57).<br />
The carbon tax that Australia will introduce<br />
on July 1, 2012, will curtail production<br />
from coal-fired plants that currently<br />
supply 80% of the country’s electricity and<br />
would logically attract gas-fired investment<br />
to fill the gap. Australia hopes to cut its<br />
carbon emissions by 2020 by 5% from<br />
2000 levels, with an ultimate aim of an<br />
80% reduction by 2050. But, the 2050<br />
reduction target could make new gas-fired<br />
investment economically unattractive in<br />
the long term, which could open the door<br />
to renewable energy to help meet demand<br />
and carbon-reduction goals.<br />
The investor pool is another influence on<br />
the growth of renewable energy. Some<br />
countries such as Denmark enjoy wide<br />
public participation in renewable energy<br />
today because local ownership was<br />
required for projects in the early years of<br />
that industry’s development. Fixed-payment<br />
systems, such as the feed-in tariff<br />
(FIT), also open the door to a wide investor<br />
pool, given the limited contractual nature<br />
of the system and good predictability of<br />
cash flow streams. Tax-based schemes<br />
such as the U.S. PTC limit the investor pool<br />
because the credit relies on tax equity<br />
investors and complex financing structures.<br />
In addition, most renewable projects in the<br />
U.S. are financed with bank lending, which<br />
could be curtailed under proposed Basel III<br />
requirements that penalize long-term<br />
investments (see “Basel III And Solvency II<br />
Regulations Could Bring A Sea Change In<br />
Global Project Finance Funding,” on p. 26).<br />
<strong>Standard</strong> & Poor’s thinks strong<br />
growth in this sector will require new<br />
investment sources, such as pension<br />
funds and capital markets, and more private<br />
equity, but these investors have yet<br />
to jump into the pool in a big way.<br />
Securitization for solar power is a big<br />
option gaining a lot of interest (see “<strong>Will</strong><br />
Securitization Help Fuel The U.S. Solar<br />
Power Industry?” on p. 49). Part of the<br />
problem is that the renewable sector has<br />
many risks that these investor classes<br />
are not yet completely comfortable with.<br />
These risks include potential changes in<br />
government support, technology risk,<br />
construction risk, and operational risk<br />
such as wind resource adequacy and<br />
other factors. As these investors better<br />
understand the risks in these projects,<br />
they will invest more and help industry<br />
sustainability (see “After A Decade Of<br />
<strong>Wind</strong> Power, The Unexpected Is Still<br />
Always Expected,” on p. 45).<br />
There is never a dull moment in the<br />
electric power industry, and uncertainty<br />
surrounding renewable-energy investment<br />
over the next few years will only add to<br />
the excitement—-for some. Government<br />
support has provided the foundation for<br />
renewable energy, but this support is now<br />
questionable in many countries and can<br />
slip away unexpectedly for a number of<br />
reasons. Some technologies, such as offshore<br />
wind, appear more poised to gain<br />
continued support than others, but there is<br />
opportunity for new investor classes to<br />
provide long-term, and hopefully more<br />
stable, financial support. CW<br />
For more articles on this topic search RatingsDirect with keyword:<br />
Renewable Energy<br />
Analytical Contact:<br />
Terry A. Pratt<br />
New York (1) 212-438-2080<br />
<strong>Standard</strong> & Poor’s Ratings Services CreditWeek | May 23, 2012 7
FEATURES<br />
8 www.creditweek.com<br />
SPECIAL REPORT
Strong Growth Of Global<br />
<strong>Offshore</strong> <strong>Wind</strong> Power Needs<br />
Substantial Investment<br />
Overview<br />
● <strong>Offshore</strong> wind owes its existence to regulatory support.<br />
● The investment potential for offshore wind through this decade is immense. But<br />
this technology is not cheap.<br />
● We think utility funding will remain the predominant source for projects in the<br />
early stages of development for the next few years.<br />
● Financing for U.S. offshore wind projects differs from that used in Europe, where<br />
the utility balance sheet is the most common method of funding.<br />
● <strong>Offshore</strong> wind power is a relatively new industry with large growth potential, but<br />
many factors are impeding investment globally.<br />
Electricity comes from many sources, but there is one<br />
source that only a few countries in Western Europe, along<br />
with China, take advantage of, and it is in growing<br />
abundance: offshore wind power. The industry began in Sweden<br />
and Denmark in 1991 but had not grown significantly until<br />
recently. European utilities and project developers have built<br />
more than 3,800 megawatts (MW) of offshore wind power<br />
capacity, according to the European <strong>Wind</strong> Energy Assn., and<br />
another 2,400 MW will become operational globally in 2012 or<br />
early 2013, mostly offshore of the U.K. and Germany and to a<br />
lesser extent China. Countries are increasingly relying on<br />
offshore wind power to help meet social and economic policies<br />
over the next decade, but the investment required globally to<br />
meet this vision is immense (see table 1).<br />
<strong>Standard</strong> & Poor’s Ratings Services CreditWeek | May 23, 2012 9
FEATURES<br />
The factors behind the industry’s growth<br />
in Western Europe and China are fuel<br />
diversification, climate-change mitigation,<br />
and, more recently, job creation.<br />
For the same reasons, governments and<br />
stakeholders in many other countries are<br />
looking to add offshore wind power to<br />
Indicators of growth potential<br />
10 www.creditweek.com<br />
SPECIAL REPORT<br />
their resource arsenals, especially where<br />
large demand centers are near favorable<br />
locations for offshore wind farms.<br />
Funding will be a key issue for<br />
industry growth. Utility balance sheets<br />
and state lending organizations have<br />
been the dominant sources of funding<br />
Table 1 | Total <strong>Offshore</strong> <strong>Wind</strong> Capacity By Development Status<br />
Cumulative market, in MW<br />
—As of June 2011—<br />
Online/under construction Consented Planned Total projects<br />
U.K. 5,894 588 42,114 48,596<br />
Germany 1,028 8,725 21,493 31,247<br />
Denmark 854 418 1,200 2,471<br />
China 442 N.A. N.A. 442<br />
U.S. 0 468 N.A. 468<br />
Rest of the world 1,151 7,610 49,930 58,692<br />
Total global capacity 9,369 17,809 114,737 141,915<br />
N.A.—Not available.<br />
Sources: European <strong>Wind</strong> Energy Assn., Lindoe <strong>Offshore</strong> <strong>Renewables</strong> Center.<br />
Table 2 | Comparison Of Support Schemes For <strong>Offshore</strong> <strong>Wind</strong> In Key Markets<br />
Germany U.K.<br />
for this relatively new asset class, but<br />
these will not be nearly enough to fund<br />
the ambitious investment needed by<br />
2020. <strong>Standard</strong> & Poor’s Ratings<br />
Services estimates that the amount<br />
needed to meet U.K. and German government<br />
goals by 2020 falls between<br />
€91 billion ($117 billion) and €104 billion<br />
($133 billion).<br />
Project financing is becoming increasingly<br />
available for European offshore<br />
wind projects as governments, project<br />
sponsors, suppliers, and lenders manage<br />
investment barriers and help the<br />
industry grow.<br />
Favorable Regulations Are The<br />
Key To Increasing Investment<br />
Electricity from offshore wind costs<br />
much more to produce than that from<br />
conventional fossil fuels that dominate<br />
supply in most countries. Consequently,<br />
offshore wind owes its existence to regulatory<br />
support. We do not see this<br />
Share of energy from 35% by 2020* and 80% by 2050 (from about 17% today); 15% by 2020§ (from about 6.5% currently) and 80%<br />
renewable sources in gross last nuclear plant shutdown by 2022 reduction in carbon emissions by 2050<br />
final consumption of energy<br />
<strong>Offshore</strong> wind target 10 gigawatts (GW) by 2020 and 25 GW by 2030 18 GW by 2020<br />
Incentive schemes<br />
Statutory provisions/laws Renewable Energy Act (EEG), first passed in 1991; latest Currently: Renewable Obligation (RO) Act since 2002;<br />
amendments in force since Jan. 1, 2012 proposals on consultation period under review to be<br />
passed into law in 2012: Electricity Market Reform (EMR)<br />
and ROC Banding Review (RBR)<br />
Current incentive scheme Fixed feed-in tariff (FIT) with a maximum term of 20 years. Premium pricing (renewable obligation certificates, or ROCs)<br />
Initial remuneration of 15 cents per kilowatt hour (KWh) for combined with quota obligations. The regulator (the Office<br />
the first 12 years or 19 cents per KWh during the first eight of Gas and Electricity Markets, or “Ofgem”) maintains ROC<br />
years if the wind farm is operational before 2018. The initial prices relatively high by creating an undersupply. Currently,<br />
remuneration period can be extended for projects located at generators are granted 2 ROC per MWh, falling to 1.5 ROC<br />
least 12 nautical miles from the shore by 1.7 months for per MWh beginning April 2014 for 20 years from the point<br />
every meter deeper than 20 meters. Following the initial of registration for every KWh of electricity produced from<br />
remuneration period, the project receives 3.5 cents per KWh renewable sources. Electricity utilities purchase these ROCs<br />
until completing the maximum 20-year remuneration period. as proof that they are meeting their quota obligations if they<br />
FITs decrease by 7% per year beginning in 2018. do not generate enough ROCs themselves.<br />
Scheme under review None Currently includes 2 ROC per MWh to April 2015, 1.9 ROC<br />
MWh to April 2016, and 1.8 ROC per MWh to April 1, 2017<br />
(when the ROC scheme will no longer be available for new<br />
projects), or a two-sided FIT CfD (effectively guaranteeing<br />
a fixed price as generators would be obliged to return money<br />
if electricity prices are higher than the agreed FIT) from April<br />
1, 2014. Projects subject to the ROC scheme before April 1,<br />
2017, will have such scheme grandfathered throughout the<br />
project life, variable until 2027 and fixed thereafter. Items<br />
still to be defined are: 1) FIT levels, 2) the government counterparty<br />
providing the top-up FIT, and 3) the potential priority<br />
access and route to market for power generated under CfD.
changing for years to come. Countries<br />
are investing in renewable energy not so<br />
much to provide electricity at the lowest<br />
cost, but more to meet goals of energy<br />
security, climate-change mitigation,<br />
industrial policy, or a combination of the<br />
three. Government policies have been<br />
effective in attracting offshore wind projects<br />
to the U.K., Germany, and Denmark,<br />
but not yet in the U.S. Interestingly,<br />
diverse policies result in favorable<br />
investment frameworks and rapid<br />
growth (see table 2).<br />
Funding Sources And Gaps In<br />
Times Of Financial Constraints<br />
The investment potential for offshore<br />
wind through this decade is immense.<br />
Many countries expect wind power to<br />
account for a large share of their renewable-energy<br />
investment to meet energy<br />
and climate goals. But offshore wind<br />
technology is not cheap. Estimating its<br />
average cost per MW of installed<br />
capacity is difficult because of variations<br />
in key cost factors such as turbine size,<br />
distance from shore, water depth, sea<br />
and weather conditions, and many other<br />
factors, especially as projects move farther<br />
offshore. We estimate the average<br />
cost at roughly €3.5 million to €4.5 million<br />
per MW ($4,500 per kilowatt), or<br />
double that of a typical onshore wind<br />
project using proven turbines. At this<br />
cost, the new capacity by 2020 envisioned<br />
by the U.K. (16 gigawatts[GW])<br />
and Germany (10 GW) alone would<br />
require about €91 billion ($117 billion) to<br />
€104 billion ($133 billion). China’s current<br />
five-year plan envisioning 30 GW of<br />
offshore capacity by 2020 would involve<br />
even more investment.<br />
Most European offshore wind projects<br />
to date have been sponsored by utilities<br />
and funded on their balance sheets. Only<br />
utilities could put together funding on<br />
reasonable terms to pay for these capital-intensive<br />
projects. In addition, utili-<br />
Denmark U.S. China<br />
ties are motivated by strategic objectives<br />
and regulatory incentives. After construction<br />
and commissioning are complete,<br />
some utilities sell the project or<br />
part of it to long-term investors. But<br />
some rated utilities have limited headroom<br />
at their current ratings to accommodate<br />
the increase in financial risk<br />
inherent in the substantial upfront investments<br />
required (see “Credit FAQ: How<br />
Electricity Market Reform Could Affect The<br />
Ratings On U.K. Generators,” published<br />
May 24, 2011, on RatingsDirect, on the<br />
Global Credit Portal). This will likely<br />
increase the incentive for utilities to<br />
develop the projects off their balance<br />
sheets through single-asset project<br />
financing and shared equity stakes with<br />
infrastructure or financial investors.<br />
We think utility funding will remain<br />
the predominant source for projects in<br />
the early stages of development for the<br />
next few years, then gradually decline as<br />
offshore wind technology evolves and<br />
30% of electricity consumption covered by No binding target; 33 states have announced 11.4% of total primary energy consumption<br />
renewable energy by 2020§ renewable energy targets (RETs). provided by renewable sources by 2015 and<br />
20% by 2020<br />
4.6 GW by 2025 10 GW in the next decade and 54 GW by 2030 5 GW by 2015 and 30 GW by 2020 (compared<br />
to about 400 megawatts (MW) currently)<br />
None Renewable Portfolio <strong>Standard</strong>s (RPS); no special Renewable Energy Law (2005); latest revision in<br />
support for offshore wind effect since April 2010<br />
Fixed FIT contract for difference (CfD) for the Quota obligation for utilities (set by RPS) FIT set under tender: In the first batch of five<br />
first 50,000 full-load hours, and market price coupled with production tax credits (PTCs, concessions tendered in October 2010, the<br />
thereafter. The FIT level is set under a currently about 2.2 cents per KWh) for preferred bid prices were considerably lower<br />
competitive tender. renewable energy generation. The suppport than market expectations, which, in our view,<br />
scheme expires at the end of 2012. calls into question the economic viability of<br />
these projects. FIT guaranteed at the tender bid<br />
price for the first 30,000 full-load hours (could<br />
be as much as 10 to 15 years, depending on the<br />
capacity factor).<br />
None Current support scheme expires at the end Given the relative novelty of the offshore wind<br />
of 2012. development program in China, the regulatory<br />
framework is yet to be built.<br />
<strong>Standard</strong> & Poor’s Ratings Services CreditWeek | May 23, 2012 11
FEATURES<br />
investors are better able to quantify construction<br />
and commissioning risks.<br />
Despite the good match of long-term<br />
assets with institutional investors’ longterm<br />
investment horizons, investors<br />
have so far shown little interest in these<br />
projects until they have established operations<br />
and are generating a profit.<br />
Institutional investors are typically reluctant<br />
to assume construction risk and<br />
instead focus on yield. But this is beginning<br />
to change. In 2008, a private<br />
investor group led by Blackstone Group<br />
L.P. began to develop the 288 MW<br />
Meerwind project in Germany, the first<br />
offshore wind project to be sponsored<br />
privately. This €1.2 billion project is in<br />
construction and funded with private<br />
equity and debt.<br />
On the debt side, the handful of<br />
European projects using nonrecourse<br />
debt have been financed exclusively with<br />
loans, and commercial banks have par-<br />
12 www.creditweek.com<br />
SPECIAL REPORT<br />
ticipated with multilateral or state<br />
lending organizations in most cases.<br />
Negotiating acceptable terms for such a<br />
large and heterogeneous group of<br />
investors would seem to be a barrier to<br />
lending, but the use of such financing is<br />
accelerating. This was evident in 2011:<br />
Meerwind secured €822 million in loans<br />
under the auspices of the German stateowned<br />
agency KfW Bankengruppe,<br />
which established a €5 billion support<br />
scheme to help build out offshore wind<br />
projects to replace generation from<br />
retiring nuclear plants over the next<br />
decade. Also, the German Global Tech 1<br />
project secured €280 million from KfW’s<br />
facility and €270 million from a group of<br />
commercial lenders that also guaranteed<br />
€400 million of an additional €500 million<br />
loan granted by the European<br />
Investment Bank.<br />
One kink in the works could be the<br />
gradual application of the Basel III regu-<br />
Table 2 | Comparison Of Support Schemes For <strong>Offshore</strong> <strong>Wind</strong> In Key Markets (continued)<br />
Incentive schemes (continued)<br />
Germany U.K.<br />
lation, which increases the capital charge<br />
for long-duration loans and thus provides<br />
an incentive to rotate capital. We<br />
think Basel III combined with the trend<br />
of bank downgrades could reduce the<br />
amounts and increase the costs of longterm<br />
bank lending. This could result in a<br />
“flight to quality,” whereby banks could<br />
restrict their lending to projects with the<br />
strongest credit quality and short tenors<br />
spanning the construction phase or the<br />
typical five- to seven-year mini-perm<br />
period (a mini-perm loan is initially a<br />
temporary loan that is later made permanent).<br />
If that happens, meeting<br />
industry growth targets will depend<br />
heavily on attracting other investor pools<br />
beyond private equity, such as pension<br />
funds and capital markets.<br />
Financing for U.S. offshore wind projects<br />
differs from that used in Europe,<br />
where the utility balance sheet is the<br />
most common method of funding.<br />
Incentive counterparty FIT is paid by the relevant grid operator. Currently: Utilities entering into bilateral contracts with<br />
renewable energy generators for the ROCs. Proposed:<br />
Counterparty for the FIT or alternative scheme still to<br />
be defined.<br />
Capital grants/subsidies No Yes<br />
Tax incentives: electricity No Yes, all renewable energies (including offshore wind) are<br />
generated from renewable exempted from the climate change levy on electricity.<br />
source eligible for tax relief ?<br />
Priority grid access and Yes No; pending issue under the ongoing EMR<br />
dispatch for renewable power?<br />
Transmission responsibility Transmission operators are remunerated to cover the Project developer is reponsible. However, the assets are<br />
and up-front investment investment plus a return on capital over the life of the asset. expected to be sold to an <strong>Offshore</strong> Transmission Owner<br />
assumed (OFTO) under a competitive tender regulated by gas and<br />
electricity regulator Ofgem.<br />
Other support In June 2011, KfW Bankengruppe approved its <strong>Offshore</strong> £3 billion budget for the Green Investment Bank to make<br />
<strong>Wind</strong> Power Programme, providing a dedicated €5 billion direct investments in “green infrastructure” projects<br />
debt facility available to the first 10 German offshore wind beginning in 2015.<br />
projects on a first-come, first-served basis.<br />
Notes: Fixed FIT—Fixed payment that generators receive instead of revenues from selling electricity in the market. Premium FIT—Fixed premium on top of the variable wholesale<br />
electricity price. FIT CfD—FIT with a Contract for Difference. Contract between the electricity generator and the government or public energy agency with a fixed “strike” price,<br />
whereby payments equal the difference between the average price at which electricity is sold in the market and the agreed price.<br />
*Renewable Energy Act (EEG) 2012. §As defined under the European Union Directive 2009/28/EC.<br />
Sources: (U.K. wind target) Electricity Market Reform white paper; (U.S.) “Pushing Forward: The Future of <strong>Offshore</strong> <strong>Wind</strong> Energy” paper by Roland Berger Strategy Consultants; (China)<br />
last five-year plan from the National Energy Administration, E&Y Renewable Energy Country Attractiveness indices, February 2012.
Prospects are good for nonrecourse<br />
project financing, and small firms or<br />
those with limited balance sheets are<br />
developing most projects. Equity funding<br />
could involve numerous parties, leveraged<br />
equity from sponsors, or large private<br />
infrastructure funds.<br />
Debt funding is just as challenging as<br />
it is in Europe. Bank lending is typically<br />
the initial option, as it has been for most<br />
U.S. wind projects in the past decade.<br />
But U.S. banks are unfamiliar with offshore<br />
wind project risks. European banks<br />
that understand and can quantify the<br />
risks are likely to be major participants—<br />
and they already know the U.S. market<br />
issues well. But for the bank sector<br />
overall, Basel III provisions that penalize<br />
long-term assets could make this traditional<br />
source of financing less attractive<br />
(see “Basel III And Solvency II Regulations<br />
Could Bring A Sea Change In Global<br />
Project Finance Funding,” on page 26.)<br />
Investment Incentives<br />
And Barriers<br />
<strong>Offshore</strong> wind power is a relatively new<br />
industry with large growth potential,<br />
but many factors are impeding investment<br />
globally.<br />
Regulation<br />
The reliance on government support<br />
for offshore wind makes the cost of<br />
support the central issue, whether it is<br />
passed on to end users in higher tariffs<br />
or borne by the public through higher<br />
taxes. As costs rise, favorable public<br />
sentiment wanes, and opposition<br />
increases. If the investment greatly<br />
exceeds goals, governments can sometimes<br />
quickly reduce support, which<br />
could harm long-term industry stability<br />
in several ways.<br />
Incentives are commonly reduced for<br />
future projects as a new technology<br />
becomes cheaper, but investors expect<br />
Denmark U.S. China<br />
None Utilities entering into bilateral contracts Grid operators<br />
(purchase-power agreements) for the supply of<br />
energy and the acquisition of PTCs.<br />
No U.S. Department of Energy’s <strong>Offshore</strong> <strong>Wind</strong> Renewable Energy Fund, sustained through a<br />
Initiative is investing $43 million in 41 projects national surcharge on electricity prices, is paid<br />
across 20 states over the next five years. It also twice a year to grid companies by the<br />
initiated a six-year (2012 to 2018), $180 million government to subsidize the difference between<br />
support program to cover a share of design, wind power tariffs and coal-fired electricity tariffs.<br />
hardware, and construction costs.<br />
No Yes: Production tax credits and tax depreciation A tax refund of 50% of the value-added tax<br />
levied on electricity generation from wind power.<br />
In addition, wind power operators are entitled<br />
to a three-year tax holiday and a three-year, 50%<br />
reduction of the 25% enterprise income tax.<br />
Yes No Yes<br />
Transmission system operator Project developers By law, grid operators have obligations to build<br />
transmission lines to connect wind sites and purchase<br />
all the electricity generated from wind. In<br />
practice, transmission lines for more than half<br />
of the projects were constructed by<br />
project developers.<br />
None None Approved Clean Development Mechanism<br />
(CDM), by which carbon-free generators can sell<br />
Certified Emission Reduction cerfiticates (CERs)<br />
under Kyoto Protocol.<br />
<strong>Standard</strong> & Poor’s Ratings Services CreditWeek | May 23, 2012 13
FEATURES<br />
existing projects to be exempt from such<br />
reductions. There have been recent<br />
cases of countries reducing incentives<br />
that had been promised for projects<br />
already financed. Gauging the integrity<br />
14 www.creditweek.com<br />
SPECIAL REPORT<br />
In much of the world today, wind power is viewed primarily as a<br />
tool to mitigate climate change. But energy security concerns<br />
that arose after the oil crisis in the early 1970s were the primary<br />
impetus behind the contemporary development of the onshore<br />
industry, especially in Denmark. <strong>Offshore</strong> wind power subsequently<br />
emerged as a viable renewable-energy resource to meet<br />
energy security, climate, and, more recently, industrial development<br />
goals, given the better offshore wind resources and turbines<br />
that cannot be seen from shore.<br />
Government policies for offshore wind projects have evolved in<br />
nearly every case from those for onshore wind.<br />
Denmark Was A Pioneer And Is The Largest<br />
Producer Of <strong>Wind</strong> Electricity Per Capita<br />
Denmark’s continuing quest for energy independence surpasses<br />
that of any other nation, and wind power has played a major and<br />
increasing role since the mid-1980s, providing various forms of<br />
support along the way as well as a lot of fervent debate about the<br />
costs. According to the Danish Energy Agency, onshore and offshore<br />
wind power production in 2010 equaled nearly 22% of the<br />
domestic supply of energy, up from about 2% in 1990. Part of this<br />
wide and growing acceptance is that early on, those who<br />
invested in wind projects had to live near them, thus establishing<br />
early a wide lending and ownership base.<br />
<strong>Offshore</strong> wind came into the resource mix in the early 1990s with<br />
two government-directed projects, one of which, in 1991, was the<br />
world’s first multi-turbine project, located about one kilometer off the<br />
coast near Vindeby. About a decade later, the government accelerated<br />
development by opening up a competitive tender process for much<br />
larger projects to support stronger energy security and carbon-reduction<br />
goals. The tender process adds a measure of market discipline that<br />
remains a key aspect of offshore wind project compensation. At the<br />
same time, the government assumed control of the transmission grid<br />
and gave the grid operator the responsibility to build it out to support<br />
renewable energy, a key policy incentive that has encouraged investment.<br />
As security and climate goals strengthened, offshore tenders<br />
have continued. By year-end 2011, Denmark had 857 MW of offshore<br />
capacity, according to the European <strong>Wind</strong> Energy Assn. (EWEA).<br />
In 2011, the government adopted a policy to supply 50% of its<br />
energy demand in 2020 with renewable resources, which<br />
resulted in the 600 MW Kriegers Flak project that will become<br />
operational between 2018 and 2020. In addition, the government<br />
announced in March 2012 that wind power alone should supply<br />
50% of the demand by 2020, and another 900 MW of installations<br />
will be built before then.<br />
and sustainability of regulatory support<br />
over a project’s life is more art than science<br />
(see “Credit FAQ: Why Regulatory<br />
Risk Hinders Renewable Energy Projects In<br />
Europe,” on page 40).<br />
Policy Framework Background For Key Countries<br />
Technology and design<br />
The ability of offshore wind turbines<br />
and foundations to meet production<br />
forecasts over their design life and<br />
within operation and maintenance<br />
<strong>Offshore</strong> <strong>Wind</strong> Should Help Germany Fill The Gap<br />
Left By The Nuclear Shutdown<br />
The German response to the 1973 oil crisis was, like Denmark’s,<br />
geared toward energy security with an emphasis on coal and nuclear<br />
investment. Germany initially lagged behind Denmark in developing<br />
policies to promote wind energy, but times have changed. Although<br />
Germany inaugurated its first large–scale offshore wind project<br />
seven years after Denmark did, Germany’s policies will require<br />
greater investment and thus project finance potential.<br />
Germany has supported renewable-energy investment since the<br />
oil crisis, but it did not form intensive policies until the late 1980s.<br />
Policy drivers included the 1986 Chernobyl disaster and the rise of<br />
climate-change concerns, especially given the country’s high use<br />
of coal in power production. Its policies have resulted in the development<br />
of a formal feed-in tariff (FIT) in use since the early 1990s<br />
that has been the foundation for renewable-energy investment,<br />
especially for offshore wind. The FIT varies by asset class<br />
depending on government interest, and offshore wind was added<br />
in 2000 when the government adopted policies to greatly expand<br />
electricity supply from renewable resources.<br />
Thanks to the FIT, offshore wind investment has grown from<br />
zero in 2009 to 120 MW today. Another 800 MW is in construction,<br />
and more than 8 GW has been authorized (see table 1).<br />
Investment will grow even more in the decade ahead as Germany<br />
shuts down its nuclear power plants in response to the<br />
Fukushima nuclear catastrophe in Japan in 2011.<br />
To support this rapid exit from nuclear power, the German government<br />
revised investment incentives for its preferred replacement<br />
candidate, offshore wind, to realize 10 GW of capacity by<br />
2020. <strong>Offshore</strong> wind developers can choose between the existing<br />
FIT or a higher FIT over a shorter period for projects that are<br />
operational before 2018 (see table 2). In addition, the reduction in<br />
the original FIT was postponed to year-end 2018 from 2015.<br />
Finally, the German state-owned agency KfW Bankengruppe<br />
offered a €5 billion loan scheme to help fund the construction of<br />
the initial 10 offshore wind projects, on a first-come, first-served<br />
basis. Meerwind was the first.<br />
This abrupt change in policy is favorable to offshore wind but<br />
introduces risk by rapidly expanding industry demand beyond<br />
the supply available.<br />
The U.K. Has Ambitious <strong>Offshore</strong> <strong>Wind</strong> Targets<br />
And Ongoing Regulatory Reform<br />
The U.K. is the uncontested world leader in offshore wind<br />
power, with more than 2 GW of capacity online at year-end
(O&M) expectations in harsh conditions<br />
is the key technology risk. Most<br />
turbines in use today range from about<br />
2 MW to 5 MW. Small ones have operational<br />
histories of about 10 years, but<br />
2011 (according to the EWEA)—essentially double the amount in<br />
the rest of the world (see table 1). More than 4 GW are in construction,<br />
and there is vast potential for more. But, the key<br />
policy issue is that this growth comes at a high cost, and so has<br />
considerable opposition.<br />
Government support and the U.K.’s natural advantages—a long<br />
coastline, shallow waters, and heavy winds—have enabled it to<br />
achieve this leadership position. The U.K. also has substantial<br />
incentives in the form of Renewable Obligation Credits (ROCs)<br />
that it grants to eligible renewable-energy generators for each<br />
megawatt hour (MWh) they produce. ROCs also provide a premium<br />
to the market price (see table 2).<br />
The Department of Energy and Climate Change is proposing<br />
energy sector reform to increase private-sector investment in<br />
low-carbon energy sources to meet goals of 15% renewableenergy<br />
supply share by 2015 and an 80% carbon reduction by<br />
2050. The proposal is scheduled to go to Parliament this year, so<br />
we do not expect implementation until 2013.<br />
The proposal targets 18 GW of offshore wind installed<br />
capacity by 2020. Incentives include higher ROCs for offshore<br />
wind projects built between 2014 and 2017. Afterward, ROCs<br />
will be phased out and replaced by a fixed-price remuneration<br />
system in the form of FIT Contract for Difference (CfD), by<br />
which renewable-electricity generators will enter bilateral contracts<br />
to sell electricity into the wholesale market and receive a<br />
supplemental payment from the government (or a government<br />
agency) for the difference between the wholesale price and the<br />
agreed tariff. Renewable-energy generators may choose<br />
between both remuneration schemes in the transition period<br />
from April 2014 through March 2017. This seems good for<br />
investment: The ROC price varies with market prices, but the<br />
CfD is fixed.<br />
Still, key questions remain. One is, will power generated under<br />
FIT CfDs have priority access to the grid and dispatch? This is a<br />
key credit feature for an intermittent fuel source such as wind<br />
(see the “Interconnection” section). Another key question is which<br />
counterparty will pay the FIT CfD.<br />
And there is always that pesky issue of how much of the cost<br />
the consumer must ultimately bear. The regulator, the Office of<br />
Gas and Electricity Markets, estimates that user bills could go<br />
up by 14% to 25% between 2010 and 2015 to fund the estimated<br />
£200 billion investment involved in the proposed Electricity<br />
Market Reform. This hit on the wallet could lead to a lack of<br />
support for offshore wind, especially if the current economic<br />
conditions persist.<br />
large ones have been in use for only a<br />
few years. The newer turbines of<br />
about 5 MW that are increasingly preferred<br />
for offshore projects have not<br />
been in use long enough to enable<br />
developers to soundly gauge longterm<br />
performance.<br />
<strong>Offshore</strong> wind turbines generally<br />
experience the same problems that<br />
onshore ones have—electrical and<br />
The U.S. Is A Late Adopter With A Long Way To Go<br />
Onshore wind investment in the U.S. has been a big success, primarily<br />
because of federal production tax credits (PTCs) and some<br />
state mandates that require utilities to provide a certain share of<br />
the supply from renewable-energy sources. <strong>Wind</strong> technology is<br />
generally the most economically attractive. But offshore wind<br />
investment remains constrained by an emerging permitting<br />
process, high costs, and a long development cycle, despite having<br />
support schemes similar to those of Europe. The industry is<br />
active, though, and may soon begin one or more projects along<br />
the East Coast, given the proximity to large load centers with<br />
high electricity prices, shallow waters, and limited storm risk.<br />
The federal and state permitting processes for offshore wind<br />
projects are in their infancy and doubly challenging when both<br />
state and federal jurisdictions are involved. It was not until 1995<br />
that the Department of the Interior obtained authority to approve<br />
and grant leases in federal waters for offshore wind projects.<br />
Cape <strong>Wind</strong> Associates, developer of a 468 MW wind project in<br />
Nantucket Sound, obtained a lease in April 2010, nearly 10 years<br />
after the project’s initial submittal. Few developers can stomach<br />
10 years of expense just to get a permit, much less construct and<br />
start up a plant. Regulatory processes must be streamlined,<br />
shortened, and more predictable for the U.S. to tap into offshore<br />
wind power potential.<br />
The U.S. subsidy framework is much weaker than the Danish,<br />
German, and U.K. regulatory schemes. Federal financial support<br />
for wind power is largely limited to a PTC per kilowatt hour over<br />
10 years, which covers about 20% to 25% of a project’s cost. This<br />
has two big drawbacks for investment. First, the PTC program is<br />
usually mandated for only a few years and is therefore subject to<br />
continuing renewal risk. The current program ends near year-end<br />
2012. Congress’s failure to renew it several times during the past<br />
decade has led to huge investment reductions each time. Given<br />
current budget constraints, no one knows whether Congress will<br />
renew the program. The problem for offshore wind projects is<br />
that the development cycle spans many years, beyond which the<br />
PTC may not be authorized. For example, the promising 450 MW<br />
Bluewater project in Delaware recently cancelled its long-term<br />
purchase-power agreement, citing an inability to finance the<br />
project, partly because of the uncertainty of PTC support.<br />
The second drawback is that most renewable-energy projects<br />
cannot fully realize the tax benefits of the PTC because of low tax<br />
exposure. This requires tax equity participation in most projects to<br />
make efficient financing possible. This adds complexity and cost to<br />
transactions, but more important, it limits the investor pool.<br />
<strong>Standard</strong> & Poor’s Ratings Services CreditWeek | May 23, 2012 15
FEATURES<br />
16 www.creditweek.com<br />
SPECIAL REPORT<br />
control systems, gearboxes, blades,<br />
and especially foundations. The foundation<br />
represents a much higher share<br />
of the total cost than it does for<br />
onshore projects. Sea and wind conditions<br />
add considerably to load fatigue<br />
and materials degradation. In addition,<br />
the integrity of the connection<br />
between the turbine and foundation<br />
has emerged as a problem in some<br />
designs, leading to unexpected outages<br />
and repair costs for some projects.<br />
Operating experience will help put<br />
technology risk in better perspective. But<br />
such risk will always be present in offshore<br />
wind projects as long as developers<br />
want to use larger turbines in<br />
deeper waters where wind regimes are<br />
stronger to gain economies of scale and<br />
reduce costs.<br />
Construction<br />
Construction risk is much greater for<br />
offshore wind projects than onshore<br />
ones, given the special boats, cranes,<br />
and highly skilled personnel required to<br />
complete construction on schedule, on<br />
budget, and to performance requirements—under<br />
sometimes precarious<br />
sea and wind conditions. Success with<br />
offshore projects requires proven contractors,<br />
sound project management,<br />
and solid logistics skill, as well as contingencies<br />
for unexpected weather conditions.<br />
Several firms have cited<br />
weather delays, installation vessel<br />
unavailability, cabling difficulties, and<br />
materials problems as causes of massive<br />
cost overruns.<br />
The highly complex nature of offshore<br />
wind project construction<br />
requires strongly structured engineering,<br />
procurement, and construction<br />
(EPC) contracts that allocate<br />
price, schedule, and performance risks<br />
to a single party. But the diverse nature<br />
of the construction involved—foundation<br />
installation, turbine supply and<br />
erection, vessels, and undersea transmission<br />
cabling—makes it difficult to<br />
arrange single—point EPC contracts.<br />
Therefore, projects often hire multiple<br />
contractors. But this decreases the<br />
likelihood that any single party will<br />
accept overall construction risk; one<br />
contractor’s poor performance could<br />
lead to delays or other problems for<br />
another and disagreement about who<br />
was responsible.<br />
The allocation of responsibilities<br />
and penalties for nonperformance<br />
must be clear, especially given the<br />
vagaries of weather and the overly<br />
complex nature of the construction.<br />
Successful projects require strong contractors<br />
that have favorable experience<br />
in performing their specific activities<br />
and an absolutely sound interface plan.<br />
Projects must also have effective contract<br />
provisions to mitigate the risk of<br />
a contractor’s nonperformance.<br />
Interconnection<br />
In Denmark and Germany, transmission<br />
system operators are responsible<br />
for the construction and financing of<br />
transmission infrastructure to hook up<br />
offshore projects. This has good and<br />
bad implications. It substantially<br />
reduces the project’s cost, and hence<br />
funding needs, but it also forces the<br />
project to rely on an external party for<br />
a critical item. Being able to manage<br />
unexpected events is critical.<br />
In Germany, the rapid growth in offshore<br />
wind projects has exceeded the<br />
independent grid operator’s ability to<br />
build out the transmission system<br />
quickly in some areas to support them.<br />
<strong>Offshore</strong> projects under construction<br />
could experience start-up delays, and<br />
those in development may not be able<br />
to get financing until the supply chain<br />
catches up.<br />
Risk remains during operations, too, if<br />
large demand centers face grid constraints,<br />
or if jurisdictions do not grant<br />
priority grid access and dispatch for<br />
intermittent renewable energy. In these<br />
cases, the grid may be unable to accept<br />
the entire wind project’s output at all<br />
times, especially during off-peak periods<br />
when wind capacity may be highest.<br />
Operations and maintenance<br />
As with most projects, O&M for offshore<br />
wind energy focuses on turbine<br />
availability and cost certainty. An offshore<br />
wind project will lose cash flow<br />
if a turbine becomes unavailable.
Turbines can be hard to maintain,<br />
especially in bad weather and rough<br />
seas, and even more so if a boat and<br />
crane are not available. Many offshore<br />
turbine technologies were developed<br />
with special emphasis on resolving<br />
availability problems remotely, but<br />
sometimes personnel are required to<br />
implement repairs. So, the better projects<br />
have a sound O&M plan to deal<br />
with these issues.<br />
Many wind projects typically mitigate<br />
O&M risk for the first two to five years<br />
of operation (the typical start-up<br />
period) through an agreement with the<br />
equipment supplier that enhances the<br />
technology warranty. Projects may<br />
extend an O&M agreement thereafter,<br />
but O&M for offshore wind is far more<br />
complex than that for onshore wind.<br />
The better projects performing their<br />
own O&M will be able to obtain the<br />
vessels, cranes, and personnel at<br />
expected rates. This can be hard to do<br />
well for a long period, given the lack of<br />
long-term O&M data on newer turbine<br />
technologies and foundations.<br />
<strong>Wind</strong> resource<br />
Revenue schemes for most, if not all,<br />
offshore wind projects provide a payment<br />
for electricity provided, but not for<br />
capacity. Therefore, revenues are linked<br />
directly to the wind resource and how it<br />
is modified as it travels through the wind<br />
turbine array (called the “array effect”).<br />
A lot of actual and modeled data is<br />
available on the various offshore wind<br />
farms in Europe. The best data is that<br />
collected at the height of the turbine<br />
nacelle, but this is often limited for most<br />
projects, especially those slated for<br />
deeper waters. This introduces uncertainty<br />
of production, and thus of cash<br />
flow, which can dampen investor sentiment.<br />
Successful financing of offshore<br />
projects in the U.S. will have to overcome<br />
an even weaker data set.<br />
Onshore wind resources can be<br />
much more variable than experts initially<br />
expect, and we believe the same<br />
is true for offshore wind. Many<br />
European onshore wind projects have<br />
experienced much weaker production<br />
than expected, despite often having<br />
two or three assessments from independent<br />
technical experts that factored<br />
in much long-term data from operating<br />
plants and ground locations, such as<br />
airports and weather stations. (See<br />
“After A Decade Of <strong>Wind</strong> Power, The<br />
Unexpected Is Still Always Expected,” on<br />
page 45.) Because offshore wind projects<br />
have less data available, one or<br />
two years of onsite data at hub height<br />
cannot provide reliable projections of<br />
offshore wind resources for a 20- to<br />
25-year debt term. More data will<br />
gradually become available, resulting<br />
in better estimates, but the wind<br />
resource will remain a key risk to offshore<br />
wind projects.<br />
Capital structure<br />
The revenue support mechanism for offshore<br />
wind projects can vary, and<br />
lending arrangements need to take this<br />
into account. The Cape <strong>Wind</strong> project in<br />
the U.S. in Nantucket Sound secured a<br />
purchase-power agreement (PPA) with a<br />
price that is fixed initially and escalates<br />
with inflation, so one can reasonably<br />
forecast PPA prices. In Germany, a<br />
project earns the feed-in tariff (FIT)<br />
price for 20 years and so can establish a<br />
20-year debt tenor to match. However,<br />
the pricing mechanism may have stepdowns<br />
at times and further adjustments<br />
if energy production differs from expectations.<br />
In the U.K., revenues are<br />
exposed to market electricity and emissions<br />
credit prices, in addition to wind<br />
risk. In Denmark, an offshore project<br />
earns a fixed price up to a maximum<br />
amount of energy production. If the<br />
actual production exceeds (or falls short<br />
of) initial expectations, the revenue<br />
stream will end before (or extend<br />
beyond) debt maturity. CW<br />
For more articles on this topic search RatingsDirect with keyword:<br />
<strong>Wind</strong><br />
Analytical Contacts:<br />
Terry A. Pratt<br />
New York (1) 212-438-2080<br />
Jose R. Abos<br />
Madrid (34) 91-389-6951<br />
Gloria Lu, CFA<br />
Hong Kong (852) 2533-3596<br />
<strong>Standard</strong> & Poor’s Ratings Services CreditWeek | May 23, 2012 17
FEATURES<br />
SPECIAL REPORT<br />
Basel III And Solvency II<br />
Regulations Could Bring<br />
A Sea Change In Global<br />
Project Finance Funding<br />
Overview<br />
Possible changes include:<br />
● Higher costs to obtain project finance loans,<br />
● Ongoing changes related to which banks offer project loans,<br />
● A change in how banks structure such loans,<br />
● More refinancing risk for some bank loan financings,<br />
● A shift to more capital market funding of project finance transactions, and<br />
● The creation of innovative financing solutions such as effective targeted risk<br />
transfer techniques to improve projects’ credit quality.<br />
Banking institutions have traditionally dominated global<br />
project finance lending (see chart). While traditions can be<br />
tough to change, we believe stricter regulations governing<br />
bank lending under Basel III—the Basel Committee on Banking<br />
Supervision’s new global standards for banks’ liquidity and<br />
capital adequacy—will bring profound changes to the global<br />
project finance sector and the ways it pursues funding.<br />
18 www.creditweek.com
<strong>Standard</strong> & Poor’s Ratings Services CreditWeek | May 23, 2012 19
FEATURES<br />
Banking regulators are putting Basel III<br />
into effect country by country (with an<br />
official target for completing the<br />
rollout by 2018), and each nation’s regulatory<br />
body has its own interpretation<br />
of how to apply the rules. <strong>Standard</strong> &<br />
Poor’s Ratings Services expects Basel<br />
III standards to require banks to significantly<br />
increase their capital reserves,<br />
particularly common equity. This could<br />
threaten banks’ return on equity and,<br />
in turn, their market values. Banks’<br />
opposition to Basel III is growing as<br />
they continue to deal with increasingly<br />
difficult business conditions such as<br />
the eurozone crisis and sluggish<br />
economies. Variations in how national<br />
regulators might implement and interpret<br />
Basel III—including heated<br />
debates over risk weighting—are<br />
adding to the bank industry’s angst.<br />
The EU’s Solvency II directive—which<br />
some call “the Basel III of the insurance<br />
industry”—could also directly shape<br />
project finance because it imposes, for<br />
the first time, capital requirements on<br />
the asset risk of insurance companies<br />
(see “Why Basel III And Solvency II <strong>Will</strong><br />
Hurt Corporate Borrowing In Europe More<br />
Than In The U.S.,” published Sept. 27,<br />
2011, on RatingsDirect, on the Global<br />
Credit Portal). Like Basel III, Solvency II<br />
imposes higher capital charges for lowercredit<br />
quality and longer-dated financial<br />
instruments. Given that project financings<br />
are typically highly leveraged, any<br />
change to the cost or availability of debt<br />
20 www.creditweek.com<br />
SPECIAL REPORT<br />
Global Volume By Source Of Funding<br />
(Bil. $)<br />
180<br />
160<br />
140<br />
120<br />
100<br />
80<br />
60<br />
40<br />
20<br />
0<br />
Equity Bonds Loans IFI support<br />
or swaps is a potential challenge to the<br />
viability of some projects.<br />
The Form Of The Basel III<br />
Rollout Remains Hazy<br />
There is still-significant debate as to how<br />
Basel III will be implemented in each<br />
country, and many banks have begun<br />
lobbying against Basel III in earnest. In<br />
September, the Institute of International<br />
Finance (IIF, a global association of<br />
about 400 large commercial and investment<br />
banks) published a report titled,<br />
“The Cumulative Impact On The Global<br />
Economy Of Changes In The Financial<br />
Regulatory Framework,” stating that given<br />
the weakened economies in the U.S., the<br />
eurozone, Japan, the U.K., and<br />
Switzerland, Basel III could lead to the<br />
loss of 7.5 million jobs and a 3.2%<br />
reduction of GDP by 2015 in those<br />
economies (thereafter, the IIF believes<br />
such negative effects will fade).<br />
New Regulations Could<br />
Complicate Refinancing<br />
Of Current Loans<br />
Most bank loans to projects have to be<br />
refinanced during the life of a project<br />
and this introduces refinancing risk.<br />
Because a project’s revenues are often<br />
largely fixed, refinancing risk—the risk<br />
that existing project debt with a bullet<br />
maturity cannot be repaid from a new<br />
borrowing or other refinancing because<br />
the terms of such new borrowing or refinancing<br />
are uneconomical—can be<br />
H1<br />
2005 H2<br />
2005 H1<br />
2006 H2<br />
2006 H1<br />
2007 H2<br />
2007 H1<br />
2008 H2<br />
2008 H1<br />
2009 H2<br />
2009 H1<br />
2010 H2<br />
2010 H1<br />
2011<br />
IFI—International financial institutions (including multilateral and development bank support).<br />
Source: Infrastructure Journal.<br />
© <strong>Standard</strong> & Poor’s 2011.<br />
material. As we note in “Summary Of<br />
<strong>Standard</strong> & Poor’s Criteria Methodology<br />
For Refinancing Risk In PPP/PFI Projects,”<br />
published Oct. 28, 2009, a project with<br />
no refinancing risk is more likely, all<br />
other things being equal, to have a<br />
stronger credit profile than one exposed<br />
to refinancing. In a limited life concession<br />
typical of project finance transactions,<br />
there is an additional time pressure<br />
to undertaking the refinancing. And<br />
amid the continuing sluggish global<br />
economy, Basel III and Solvency II<br />
could introduce further uncertainty<br />
about refinancing and hence increase<br />
credit risk—particularly for those<br />
project finance loans whose business<br />
risks have changed.<br />
Banks made many of these loans<br />
when market conditions were better or<br />
business prospects for the future were<br />
rosier. For instance, in the U.S., tax<br />
incentives helped spur a solid stream of<br />
wind power financings from about 2000<br />
onward. Many of the deals in the period<br />
2000 to 2006 relied on wind resource<br />
forecasts that have since proved to be<br />
overly optimistic, thus increasing refinancing<br />
risk. Further complicating matters<br />
are the likely higher funding costs<br />
and lower availability of long-term bank<br />
credit due to these new regulations.<br />
Hence, a capital markets bond financing<br />
to replace the bank debt might be an<br />
increasingly attractive option to banks.<br />
However, banks have been aggressive in<br />
structuring many current project loans.<br />
As such, these loans were not necessarily<br />
structured to readily facilitate an<br />
investment-grade bond market issuance<br />
to fund the refinancing. And for many<br />
capital market investors, investmentgrade<br />
is their preference. Furthermore,<br />
the proposed new capital charges under<br />
Solvency II discourage long-term<br />
investing by insurance companies.<br />
Changes Could Usher In New<br />
Funding Types, Business Models,<br />
And Providers<br />
The general sentiment among bankers is<br />
that adopting Basel III “as is” would discourage<br />
banks from holding longer-term<br />
loans on their balance sheets, due to the<br />
net stable funding requirement (NSFR;
see Appendix). In fact, some banks have<br />
or will significantly reduce or exit the<br />
project finance business and some other<br />
product lines because of this and other<br />
Basel III requirements. Increasingly,<br />
banks are distributing lists of project<br />
assets for sale to get them off their balance<br />
sheets. Moreover, we’re seeing<br />
signs that some banks that depend more<br />
heavily on government support are getting<br />
encouragement from those governments<br />
to focus the use of bank capital on<br />
lending in their domestic markets, with a<br />
view to preserving jobs.<br />
We believe banks may try to<br />
encourage sponsors to borrow for<br />
shorter terms and to accept refinancing<br />
risk. In Australia, the use of shorter<br />
terms with refinancing is widespread. If<br />
this happened, we anticipate seeing<br />
increased use of project features such as<br />
interest rate step-ups and cash sweeps<br />
that can reduce refinancing risk. Twophase<br />
financings might become en<br />
vogue again, e.g., construction financing<br />
funded by banks loans then takeout<br />
through bonds.<br />
An increase in shorter-term refinancing<br />
may require changes in how<br />
revenue agreements (such as a power<br />
purchase agreement or government concessions)<br />
are structured. Such arrangements<br />
are widely used in project financings<br />
and often support a stronger credit<br />
quality. Revenue contracts are often 30<br />
years or longer for government concessions<br />
and some power projects, and<br />
even commodity-linked projects often<br />
have more than 10-year terms. Such<br />
agreements might need to be designed<br />
to accommodate more frequent and<br />
shorter-term refinancings that could be<br />
on different financial terms and conditions<br />
than originally projected.<br />
Some banks are also considering<br />
increasing their presence in the capital<br />
markets. Basel III considers project<br />
bonds favorably, from a capital coverage<br />
perspective. In some regions, programs<br />
such as the EU’s Project Bond Initiative<br />
(see “How Europe’s Initiative To Stimulate<br />
Infrastructure Project Bond Financing<br />
Could Affect Ratings,” published May 16,<br />
2011) has been developed to encourage<br />
institutional investors to participate<br />
more in this asset class. We are<br />
observing an increase in the number of<br />
new debt funds. In addition, we are recognizing<br />
the appetite of bond investors<br />
for instruments with stronger credit<br />
quality; financial innovations, such as<br />
effective targeted risk transfer techniques<br />
to enhance credit quality of projects,<br />
are being developed.<br />
Liquidity Requirements May<br />
Threaten Certain Project Finance<br />
Credit Facilities<br />
Basel III introduces new liquidity<br />
requirements for banks through its liquidity<br />
coverage ratio (LCR; see Appendix).<br />
In its current form, the LCR could<br />
penalize undrawn revolving credit facilities<br />
made to special-purpose vehicles by<br />
requiring 100% coverage. However, the<br />
effect on banks will be minimal because,<br />
as the law firm Linklaters points out,<br />
these facilities represent a relatively<br />
small percentage of banks’ debt exposure.<br />
On the other hand, the LCR could<br />
threaten the use of letters of credit,<br />
which are prevalent in project finance.<br />
Local country regulators can set the<br />
Basel III liquidity coverage ratio requirement,<br />
and Linklaters has indicated that a<br />
coverage level of 25% or higher might<br />
make letters of credit economically<br />
unattractive to banks unless they were<br />
tied to concessions from sponsors (See<br />
“Basel III and Project Finance,” published<br />
in Project Finance International, June 29,<br />
2011, Issue 460).<br />
New Paradigm In Global<br />
Project Finance Funding Is<br />
Still Being Defined<br />
The end game for what might be the new<br />
paradigm in global project finance<br />
funding is hard to predict, as the powerful<br />
forces of politics, regulations, and<br />
business are still crossing swords. At this<br />
point, we are considering various scenarios<br />
arising from these new regulations<br />
and evaluating what potential<br />
credit implications there could be for<br />
project finance transactions. We are also<br />
applying existing criteria or will develop<br />
new methodologies to assess credit risk<br />
for financing innovations that the market<br />
might devise.<br />
<strong>Standard</strong> & Poor’s Ratings Services CreditWeek | May 23, 2012 21
FEATURES<br />
Appendix: Basel III And<br />
Solvency II—A Primer<br />
The main changes to bank regulation<br />
proposed in Basel III<br />
The Basel III bank regulatory regime,<br />
agreed on by the members of the Basel<br />
Committee on Banking Supervision, is<br />
the successor to Basel II, implemented<br />
at the start of the past decade. This, in<br />
turn, was the successor to the Basel<br />
Accords of 1988 on minimal capital<br />
requirements for banks, known as<br />
Basel I. By establishing tighter capital<br />
requirements and introducing liquidity,<br />
funding, and leverage guidelines, the<br />
most recent proposals in our view indirectly<br />
recognize the shortcomings of<br />
Basel II in these areas in light of the<br />
recent financial crisis.<br />
The key regulatory changes, to be<br />
implemented in stages between 2013<br />
and 2018, are as follows:<br />
Increased capital requirements. These<br />
aim to provide a large enough buffer to<br />
absorb losses by banks during periods of<br />
stress, and increase the risk weights<br />
placed on market activities. The regulatory<br />
changes related to market risk capital<br />
requirements are better known as<br />
Basel 2.5 and will be implemented in<br />
January 2012, one year before the Basel<br />
III package. The Basel III regulations<br />
will raise minimum total capital requirements<br />
in a step-by-step process until<br />
2018, at which time they should reach<br />
10.5% from the current 8%. This<br />
includes the so-called capital conservation<br />
buffer, which creates constraints on<br />
banks’ capital and shareholder distribution<br />
policies. The regulations impose<br />
further minimum capital requirements<br />
for systemically important financial<br />
institutions, with a capital surcharge of<br />
up to 350 basis points (bps). On top of<br />
this, the Basel Committee is discussing<br />
imposing a countercyclical capital buffer<br />
of up to 250 bps for all banks. It<br />
increases not only the quantity of capital,<br />
but also its quality, with minimum<br />
common equity more than doubling to<br />
4.5% by 2015, including the capital conservation<br />
buffer, and to 7% by January<br />
2019 from the current 2%. The new capital<br />
charges also aim to reflect counterparty<br />
credit risk in light of the Lehman<br />
22 www.creditweek.com<br />
SPECIAL REPORT<br />
default and its aftermath. We anticipate<br />
that those most affected will likely be<br />
financial institutions with large derivatives<br />
and trading businesses.<br />
New liquidity and funding ratios. By<br />
introducing these ratios in 2015 and<br />
2018, respectively, banking supervisors<br />
aim to prevent run-offs on banks perceived<br />
to be vulnerable. The liquidity<br />
coverage ratio tests the stock of highquality<br />
liquid assets relative to net cash<br />
outflows over a stressed period of 30<br />
days. The funding ratio—known as the<br />
net stable funding ratio—tests the<br />
amount of stable funding relative to<br />
the required amount of stable funding<br />
over one year.<br />
The introduction of a leverage ratio. As a<br />
supplementary measure, the leverage<br />
ratio should identify outlying banks relative<br />
to their peers and prevent institutions<br />
from subverting capital requirements.<br />
The ratio will measure<br />
high-quality capital relative to a total<br />
exposure or asset measure.<br />
The key changes to insurer<br />
regulation in Solvency II<br />
The Solvency II EU directive that codifies<br />
and harmonizes the EU insurance<br />
regulation promises to transform the<br />
industry (see “Solvency II Implementation<br />
Looms, But European Insurers Still Face<br />
Uncertainty After Fifth Quantitative<br />
Impact Study,” published April 6, 2011).<br />
The predecessor regime, Solvency I,<br />
dates back over 30 years and generally<br />
is no longer regarded as fit for its purpose.<br />
Per draft legislation, the effective<br />
date for Solvency II is January 2013,<br />
although it may be deferred by up to<br />
one year. Furthermore, transitional<br />
measures over as much as 10 years will<br />
cushion the initial impact.<br />
The implications for insurers are huge,<br />
in our view, and will significantly weigh<br />
on insurers’ investing activities, which<br />
currently attract no capital requirements<br />
at all, regardless of risk characteristics.<br />
Based on the fifth Quantitative Impact<br />
Study, the risk-based capital regime of<br />
Solvency II will introduce shorter dated<br />
and highly rated debt instruments over<br />
longer-dated and lowly rated instruments.<br />
The European insurance industry<br />
currently holds investments valued at<br />
about €7 trillion, 40% of which is held in<br />
debt securities.<br />
Solvency II consists of three pillars:<br />
quantitative requirements; qualitative<br />
requirements, including risk management;<br />
and disclosure requirements.<br />
Like Basel III for banks, the introduction<br />
of solvency and minimum capital<br />
requirements should, in our opinion,<br />
lead to increased regulatory consistency<br />
across jurisdictions—within the<br />
EU at least—particularly in the area of<br />
risk-based capital adequacy relative to<br />
economic risk.<br />
Introduction of a solvency capital<br />
requirement. The centerpiece of the first<br />
pillar of Solvency II is the introduction of<br />
a solvency capital requirement. It aims<br />
to provide a standard measure for<br />
market, underwriting, and noninsurance<br />
risks, as well as counterparty default<br />
risks. The measure reflects the aggregate<br />
effect of stresses reflecting these risks,<br />
focusing on a market-consistent value of<br />
the assets and liabilities. Insurers that<br />
breach the requirement would not face<br />
automatic regulatory intervention, but<br />
will require management to submit to<br />
the regulator a plan demonstrating how<br />
it will rectify the breach.<br />
Introduction of a minimum capital<br />
requirement. The regulation also introduces<br />
a minimum capital requirement,<br />
which should be an absolute minimum<br />
level of capital, a breach of which would<br />
result in ultimate regulatory intervention.<br />
Market participants expect that the<br />
corridor for the requirement will range<br />
between 25% and 45% of the solvency<br />
capital requirement. CW<br />
For more articles on this topic search RatingsDirect with keyword:<br />
<strong>Wind</strong><br />
Analytical Contacts:<br />
Trevor D’Olier-Lees<br />
New York (1) 212-438-7985<br />
Arthur F. Simonson<br />
New York (1) 212-438-2094<br />
Ian Greer<br />
Melbourne (61) 3-9631-2032<br />
Jonathan Manley<br />
London (44) 20-7176-3952<br />
Stephen Coscia<br />
New York (1) 212-438-3183
Support For Renewable Energy<br />
Inches Ahead While Global Energy<br />
Demand Grows By Leaps And Bounds<br />
Overview<br />
● Global energy consumption is estimated to increase roughly 2% a year through<br />
2030. At this rate, energy use would double every 35 years.<br />
● <strong>Wind</strong> power represented just 1.5% of global electricity production by the end of 2008.<br />
● The U.S. will need significant investment, possibly as much as $93 billion, in<br />
transmission lines to carry electricity from regions that generate the most wind<br />
power to areas where demand is highest.<br />
● If the U.S. is to reach any of its milestones, states will have to play an important role.<br />
● Solar power may provide a more cost-effective alternative to wind power.<br />
With energy consumption worldwide projected to<br />
roughly double in the next 35 years, conventional<br />
wisdom says renewable sources of power will play a<br />
big role in meeting demand.<br />
<strong>Standard</strong> & Poor’s Ratings Services CreditWeek | May 23, 2012 23
FEATURES<br />
24 www.creditweek.com<br />
SPECIAL REPORT<br />
The conventional wisdom may be wrong.<br />
Cost, feasibility, and political wrangling<br />
all stand in the way of near-term renewable-energy<br />
expansion, globally and in the<br />
U.S. The sputtering economic recovery in<br />
the U.S. (combined with historically low<br />
natural gas prices) and a wave of austerity<br />
sweeping through Europe’s legislatures<br />
are not fostering a celebratory mood<br />
when governments propose spending on<br />
renewable-energy infrastructure. Even<br />
fast-growing economies in Asia, where<br />
energy consumption looks set to far outpace<br />
that in other regions, seem content<br />
to rely on fossil fuels for the time being.<br />
Global energy consumption will<br />
increase roughly 2% a year through 2030,<br />
according to estimates by the International<br />
Energy Agency (IEA). At this rate, energy<br />
use would double every 35 years. The IEA<br />
predicts that the highest growth will be in<br />
Asia, at about 3.7% a year, and countries<br />
outside the Organization for Economic<br />
Cooperation and Development, at approximately<br />
3%. The lowest growth in consumption<br />
will likely be in Europe, at about<br />
1% per year.<br />
Now consider that about 80% of<br />
the world’s energy needs are met<br />
using fossil fuels. In the U.S., for<br />
example, nearly half of the electricity<br />
production comes<br />
from coal. Yet, wind power,<br />
which is among the world’s<br />
fastest-growing sources of<br />
renewable energy, represented<br />
just 1.5% of global<br />
electricity production by<br />
the end of 2008. Europe is<br />
light years ahead of the rest<br />
of the world in using it.<br />
Europe accounts for more than<br />
half of the world’s total wind energy<br />
capacity and boasts seven of the world’s<br />
10 biggest markets for wind-powered<br />
electricity. <strong>Wind</strong> power generation in<br />
Europe will increase roughly 9% a year<br />
until 2030, according to the Wall Street<br />
Journal. By contrast, the U.S. accounts<br />
for only about 2% of global generation<br />
and produces enough wind-powered<br />
electricity for just 13 million of the<br />
country’s 115 million homes.<br />
The U.S. Department of Energy (DOE)<br />
plans to narrow that gap significantly in<br />
the next two decades. The DOE says<br />
wind power could meet 20% of total U.S.<br />
electricity demand by 2030, up from<br />
about 3% now. This new capacity would<br />
replace half of the natural gas-powered<br />
generation and 18% of the coal-fired<br />
generation. The National Renewable<br />
Energy Laboratory (NREL), which is<br />
funded by the DOE, is even more ambitious.<br />
It suggests that the Eastern U.S.,<br />
where onshore-wind resources are in<br />
short supply, could meet 20% of the total<br />
demand by 2024.<br />
Money For <strong>Wind</strong> Power<br />
Doesn’t Grow On Trees<br />
Clearly, costs come into play with<br />
plans of this magnitude. The country<br />
would need significant investment in<br />
transmission lines to carry electricity<br />
from regions that generate the most<br />
wind power to areas where demand is<br />
highest. The cost to achieve the<br />
NREL’s target could run to $93 billion,<br />
the group says.<br />
In addition, reaching the 20% goal<br />
would probably require substantial<br />
investment in offshore wind power<br />
infrastructure, which doesn’t currently<br />
exist in the U.S.<br />
The DOE predicts<br />
offshore wind could<br />
deliver about 17% of<br />
the total supply in the<br />
U.S. And although offshore<br />
wind power generation<br />
is generally<br />
more reliable than<br />
onshore power generation,<br />
offshore power is<br />
also more expensive.<br />
Generally, environmentalists<br />
welcome the focus on renewable-energy<br />
sources because of the promised reduction<br />
in fossil fuel pollution. But, some<br />
groups oppose offshore wind farms<br />
because of concerns about their effects<br />
on marine life, potential impediments to<br />
fishing and boating, and, perhaps most<br />
vehemently, what some consider the<br />
“visual pollution” that acres and acres of<br />
windmills would create. Such disputes<br />
are not confined to local residents.<br />
American real estate tycoon Donald<br />
Trump has threatened to sue Scotland if
Many of the studies showing the economic and<br />
environmental benefits of renewable energy may,<br />
however, be little more than mathematical exercises.<br />
the nation continues its plan to build a<br />
wind farm off its east coast, less than a<br />
mile from a luxury golf course Trump<br />
recently built—a plan, he says, he was<br />
promised would not come to fruition.<br />
In any case, the economic feasibility of<br />
pouring federal money into renewable<br />
energy, especially with Washington’s<br />
continual bickering over the U.S. deficit,<br />
is a matter of debate. Proponents cite<br />
national security interests for their support<br />
for increasing investment. They see<br />
decreasing—or ideally eliminating—U.S.<br />
reliance on energy-producing materials<br />
from other countries as a top priority.<br />
Other proponents say the industry could<br />
generate tens of thousands of jobs and<br />
pump billions of dollars into the<br />
economy. Opponents suggest these<br />
numbers are inflated, at best, and fail to<br />
recognize the substantial initial investment<br />
required. Nonetheless, the U.S.<br />
wind power industry received 42% of all<br />
federal subsidies for electricity generation<br />
in 2010, according to the Energy<br />
Information Administration (EIA).<br />
If the U.S. is to reach any of the<br />
aforementioned milestones, states will<br />
have to play an important role.<br />
California, often in the vanguard of<br />
renewable-energy advancements, has<br />
more than doubled its wind-power<br />
capacity in the past decade, and wind<br />
now supplies about 5% of the state’s<br />
electricity needs. On the other side of<br />
the country, a study by the Community<br />
Foundation for the Alleghenies showed<br />
that boosting the renewables portion of<br />
Pennsylvania’s so-called alternativeenergy<br />
portfolio standard would be a<br />
boon to the state’s economy. Increasing<br />
renewable-energy sources there to 15%<br />
by 2026 from the current target of 8%<br />
could create more than 125,000 new<br />
jobs and add more than $25 billion to<br />
Pennsylvania’s economy.<br />
Greater Use Of Solar Power<br />
Could Make More States<br />
“The Sunshine State”<br />
Solar power may provide a more costeffective<br />
alternative to wind power.<br />
Although installing a solar energy<br />
system is often expensive, the capacity<br />
for generation is, theoretically, limitless,<br />
and the cost of energy from it is, essentially,<br />
zero—thus producing savings that<br />
would continue long after the system’s<br />
cost has been recouped. Again, the<br />
latter point is debatable, considering<br />
that the lifespan of solar-energy systems<br />
is finite, and replacing them carries<br />
significant costs.<br />
Currently, solar power contributes only<br />
about 0.1% of U.S. electricity production,<br />
according to 2009 figures from the IEA.<br />
But, U.S. solar capacity is growing<br />
quickly, increasing 17% in 2007 alone,<br />
according to the Solar Energy Industries<br />
Assn. trade group. Other industry groups<br />
predict solar power use will meet 10% of<br />
the country’s energy needs by 2025.<br />
Many of the studies showing the economic<br />
and environmental benefits of<br />
renewable energy may, however, be little<br />
more than mathematical exercises. Both<br />
the EIA and IEA predict that the biggest<br />
increases in global energy consumption<br />
will come in fossil fuels: oil, coal, and<br />
natural gas. Although the groups say the<br />
generation and use of renewable-energy<br />
sources will also grow, they will pale by<br />
comparison. In fact, the groups say consumption<br />
of fossil fuels will be twice as<br />
high in 2020 as it is today. CW<br />
Writer: Joe Maguire<br />
For more articles on this topic search RatingsDirect with keyword:<br />
<strong>Renewables</strong><br />
Analytical Contact:<br />
Beth Ann Bovino<br />
New York (1) 212-438-1652<br />
<strong>Standard</strong> & Poor’s Ratings Services CreditWeek | May 23, 2012 25
FEATURES<br />
26 www.creditweek.com<br />
SPECIAL REPORT
U.S. <strong>Offshore</strong> <strong>Wind</strong><br />
Investment Needs More<br />
Than A Short-Term<br />
Production Tax Credit Fix<br />
Overview<br />
● <strong>Offshore</strong> wind projects offer a potentially vast source of clean energy. But this<br />
technology is much more expensive than onshore applications, and it has a long<br />
and costly development cycle.<br />
● Financial support, direct and indirect, can take many forms and can vary by the<br />
type of technology to be used.<br />
● Federal production and investment tax credits (PTCs and ITCs) are the key<br />
support mechanisms for attracting investment in renewable energy.<br />
● The PTC as enacted is more helpful to onshore wind projects than offshore ones.<br />
● Cash grants and state Renewable Portfolio <strong>Standard</strong>s (RPS) are other viable<br />
sources of support.<br />
Renewable energy sources usually produce electricity more<br />
cheaply than the conventional fuels that supply most<br />
markets. Investment in renewable energy depends on<br />
direct and indirect government support. Support programs have<br />
been successful in encouraging investment, but they involve a<br />
public cost, are subject to politics, and can have positive and<br />
negative effects on supply markets. Until recently, many<br />
countries considered the cost acceptable, but the recent financial<br />
crisis in Europe and record budget deficits in the U.S. have put<br />
such support under the public microscope. The outcome may<br />
not be favorable for achieving sustainable growth, a key<br />
characteristic of any successful industry.<br />
<strong>Standard</strong> & Poor’s Ratings Services CreditWeek | May 23, 2012 27
FEATURES<br />
28 www.creditweek.com<br />
SPECIAL REPORT<br />
The U.S. wind power industry is dealing<br />
with the same issue and trying to get<br />
Congress to continue the main source of<br />
federal support, the production tax credit<br />
(PTC), beyond the end of 2012. This support<br />
has enabled rapid industry growth in<br />
onshore wind during the past decade.<br />
Without the PTC, investment drops quickly.<br />
A new element to the debate is how to provide<br />
support for investment in offshore<br />
wind projects, which can provide substantial<br />
amounts of clean energy but at a high<br />
cost. The difficult permitting process and<br />
long development cycle of offshore wind<br />
do not match well with a short-term PTC<br />
extension. Policymakers need to consider<br />
other options of funding if they want to see<br />
the role of offshore wind expand.<br />
<strong>Offshore</strong> wind projects offer a potentially<br />
vast source of clean energy, especially<br />
near large northeastern population<br />
centers. Many states along the Eastern<br />
Seaboard are very interested in exploiting<br />
this energy potential and reaping the benefits<br />
from the port, marine, and supply<br />
industries that would follow. But, offshore<br />
wind technology is much more expensive<br />
than onshore applications and has a long<br />
and costly development cycle that is not<br />
well-suited to short-term federal support<br />
schemes. <strong>Offshore</strong> wind in the U.S. also<br />
lacks a well-functioning and timely regulatory<br />
approval process (see “Policy<br />
Framework Background For Key Countries,”<br />
in the article titled, “Strong Growth Of<br />
Global <strong>Offshore</strong> <strong>Wind</strong> Power Provides Big<br />
Opportunities For Project Finance,” published<br />
May 16, 2012, on RatingsDirect, on<br />
the Global Credit Portal).<br />
In sharp contrast, several European<br />
countries have adopted a number of<br />
policies that have led to large growth in<br />
offshore wind, and the U.K. and<br />
Germany have the most new construction<br />
and potential (see chart).<br />
Government Support<br />
Takes Many Forms<br />
Support for renewable energy globally has<br />
developed in three phases, and a fourth has<br />
emerged recently in Germany. Initial support<br />
was to achieve energy dependency,<br />
especially since the oil crisis of the 1970s.<br />
The next phase came in the 1980s, when<br />
renewable energy emerged as the best way<br />
to meet climate-change goals. More<br />
recently, renewable energy policy has been<br />
geared toward the creation of “green technology”<br />
manufacturing jobs that will hopefully<br />
jump-start economies. Finally, a large<br />
increase in renewable energy sources will<br />
be the only way Germany can successfully<br />
retire its nuclear energy plants within a<br />
decade, and offshore wind will play an<br />
important role there.<br />
Support, direct and indirect, can take<br />
many forms and can vary by the type of<br />
technology to be used. Direct support<br />
includes feed-in tariffs (FITs), which<br />
Canada, Germany, Spain, and other<br />
countries use in various forms. Denmark<br />
uses a long-term agreement based on<br />
tender offers. And the U.S. government<br />
attracts investment through production<br />
and investment tax credits and favorable<br />
accounting treatments.<br />
At the other end of the spectrum is<br />
indirect support, which usually involves<br />
regulatory mandates that require utilities<br />
to include a certain share of their total<br />
supply from renewable energy. There are<br />
usually penalties for not meeting the<br />
requirements. The U.K. <strong>Renewables</strong><br />
Obligation and U.S. state Renewable<br />
Portfolio <strong>Standard</strong>s fall into this category.<br />
Another form of indirect support is<br />
a carbon tax on carbon-intensive users,<br />
which raises the cost of fossil fuels and<br />
makes renewable sources more pricecompetitive.<br />
Australia is implementing a<br />
carbon tax in July 2012.<br />
U.S. Tax Credits Highlight<br />
The Incompatibility Of<br />
Short-Term Support And<br />
Long Project Development<br />
Federal PTCs and investment tax credits<br />
(ITCs) are the key support mechanisms<br />
for attracting investment in renewable<br />
energy. U.S. onshore wind capacity has<br />
grown tenfold since 2002, from about<br />
4,700 MW to nearly 47,000 MW today,<br />
largely because of the PTC.<br />
A wind project earns the PTC for each<br />
kilowatt hour of production for the first<br />
10 years of operation. A project must be<br />
operational before the PTC enactment<br />
period expires. At about 2.2 cents, the<br />
PTC can provide about 20% of the<br />
installed cost of an onshore wind project.
PTCs cannot be sold to third parties but<br />
must remain with the project.<br />
The PTC has several favorable elements.<br />
Remuneration is based on production,<br />
which encourages using the best<br />
wind resources available. It also requires<br />
investment discipline. No one is forced to<br />
buy a project’s power, so the project must<br />
make itself attractive to purchasing utilities<br />
and allocate risk appropriately<br />
through power-purchase agreements<br />
(PPAs) or other means. Remuneration<br />
also does not rely on a government<br />
outlay, but rather on a reduced payment<br />
to the government—always a plus. This<br />
better ensures that the project can realize<br />
the full PTC value over 10 years, though<br />
some risk remains. Lastly, as a federal tax<br />
break, the PTC essentially transfers much<br />
of the higher cost of renewable energy to<br />
the federal taxpayer and away from the<br />
local utility and thus customers.<br />
But the PTC as enacted is not as<br />
helpful to offshore wind projects. One<br />
major drawback of the PTC is the uncertainty<br />
of its availability. The PTC is usually<br />
enacted for a short period, usually<br />
about two years. Sometimes, Congress<br />
extends it before it expires, but Congress<br />
has also let it lapse and then renewed it a<br />
few months later. In effect, the PTC is<br />
more unpredictable than wind itself.<br />
Onshore wind projects can deal with this<br />
short tenor because of quick approval<br />
and short construction times. But, this<br />
uncertainty leads to rapid project development<br />
and construction before the<br />
PTC’s expiration, which introduces some<br />
risk about how well construction was<br />
performed and whether it went over<br />
budget in the rush to chase scarce<br />
resources. It also leads to boom-andbust<br />
investment cycles that discourage<br />
major foreign equipment suppliers from<br />
investing in domestic manufacturing and<br />
spare parts, which then results in continued<br />
reliance on import availability and<br />
foreign exchange risk. This keeps costs<br />
high when they need to decline.<br />
The uncertainty aspect also leads to<br />
massive spending on lobbying the government<br />
every couple of years to continue<br />
the program rather than on R&D to<br />
improve technology and reduce unit<br />
costs, which would then reduce reliance<br />
on subsidies. Finally, if the wind<br />
resource falls short of expectations, the<br />
PTC value does too, creating uncertain<br />
returns to investors.<br />
Another limitation of the PTC is that it<br />
limits the developer pool and, more<br />
important, the investor pool. The boomand-bust<br />
nature of the industry results in<br />
large firms, which can withstand bust<br />
cycles, crowding out small developers<br />
that often initially develop the deals that<br />
are then sold to larger players.<br />
The investor aspect is more complex.<br />
Projects usually do not have enough tax<br />
exposure to gain the full value of the<br />
PTC. So, projects turn to—and become<br />
dependent on—tax equity investors.<br />
This limits the investor pool to entities<br />
with tax exposure, which eliminates a<br />
much-needed wider investor base. The<br />
early Danish model required local investment,<br />
a key reason behind wind power’s<br />
wide acceptance there now. The financial<br />
crisis in the U.S. led to a great reduction<br />
in tax equity investment pools<br />
because wind projects were not willing<br />
to pay the higher returns the tax equity<br />
pools wanted. When the PTC expires,<br />
the tax equity pool dries up, and investment<br />
declines. When financial markets<br />
contract, most tax equity evaporates,<br />
and the same thing occurs. Tax equity<br />
monetization also creates additional<br />
legal and structural complexity for wind<br />
projects, which costs time and money<br />
and adds to cost. It is also not so attrac-<br />
<strong>Offshore</strong> <strong>Wind</strong> Capacity In The U.K. And Germany<br />
Cumulative installations<br />
(MW)<br />
4,000<br />
3,500<br />
3,000<br />
2,500<br />
2,000<br />
1,500<br />
1,000<br />
U.K. Germany<br />
500<br />
0<br />
tive to capital market investors, who<br />
want stable cash flow allocation.<br />
The investment tax credit has similar<br />
strengths and weaknesses. A project gets<br />
an ITC up to a certain amount based on<br />
the actual cost of the project. This support<br />
scheme has been used recently as a<br />
temporary stimulus tool for wind projects.<br />
An advantage of the ITC is that it<br />
provides a known tax value, which can be<br />
beneficial for offshore wind, given its<br />
greater uncertainty of production (and<br />
therefore PTC value) because of new turbine<br />
technology and uncertain wind farm<br />
performance. Ironically, the ITC is the<br />
current federal support scheme for solar<br />
projects, which have more predictable<br />
revenue streams than wind power.<br />
The downside of the ITC is the uncertainty<br />
of its availability over the long<br />
term and the reliance on the tax equity<br />
base. The ITC also does not encourage<br />
use of the best wind resources.<br />
Cash grants and state support<br />
are other options<br />
The cash grant is the third tier of direct<br />
federal support, but its longevity is also<br />
in question. The federal government<br />
used this tool as part of the federal stimulus<br />
program. After completion of construction,<br />
it provides a nontaxable cash<br />
grant equal to 30% of the project costs<br />
in lieu of, if desired, the PTC.<br />
Advantages of this tool, beyond its large<br />
size, are that it is predictable and trans-<br />
2003 2004 2005 2006 2007 2008 2009 2010 2011 2012 2013<br />
MW—Megawatts.<br />
Source: 4C <strong>Offshore</strong>.<br />
© <strong>Standard</strong> & Poor’s 2012.<br />
<strong>Standard</strong> & Poor’s Ratings Services CreditWeek | May 23, 2012 29
FEATURES<br />
30 www.creditweek.com<br />
SPECIAL REPORT<br />
parent because it is based on investment,<br />
and the project does not have to<br />
rely on tax equity, so the developer and<br />
investor pools are expanded.<br />
Disadvantages are the grant’s reliance<br />
on the federal government. Risk is higher<br />
for projects with long development and<br />
construction periods, such as offshore<br />
wind. Second, because offshore wind<br />
projects will probably be large, grants<br />
would be, too. This could lead to socalled<br />
“headline risk” like what occurred<br />
with solar panel maker Solyndra. The<br />
potential public backlash could hurt the<br />
nascent industry.<br />
The fourth tier of support is the state<br />
Renewable Portfolio <strong>Standard</strong> (RPS),<br />
whereby utilities are required to provide<br />
a share of electricity supply from renewable<br />
resources by a certain date, and<br />
noncompliance is subject to penalty payments.<br />
According to the Database of<br />
State Incentives for Renewable Energy,<br />
29 states and the District of Columbia<br />
have RPS requirements, and eight others<br />
have RPS goals. All states along the<br />
Eastern Seaboard, where offshore wind<br />
potential is greatest, have RPS requirements<br />
except Virginia, which has a goal.<br />
Some programs include measures for<br />
specific technologies, but offshore wind<br />
is not among them.<br />
The RPS scheme has attracted investment.<br />
Largely to meet their RPS goals,<br />
utilities in Massachusetts have agreed to<br />
purchase a large portion of the output<br />
from the planned 468 MW Cape <strong>Wind</strong><br />
project in Nantucket Sound. A Delaware<br />
utility agreed to buy output from the<br />
recently cancelled 450 MW Bluewater<br />
<strong>Wind</strong> project. The lack of PTC certainty<br />
undermined this project.<br />
Other state support schemes can be<br />
beneficial, too. A Rhode Island contracting<br />
standard for renewable energy<br />
resulted in the PPA for Deepwater<br />
<strong>Wind</strong>’s planned 30 MW Block Island offshore<br />
project.<br />
Germany Is FIT For Growth<br />
Germany has been very successful using<br />
the FIT scheme to greatly expand<br />
onshore and now offshore wind projects.<br />
The FIT has many variations, but it generally<br />
guarantees a set price for energy<br />
fed into the grid. The price can be<br />
market-independent—such as fixed, or<br />
fixed with an inflation adjustment—or be<br />
market-dependent—such as a spread<br />
over the market rate. The German<br />
system is market-independent. Suppliers<br />
are required to take the electricity supplied,<br />
and rate payers (business and residential<br />
electricity customers) pay<br />
increased electricity costs per kilowatt<br />
hour (kWh) on their monthly bills.<br />
Advantages of the FIT are ease of<br />
administration, providing developers a<br />
known price for a known period, and<br />
eliminating the chore of negotiating a<br />
PPA with the buyer. In some countries,<br />
the FIT is combined with the requirement<br />
that the electricity grid operator build out<br />
the system to accommodate renewable<br />
projects feeding in. This greatly reduces<br />
the cost of offshore wind projects and<br />
makes them easier to finance. This<br />
arrangement also leads to a wide pool of<br />
developers and investors and has been<br />
highly successful—thus far. Germany<br />
declines the FIT prices for future projects<br />
to force cost reduction. The U.S. federal<br />
PTC works just the opposite.<br />
Disadvantages of this scheme are<br />
potentially very big. The FIT relies on the<br />
government to set the price to bring in<br />
the amount of electricity needed, a role<br />
governments do not excel at. If the price<br />
is set too high, investment is rapid and far<br />
exceeds the supply chain, leading to<br />
industry imbalance. When overbuilding<br />
occurs or appears imminent, the government<br />
lowers the incentives. If the reduction<br />
in support is large, investment plummets<br />
and the supply chain is damaged.<br />
This happened recently with the solar<br />
photovoltaic industries in Spain and Italy.<br />
Right now, the German government<br />
offers favorable support for offshore wind<br />
to help fill the supply gap that will result<br />
as it retires its nuclear plants over the<br />
next decade. The risk is whether the current<br />
terms are sustainable.<br />
The U.K. ROCs On<br />
The U.K. has quickly become the world<br />
leader in offshore wind power thanks to<br />
the Renewable Obligation program and<br />
favorable subsidies. Like most support<br />
programs, though, the cost is high and a
continual topic of intense debate. The<br />
program was created in 2002 to help the<br />
U.K. meet its climate-change goal, which<br />
now is to use wind power to supply 20%<br />
of its electricity by 2020. The program<br />
obligates licensed electricity suppliers in<br />
the U.K. to purchase an increasing proportion<br />
of electricity from renewable<br />
sources, similar to a U.S. state RPS.<br />
Failure to meet the requirement results<br />
in a penalty for the supplier.<br />
The program supports renewable<br />
energy with a production-based subsidy<br />
called the Renewable Obligation Credit<br />
(ROC). A project earns for 20 years the<br />
wholesale price of electricity plus the ROC<br />
price for every megawatt hour (MWh) of<br />
electricity delivered, plus other levy reductions.<br />
The ROC price is market-based but<br />
influenced by policy. To encourage use of<br />
different technologies, the program may<br />
allocate more than one ROC for each<br />
MWh of production. For example, offshore<br />
wind projects receive 1.9 ROCs per<br />
MWh production. The variation in ROC<br />
valuing is known as “banding.”<br />
The ROC scheme has many positive<br />
attributes, depending on one’s point of<br />
view. Projects benefit from two revenue<br />
streams, the market price and the ROC<br />
price, much like a U.S. merchant energy<br />
project. Because the price is not fixed,<br />
equity holders could earn a higher profit<br />
margin than those in Germany, for<br />
example, where the FIT price is fixed for<br />
20 years. This may result in exploitation<br />
of superior wind resources or just bigger<br />
equity bets. Finally, the scheme does not<br />
rely on a government payment.<br />
One disadvantage of ROCs is that<br />
remuneration is based on two variable<br />
revenues streams, which might lead to<br />
larger firms dominating the market<br />
because they are better able to mitigate<br />
their market exposure than small firms.<br />
As with FITs, the government sets the<br />
banding value. If too high, too much<br />
investment occurs; if too low, the government<br />
loses credibility. It is much<br />
easier for the government to change the<br />
scheme to meet ever-changing goals<br />
than for the industry to respond, which,<br />
again, puts the stability of long-term<br />
industry growth at risk. Recently, the<br />
government changed the banding value<br />
for offshore wind, favorably, to 1.9 from<br />
2.0. But, the very rapid growth in offshore<br />
wind projects in the U.K. introduces<br />
the risk that the government could<br />
change the pricing scheme appreciably<br />
and damage industry sustainability.<br />
The U.S. Has Far To Go To Catch<br />
Up With European <strong>Wind</strong> Energy<br />
The U.S. wind industry is in the same situation<br />
today that it faced in 2001, 2003,<br />
and 2005: lobbying the public and<br />
Congress to extend the PTC, which<br />
expires at the end of this year. House<br />
and Senate bills are in play that would<br />
extend the PTC four years and two<br />
years, respectively. Any extension would<br />
lead to more investment in onshore wind<br />
projects, at least until the next expiration<br />
date looms and uncertainty again slows<br />
down investment.<br />
An extension might be helpful to offshore<br />
wind projects that are in an<br />
advanced stage—especially Cape <strong>Wind</strong>,<br />
which does not have PPA coverage for<br />
all capacity—if they can begin commercial<br />
operation before the new PTC term<br />
ends. But an extension would provide<br />
little support to offshore wind projects in<br />
early stages of development; it is hard to<br />
stomach spending millions on development<br />
when a key source of federal support<br />
is needed but highly questionable.<br />
This is why the PTC program in its current<br />
form does not effectively support<br />
offshore wind investment.<br />
The European experience illustrates<br />
three things: <strong>Offshore</strong> wind projects are<br />
feasible, the industry’s investment potential<br />
is vast, and some long-term support<br />
schemes have been effective in attracting<br />
investment, at least so far. Support<br />
schemes can change quickly and badly,<br />
as the solar photovoltaic industry has discovered.<br />
European programs provide far<br />
more long-term revenue certainty than<br />
U.S. programs, and that is one reason<br />
why offshore wind investment is growing<br />
rapidly there and not here. CW<br />
For more articles on this topic search RatingsDirect with keyword:<br />
<strong>Offshore</strong> <strong>Wind</strong><br />
Analytical Contact:<br />
Terry A. Pratt<br />
New York (1) 212-438-2080<br />
<strong>Standard</strong> & Poor’s Ratings Services CreditWeek | May 23, 2012 31
FEATURES<br />
32 www.creditweek.com<br />
SPECIAL REPORT | Q&A
Credit FAQ<br />
Why Regulatory Risk<br />
Hinders Renewable Energy<br />
Projects In Europe<br />
Ambitious targets for clean energy generation in the EU<br />
have put renewable energy at the forefront of discussions<br />
about how to meet Europe’s future energy needs. And<br />
political reactions to the recent nuclear crisis in Japan—which<br />
prompted Germany, for example, to shift its energy policy toward<br />
renewables and away from nuclear—are also fueling the interest<br />
in renewable energy.<br />
But despite the momentum behind renewables,<br />
<strong>Standard</strong> & Poor’s Ratings Services<br />
sees signs that regulatory risk is becoming<br />
a bigger issue for these projects. One<br />
example is the recent decision by the<br />
Spanish and Czech governments to adjust<br />
their regulatory support frameworks,<br />
including subsidies, for existing renewables<br />
projects, in part retroactively. Because we<br />
consider regulation to be a key rating<br />
factor in our assessment of renewable<br />
energy projects, alongside technical factors<br />
such as efficiency and fuel sources<br />
(sun, wind, or hydro), we’ve been watching<br />
these developments closely.<br />
In this FAQ, we answer investors’ frequently<br />
asked questions about our<br />
assessment of regulatory risk in renewable<br />
energy projects and identify potential<br />
areas of credit concern.<br />
Q. What is <strong>Standard</strong> & Poor’s approach<br />
to analyzing renewable energy projects?<br />
A. As for any other single-asset nonrecourse<br />
financing, we analyze renewable<br />
energy projects using our project finance<br />
criteria, which we supplement with a<br />
review of the key credit factors specific<br />
to the renewable technology in question.<br />
In essence, we evaluate projects case<br />
by case, taking into account the predictability<br />
of a project’s cash flow and<br />
comparing this cash flow with the project’s<br />
debt repayment profile.<br />
Q. Why has regulatory risk become<br />
more significant for European renewable<br />
energy projects?<br />
A. In our opinion, budgetary constraints<br />
in the public sector and the need to implement<br />
severe austerity measures in some<br />
countries are calling into question the sustainability<br />
of financial support for renewable-energy<br />
development in Europe.<br />
Regulated incentives for renewable<br />
energy projects often underpin their<br />
financial viability: For instance, subsidies<br />
for solar power projects in Europe can<br />
account for up to 85% of their initial revenues.<br />
This, in our view, illustrates the<br />
importance of predictable, ongoing financial<br />
support for renewable energy projects,<br />
and highlights the credit risk associated<br />
with any changes to this support.<br />
<strong>Standard</strong> & Poor’s Ratings Services CreditWeek | May 23, 2012 33
FEATURES<br />
Share in 2010 Target share in 2020*<br />
U.K.<br />
Italy<br />
France<br />
Spain<br />
Germany<br />
34 www.creditweek.com<br />
SPECIAL REPORT | Q&A<br />
6.6% 15.0%<br />
6.6% 17.0%<br />
*As defined under EU Directive 2009/28/EC.<br />
© <strong>Standard</strong> & Poor’s 2011.<br />
15.5% 23.0%<br />
11.3% 20.0%<br />
11.0% 18.0%<br />
Q. How does <strong>Standard</strong> & Poor’s determine<br />
whether the regulatory system is<br />
likely to support a project’s credit quality?<br />
A. We aim to determine the contractual<br />
and regulatory arrangements under<br />
which the renewable energy project will<br />
operate, and assess their supportiveness<br />
at the outset of the project and<br />
over its lifetime.<br />
In analyzing the regulatory framework<br />
for a given asset, we start by evaluating<br />
the form of support commitment.<br />
Regulatory support to any given project<br />
in any given country normally can be in<br />
the form of either a decree or law<br />
approved by the government or parliament,<br />
or a power purchase agreement or<br />
other offtake agreement with a utility<br />
managed by a specific industry sector<br />
regulator, or administered through a con-<br />
Chart 1 Share Of Energy Consumption From Renewable Energy Sources<br />
Within Selected European Countries Versus EU 2020 Target<br />
Chart 2 Evolution Of Spanish Feed-In Tariffs 2007 To 2011<br />
(¤ /KWh)<br />
50<br />
45<br />
40<br />
35<br />
30<br />
25<br />
20<br />
15<br />
10<br />
5<br />
0<br />
ably above market cost to be at the<br />
greatest risk of cutbacks, especially in<br />
times of economic stress and budgetary<br />
controls. Furthermore, the<br />
gradual decline in production costs as<br />
a technology matures may exacerbate<br />
the political pressure to reduce visible<br />
incentives such as FITs. Although the<br />
rate of return of a project is not a key<br />
factor in our analysis of creditworthiness,<br />
we’ve observed that very high<br />
expected returns (exceeding 20% to<br />
25%), which have been common for<br />
renewable energy projects in the past<br />
few years, may also indicate a high<br />
risk of regulatory changes. When the<br />
electorate perceives that the returns<br />
for well-established and low-risk projects<br />
and technologies are high, it can<br />
erode the political support for regulatory<br />
frameworks allowing such<br />
returns. We witnessed such an effect<br />
in the Czech Republic.<br />
● Affordability. We compare the direct<br />
cost to the government of the FITs and<br />
tax incentives with the government’s<br />
current and expected budgetary and<br />
debt positions in relation to its budgetary<br />
and debt targets. Those countries<br />
in which this support represents a<br />
higher proportion of GDP are the most<br />
at risk of regulatory changes, in our<br />
view, especially if they are under budgetary<br />
pressure. We believe that a government’s<br />
incentive to reduce subsidies<br />
on future projects (or even those that<br />
are already operational) will increase in<br />
line with its budgetary constraints and<br />
will be higher if the potential cuts yield<br />
significant savings (we discuss this further<br />
in the final question). Continued<br />
subsidies in those countries where<br />
there is already a deficit of funding for<br />
energy tariffs, such as Spain, are also<br />
more at risk, in our opinion.<br />
● Control mechanisms. We view a cap<br />
on installed capacity as credit positive<br />
in any regulatory regime, insofar as it<br />
may prevent unsustainable growth of<br />
subsidies. The absence of caps in the<br />
regulatory framework allow for uncontrolled<br />
growth, which then translates<br />
into subsidy payments that may be too<br />
high for the economy to uphold. This<br />
was a significant factor behind the<br />
recent revisions by Spain and the<br />
Czech Republic of their solar PV regulatory<br />
frameworks.<br />
● The effectiveness of the grid management.<br />
Ineffective management of the<br />
electricity grid may increase the cost<br />
of back-up energy supplies considerably,<br />
in our view.<br />
Q. Are FITs the only incentive <strong>Standard</strong> &<br />
Poor’s considers when assessing regulation<br />
and regulatory risk?<br />
A. No. When evaluating the credit<br />
quality of a renewable energy project,<br />
we look at all incentives the regulatory<br />
framework provides to the project from<br />
the outset. FITs are just one aspect of<br />
the support regime in Europe, albeit a<br />
more visible and potentially controversial<br />
one, because they are paid directly<br />
to the generator. Other features of<br />
European regulatory frameworks, the<br />
revision of which may affect the economic<br />
viability of a project, include:<br />
● Providing priority access to the market<br />
and/or distribution grid for electricity<br />
produced from a renewable source;<br />
● Providing green certificates to generators<br />
for the electricity they produce<br />
from renewable sources. These certificates<br />
can be traded, usually to firms<br />
that do not have sufficient renewables<br />
in their energy mix; and<br />
● Favorable tax treatment for the initial<br />
project investment, or for profits linked<br />
to renewable energy production.<br />
Q. When analyzing renewable energy<br />
projects, does <strong>Standard</strong> & Poor’s<br />
assume that regulatory support will<br />
remain constant?<br />
A. No. We would anticipate that the support<br />
for a given transaction, as defined at<br />
the outset, would be honored and<br />
remain stable over the life of that transaction.<br />
However, the regulatory regime<br />
within a country will evolve over time: In<br />
our experience, transparent regulations<br />
will explicitly mention a fixed level of<br />
subsidies to projects over a certain<br />
period or until, say, a target level of<br />
installed capacity is reached. At that<br />
point, a new regulation (in the form of a<br />
decree or law) replaces the old one and<br />
new, possibly lower, subsidies will apply<br />
to any new projects.<br />
Over the past few months, for<br />
instance, regulatory revisions across<br />
The absence of caps in the regulatory framework<br />
allows for uncontrolled growth…<br />
Table 1 | Comparison Of Consumer Electricity Prices And Tariff Rates Paid To<br />
Generators In Europe In 2011<br />
Average electricity rates in 2011 (€/KWh) Germany Spain France Italy Czech Republic<br />
Household electricity rate 25 19 13 21 16<br />
Industrial electricity rate<br />
(at a consumption level of 2,000 MWh/year) 12 12 7 13 12<br />
Industrial electricity rate<br />
(at a consumption level of 24,000 MWh/year) 9 9 6 11 10<br />
Tariffs paid to generators (€ /KWh)<br />
<strong>Wind</strong> (onshore) 5–9 7 8 30 11<br />
<strong>Wind</strong> (offshore) 13–15 7 31–58 30 11<br />
Solar PV 32–43 14–30 27–58 36–44 23<br />
Solar thermal — 28 — — —<br />
KWh-Kilowatt hour. MWh—Megawatt hour. Solar PV—Solar photovoltaic.<br />
Source: Europe’s Energy Portal.<br />
<strong>Standard</strong> & Poor’s Ratings Services CreditWeek | May 23, 2012 35
FEATURES<br />
Europe have led to reductions in the<br />
solar photovoltaic (PV) tariff ranging<br />
from 15% in Germany to 70% in the U.K.<br />
In Spain, subsidies to solar PV projects<br />
have fallen over the past four years as<br />
the government revised its FIT framework<br />
(see chart 2).<br />
In our view, the regulatory support for<br />
renewable energy will continue to erode in<br />
all main EU markets as the technology<br />
matures and the price per unit of power<br />
generated drops. We believe it’s likely that<br />
there will be a point at which support is no<br />
longer necessary, specifically when the<br />
unsupported cost of electricity generation<br />
from a given renewable source matches that<br />
from fossil fuels. However, we think this socalled<br />
“grid parity” price point is probably<br />
five or more years away, and will depend on<br />
the level of support in a given jurisdiction,<br />
the availability of the natural resource (wind<br />
or sun, for example), and the amount and<br />
speed of technological progress. That said,<br />
the implementation of carbon taxes and<br />
costs on the carbon-generating industries<br />
should hasten this grid parity.<br />
In the near term, we believe the policy<br />
choices of individual governments—<br />
many of which face an immediate period<br />
of financial austerity—will continue to<br />
determine the level of regulatory support.<br />
36 www.creditweek.com<br />
SPECIAL REPORT | Q&A<br />
Q. How does <strong>Standard</strong> & Poor’s assess<br />
uncompensated reductions in the regulatory<br />
support or incentives that were<br />
promised to a project at the outset?<br />
A. We anticipate—but do not automatically<br />
assume—that the support and<br />
incentives available at the start of a<br />
project will be sustained in line with the<br />
original documentation, which usually<br />
means over the life of the transaction. We<br />
view recent uncompensated revisions as<br />
evidence that there is an increased risk of<br />
future retroactive changes, and take this<br />
into account when assigning a new rating<br />
in a particular legislation.<br />
In evaluating the remedies a government<br />
or regulatory body puts in place to<br />
compensate for reductions in support for<br />
projects that are already operational, we<br />
focus on their impact on the credit<br />
quality of the transaction. First, we<br />
assess how the reduction in support<br />
affects the project’s ability to meet its<br />
debt service in full and on time. We then<br />
analyze whether the remedies will restore<br />
cash flow to the level expected at the<br />
outset of the project in each and every<br />
debt service payment period, or whether<br />
they aim only to restore the expected<br />
return over the life of the asset. While the<br />
Table 2 | Breakdown Of Feed-In Tariff Subsidies Paid To Renewable Energy<br />
Projects In Spain In 2010<br />
(Mil. €) <strong>Wind</strong> Solar PV Solar thermal<br />
Jan. 183 140 3<br />
Feb. 196 103 2<br />
March 207 119 2<br />
April 206 135 2<br />
May 213 209 10<br />
June 134 247 6<br />
July 172 289 17<br />
Aug. 117 276 21<br />
Sept. 124 318 30<br />
Oct. 133 293 29<br />
Nov. 118 261 29<br />
Dec. 187 222 23<br />
Total 1,990 2,612 174<br />
Share of total* 28% 37% 2%<br />
*The remaining 33% share of FITs, which takes the total subsidy for the year to €7 billion, is for other renewables<br />
such as hydro and biomass. Solar PV-Solar photovoltaic.<br />
Source: Comisión Nacional de Energía.<br />
former would preserve the project’s<br />
credit quality, the latter may not.<br />
Q. Does <strong>Standard</strong> & Poor’s apportion a<br />
similar level of regulatory risk to all<br />
renewable energy projects in a given<br />
jurisdiction, irrespective of fuel source?<br />
A. Not necessarily. For renewable<br />
energy projects in the same jurisdiction,<br />
we take into account each separate<br />
renewable energy source (wind, solar<br />
PV, solar thermal, or biomass, for<br />
example) and its specific regulation.<br />
Different regulations for different technologies<br />
or fuel types normally reflect<br />
variations in production costs and<br />
growth targets. These factors translate<br />
into different levels of sustainable financial<br />
support and, hence, variations in<br />
credit quality.<br />
For example, we observe that solar<br />
PV projects in Spain accounted for<br />
about 37% of the almost €7 billion in<br />
total subsidies granted to renewable<br />
energy projects in 2010, compared with<br />
about 2% for solar thermal (see table 2).<br />
This may explain why the regulatory<br />
changes Spain implemented at the end<br />
of 2010 were more onerous for solar PV<br />
projects than for solar thermal projects.<br />
Furthermore, solar thermal technology<br />
lags considerably behind that of other<br />
renewables like wind or solar PV. This<br />
highlights to us that the regulatory support<br />
available to solar thermal projects<br />
in Spain is more sustainable than that<br />
for solar PV projects.<br />
On the other hand, in most EU countries,<br />
wind projects account for a<br />
higher share of electricity generation<br />
than to other renewable energy<br />
sources, while receiving a considerably<br />
lower share of financial support. This<br />
makes wind less demanding on the<br />
public purse and its support more sustainable,<br />
in our view. CW<br />
For more articles on this topic search RatingsDirect with keyword:<br />
Renewable Energy<br />
Analytical Contacts:<br />
Jose R. Abos<br />
Madrid (34) 91-389-6951<br />
Vincent Allilaire<br />
London (44) 20-7176-3628
After A Decade Of <strong>Wind</strong> Power,<br />
The Unexpected Is Still<br />
Always Expected<br />
Over the past decade, the U.S. and Europe have undergone big<br />
shifts in their emphasis on renewable energy. Government<br />
policies and public perception have increasingly recognized<br />
the need for renewable energy to promote energy security, combat<br />
climate change, and, more recently, to create jobs. <strong>Wind</strong> power has<br />
developed into the renewable technology of choice, given its superior<br />
economics compared with most other renewable options. In addition,<br />
a long track record of operating performance helps investors to better<br />
evaluate the risks in wind power projects.<br />
Overview<br />
● The use of wind power continues<br />
to grow in the U.S. and in Europe.<br />
● All but one of the wind projects we<br />
rate have fallen to speculative-grade<br />
from investment-grade over time.<br />
● Technology and design problems,<br />
wind resource deficiencies, and<br />
certain problematic financial<br />
structure features are all weighing<br />
on these projects’ creditworthiness.<br />
<strong>Standard</strong> & Poor’s Ratings Services CreditWeek | May 23, 2012 37
FEATURES<br />
In 2001, U.S. and EU wind capacity<br />
totaled about 22,000 megawatts<br />
(MW)—by 2010, it had reached more<br />
than 124,000 MW, and it continues to<br />
escalate. Throughout this period of<br />
tremendous growth, <strong>Standard</strong> & Poor’s<br />
Ratings Services rated and maintained<br />
surveillance on several portfolio and<br />
single-asset wind projects’ debt issues.<br />
Initially, we rated the senior debt from<br />
all of these portfolios—three in the<br />
U.S. and four in Europe—investmentgrade<br />
(‘BBB-’ or higher), albeit on the<br />
lower end of the scale. All but one of<br />
these ratings have since fallen to speculative-grade<br />
(‘BB+’ or lower), and<br />
some ratings have dropped much farther<br />
than others.<br />
Comparing 10 years of these projects’<br />
actual performance to original expectations<br />
has helped us to better understand<br />
why their cash flow is so volatile. The<br />
main reasons are wind resource deficiencies<br />
(which arise when the wind isn’t<br />
blowing hard or often enough), higherthan-expected<br />
operating and maintenance<br />
costs, and features in the projects’<br />
cash flow structures that prevent the use<br />
of excess cash to meet debt service.<br />
Portfolio Projects Came First<br />
All of the wind projects we initially rated<br />
between 2003 and 2007 in the U.S. and<br />
Europe were portfolios of a number of<br />
smaller projects, structured to benefit<br />
38 www.creditweek.com<br />
SPECIAL REPORT<br />
<strong>Wind</strong> Power Projects’ Rating History<br />
from diverse wind resources in different<br />
regions. These portfolio projects, all of<br />
which had investment-grade ratings at<br />
issuance, have since fallen to speculative-grade<br />
for various reasons.<br />
The main stresses leading to the downgrades<br />
in Europe were electricity production<br />
that significantly lagged our base case<br />
forecasts due to a poorer-than-expected<br />
wind resource and prolonged periods<br />
when turbines were unavailable. In contrast,<br />
our downgrades of U.S. projects primarily<br />
resulted from weak debt service<br />
coverage ratios (DSCR) due to operational<br />
and maintenance expenses that far<br />
exceeded the projects’ expectations.<br />
In 2010, we rated our first single-asset<br />
wind project, Alta <strong>Wind</strong> Holdings LLC.<br />
We assigned investment-grade ratings to<br />
all of its senior debt because initial pro<br />
forma financial forecasts under our base<br />
case demonstrated decent stability<br />
under a conservative evaluation of the<br />
project’s wind resources. Alta <strong>Wind</strong> is<br />
the only wind project that still maintains<br />
an investment-grade rating (see table).<br />
To illustrate the primary components<br />
of the initial analysis of an investmentgrade<br />
wind project, we look to our first<br />
rated portfolio. In June 2003, we<br />
assigned a ‘BBB-’ rating to FPL Energy<br />
American <strong>Wind</strong> LLC’s $380 million<br />
senior secured debt due 2023. Later, FPL<br />
Energy (now NextEra Energy Inc.)<br />
issued additional debt at holding com-<br />
Alta <strong>Wind</strong> Holdings LLC BBB-/Stable BBB-/Stable<br />
pany FPL Energy <strong>Wind</strong> Funding LLC<br />
that it repays with distributions from<br />
American <strong>Wind</strong>, a portfolio of seven<br />
wind projects located in various regions<br />
throughout the U.S.<br />
Our initial investment-grade rating on<br />
the American <strong>Wind</strong> projects reflected<br />
several factors, including:<br />
● Geographic diversity;<br />
● A reserve to mitigate performance risk<br />
at its then-new Vestas V-80 turbine,<br />
which would derive about one-third of<br />
cash flow from a single wind farm,<br />
High <strong>Wind</strong>s;<br />
● The strong operational and maintenance<br />
performance of FPL Energy, a<br />
major developer of wind projects in<br />
the U.S.; and,<br />
● A strong DSCR of about 1.4x under a<br />
“P90” one-year confidence level for<br />
electricity production (which indicates<br />
that every year, there is a 90% probability<br />
that the portfolio will produce at<br />
least the projected amount of electricity,<br />
based on the wind resource).<br />
The cash flow from this portfolio of<br />
projects was fully cross-collateralized,<br />
which means that favorable performance<br />
at one project could offset a shortfall in<br />
cash flow at another. This turned out to<br />
be a good thing, as High <strong>Wind</strong>s, the portfolio’s<br />
expected major breadwinner, had<br />
various availability issues and a low wind<br />
resource. Other wind farms in the portfolio,<br />
however, performed above expec-<br />
2011 2010 2009 2008 2007<br />
Alte Liebe 1 Ltd. NR BB-/CW-Neg BBB-/Neg A/Neg AAA/Neg<br />
(BB- SPUR) (BBB- SPUR) (BBB- SPUR) (BBB- SPUR)<br />
Breeze Finance S.A. B+/Neg BB+/Neg BB+/Neg AA/CW-Neg AAA (prelim.)/<br />
(B+ SPUR) (BB- SPUR) (BB SPUR) (BBB SPUR) CW-Neg (BBB SPUR)<br />
Breeze Finance S.A.—Sub C/Neg C/Neg CC/Neg BB-/CW-Neg BB- (prelim.)/CW-Neg<br />
CRC Breeze Finance S.A. B-/Neg B-/Neg B+/Neg BBB/Neg BBB/Stable<br />
CRC Breeze Finance S.A.—Sub C/Neg C/Stable C/Stable BB+/Neg BB+/Stable<br />
FPL Energy American <strong>Wind</strong> LLC BB/Neg BBB-/Neg BBB-/Stable BBB-/Stable BBB/Stable<br />
FPL Energy National <strong>Wind</strong> LLC BB/Neg BBB-/Neg BBB-/Stable BBB-/Stable BBB-/Stable<br />
FPL Energy National <strong>Wind</strong> Portfolio LLC B/Neg B+/Neg BB-/Neg BB-/Stable BB-/Stable<br />
FPL Energy <strong>Wind</strong> Funding LLC B/Neg B+/Neg BB-/Neg BB-/Stable BB/Stable<br />
Max Two Ltd. NR NR BB-/Neg BB+/Stable BB+/Neg<br />
SPUR—S&P underlying rating. NR—Not rated.
The European experience shows that accurately<br />
gauging long-term wind risk in some parts of<br />
the Continent remains challenging…<br />
tations, thus offsetting the underperformance<br />
at High <strong>Wind</strong>s.<br />
<strong>Wind</strong> Resources Are<br />
Tough To Predict<br />
The initial wind portfolios intended to<br />
use geographically diverse, independent<br />
wind sources to mitigate site-specific<br />
wind risks and achieve more stable cash<br />
flow. Our investment-grade rating on<br />
Alta <strong>Wind</strong> Holdings, the first single-asset<br />
project we rated, reflected a robust liquidity<br />
package and the strong history of<br />
wind production in the region.<br />
We assess wind resource risk by the<br />
strength of the wind resource analysis<br />
from independent experts. However, we<br />
take a conservative view given that solid<br />
long-term wind data at a particular site is<br />
rarely available, and Mother Nature is<br />
fickle. Moreover, wind patterns can change<br />
unpredictably while flowing through a<br />
wind turbine farm (the “array effect”).<br />
In 2007 and 2008, it became clear that<br />
the wind resources the European portfolios<br />
had predicted were not materializing.<br />
Before assigning our first rating on<br />
a wind power project in 2003, European<br />
countries had been establishing lots of<br />
wind capacity and so had significant<br />
data to gauge wind regimes. For<br />
example, Germany had established more<br />
than 14,000 MW of measurable power in<br />
wind farms by 2003. Most of the data,<br />
however, were not site-specific—rather,<br />
they were extrapolated from regional<br />
data that did not necessarily indicate onsite<br />
performance. Even so, the view of<br />
leading wind experts at the time was that<br />
wind resources were highly unlikely to<br />
fall below the average historical production<br />
levels in a region for more than two<br />
or three years. In actuality, meager winds<br />
persisted for some time, forcing some<br />
projects to use their full liquidity facilities<br />
to service debt. As the poor wind condi-<br />
tions continued, these projects couldn’t<br />
replenish their liquidity facilities, giving<br />
them little cash flow flexibility.<br />
The European experience shows that<br />
accurately gauging long-term wind risk<br />
in some parts of the Continent remains<br />
challenging, despite the wide array of<br />
data available and the large number of<br />
wind regime experts. <strong>Wind</strong> analysis continues<br />
to evolve, and it will always be a<br />
learning process. A proven methodology<br />
for evaluating a wind regime on one continent,<br />
or even in one wind region, may<br />
not work for another if the measured<br />
data is not comparable with specific conditions<br />
at the site.<br />
The two portfolio projects in the U.S.<br />
have also suffered from poor wind conditions,<br />
but not to the same extent as in<br />
Europe. U.S. wind resources hit an alltime<br />
low in the past two years, but still<br />
remained in line with our base case.<br />
Still, the lower wind performance has<br />
given us a better sense of the variability<br />
of the wind resource, and we<br />
now take that into greater consideration<br />
in our analysis.<br />
Operational, Design, And<br />
Construction Issues Also<br />
Come Into Play<br />
Operations and maintenance<br />
While the two rated portfolios in the U.S.<br />
have endured low wind resources at<br />
times, their cash flows have declined primarily<br />
because of operations and maintenance<br />
(O&M) costs that far exceeded<br />
initial estimates. O&M costs for wind are<br />
generally considered small in relation to<br />
revenues, which led many market participants<br />
to conclude that an increase of 5%<br />
or 10% in those costs would only modestly<br />
affect a project’s performance. The<br />
O&M costs for the U.S. wind deals, however,<br />
stabilized at rates that were 30% to<br />
40% higher than forecast by 2012. This<br />
<strong>Standard</strong> & Poor’s Ratings Services CreditWeek | May 23, 2012 39
FEATURES<br />
40 www.creditweek.com<br />
SPECIAL REPORT<br />
led to a significant decline in DSCRs and,<br />
subsequently, several downgrades.<br />
The reason for the unexpected rise in<br />
costs, was simply, that demand for labor<br />
and parts far exceeded what the immature<br />
U.S. supply chain could deliver. In contrast,<br />
European projects’ O&M costs have<br />
stayed in line with forecasts, partly<br />
because the supply industry there is<br />
mature, making long-term predictions<br />
more viable. In the U.S., labor and crane<br />
costs in particular have risen dramatically<br />
over the past three years, and are not<br />
likely to drop back to forecast levels. The<br />
staffing levels required to maintain the<br />
projects are much higher than the projects<br />
anticipated. On top of this, the significant<br />
growth in the U.S. wind industry over the<br />
past 10 years has led to an undersupply of<br />
skilled labor, which has pushed wages up.<br />
Moreover, the cranes needed to perform<br />
necessary maintenance are in high<br />
demand. Lease rates have skyrocketed,<br />
and long lead times (in some cases up to<br />
six months or more) to lease a crane can<br />
result in lost revenues while a turbine is<br />
down and awaiting maintenance.<br />
In our ongoing surveillance of the U.S.<br />
projects, we now assign greater importance<br />
to the risk of increasing O&M costs, especially<br />
in jurisdictions where wind development<br />
is growing rapidly and the supply<br />
chain is weak. It may take time for the<br />
supply of labor and cranes to catch up with<br />
demand in growing markets. We also take a<br />
harder look at the assumptions behind<br />
O&M costs: Is each wind farm sufficiently<br />
staffed? How experienced is the operator?<br />
Are cranes easily accessible to the project?<br />
The answers to these questions have<br />
become a crucial part of our analysis.<br />
Design and construction<br />
In both Europe and the U.S., cracked<br />
blades and foundations for many turbines,<br />
along with construction delays,<br />
contributed to availability issues at certain<br />
projects. Most projects can expect<br />
lower availability during the first years of<br />
operations as the wind farm settles and<br />
operators get more comfortable with<br />
maintaining the facility. But even so,<br />
given the large number of wind turbines<br />
in operation before we began rating these<br />
transactions, the big problems with foun-<br />
dation design—which we don’t consider<br />
to be a “complex” technology in our<br />
project finance analysis—came as a surprise.<br />
Fixing the foundations was expensive<br />
and even caused some portfolios to<br />
drop their insurance coverage, which significantly<br />
adds to a project’s risk.<br />
Cash flow structure features<br />
The structure of a portfolio’s cash flow<br />
has proven to be a critical determinant of<br />
wind projects’ overall risk. To benefit from<br />
the portfolio effect (geographical diversification,<br />
in particular), the cross-collateralization<br />
of the wind projects in the portfolio<br />
is crucial. The Max Two Ltd.<br />
transaction, a portfolio of wind farms in<br />
Europe, provides a good example. The different<br />
farms in this portfolio were not<br />
cross-collateralized, which meant that<br />
when the financial performance of one<br />
project declined, it could not get support<br />
from the stronger performance of another.<br />
Thus, the overall portfolio received no<br />
benefit from its geographic diversity.<br />
The Industry Is Still Evolving<br />
As the wind power industry has matured<br />
over the past 10 years, developers and<br />
lenders have gained a better understanding<br />
of the risks involved with these<br />
projects. The key credit considerations<br />
of wind projects, namely exposure to an<br />
unpredictable wind resource and<br />
increased operations and maintenance<br />
costs haven’t changed. However, these<br />
factors have turned out to be more<br />
volatile than we expected. Our original<br />
focus—on a relatively conservative base<br />
case for production, including a one-year<br />
P90 probability—has thus proven prudent,<br />
although in some cases, wind<br />
resources have underperformed even<br />
that cautious scenario. We will continue<br />
to monitor this evolving industry and to<br />
consider what we’ve learned in our<br />
rating analysis. CW<br />
For more articles on this topic search RatingsDirect with keyword:<br />
<strong>Wind</strong> Power<br />
Analytical Contacts:<br />
Grace D. Drinker<br />
San Francisco (1) 415-371-5045<br />
Jose R. Abos<br />
Madrid (34) 91-389-6951
<strong>Will</strong> Securitization Help Fuel<br />
The U.S. Solar Power Industry?<br />
Overview<br />
● Securitization may be a viable<br />
option for solar developers that<br />
wish to monetize cash flows from<br />
future lease or power purchase<br />
agreement payments.<br />
● The primary risks of these transactions<br />
include a lack of historical<br />
performance data, a limited<br />
number of potential servicers, and<br />
ongoing downward pressure on<br />
solar panel prices.<br />
As the U.S. solar power industry continues to expand, developers<br />
will need various financing outlets to fund their growth.<br />
<strong>Standard</strong> & Poor’s Ratings Services believes securitization—<br />
a financing technique that aggregates pools of assets, financial<br />
contracts, or loans, and through a structuring process transforms their<br />
future cash flows into a security—may be a viable option for<br />
developers that wish to monetize cash flows from future lease or power<br />
purchase agreement (PPA) payments. Such transactions could provide<br />
the issuers’ parents with a significant amount of upfront cash for capital<br />
spending or other business ventures.<br />
<strong>Standard</strong> & Poor’s Ratings Services CreditWeek | May 23, 2012 41
FEATURES<br />
While <strong>Standard</strong> & Poor’s hasn’t rated any<br />
solar securitizations to date, we have<br />
determined what, in our view, may be<br />
their key credit concerns. Generally<br />
these risks fall into three broad categories:<br />
limited performance data, a lack<br />
of large scale services, and declining<br />
panel prices. Throughout this article we<br />
will discuss these risks in great detail,<br />
while also identifying additional credit<br />
risks that are specific to securitizations.<br />
Solar Power Installations<br />
Continue To Grow<br />
Demand for renewable energy has<br />
grown considerably during the past three<br />
years as a greater proportion of the general<br />
population became concerned about<br />
reducing their carbon footprints.<br />
According to the Interstate Renewable<br />
Energy Council, annual installed gridconnected<br />
photovoltaic (PV) capacity<br />
grew by almost 300% from 2008 to 2010.<br />
About one-third of total installations in<br />
2010 came from utility-scale projects.<br />
The remaining capacity encompassed<br />
small installations at residential proper-<br />
(Megawatts)<br />
2,500<br />
2,000<br />
1,500<br />
1,000<br />
500<br />
0<br />
42 www.creditweek.com<br />
SPECIAL REPORT<br />
ties, government buildings, commercial<br />
entities, and military stations.<br />
Installations on residential and nonresidential<br />
properties also grew significantly<br />
during the past three years (see<br />
chart). Total installed capacity for residential<br />
and nonresidential buildings in<br />
2010 topped 600 MW, an increase of<br />
more than 200% when compared with<br />
2008. A drastic decline in panel prices,<br />
along with flexible financing options and<br />
tax incentives, contributed to the rapid<br />
growth in this sector.<br />
The installation of solar panels requires<br />
substantial capital investments by the<br />
developer—and with some of the<br />
financing options, such as solar lease<br />
agreements and PPAs, it may be several<br />
years before a developer recoups its initial<br />
investment. Solar leases and PPAs are<br />
financing transactions between an offtaker<br />
(i.e., a home owner, small business,<br />
etc.) and a solar developer. Under these<br />
agreements, the offtaker receives solar<br />
electricity for a certain number of years<br />
at a predetermined price. The developers<br />
retain most of the federal tax incentives<br />
The installation of solar panels requires substantial capital<br />
investments by the developer—and…it may be several<br />
years before a developer recoups its initial investment.<br />
Cumulative U.S. Grid-Tied Photovoltaic Installations (2001 To 2010)<br />
■<br />
■<br />
■ ■<br />
■ ■<br />
■<br />
2001 2002 2003 2004 2005 2006 2007 2008 2009 2010<br />
Source: Interstate Renewable Energy Council.<br />
© <strong>Standard</strong> & Poor’s 2012.<br />
■<br />
■<br />
■<br />
and renewable energy credits because the<br />
offtakers do not own the solar systems. In<br />
return for electricity at below-market<br />
rates, the developer will receive periodic<br />
payments from the offtakers. While PPAs<br />
and solar lease payments provide developers<br />
with steady revenue streams, they<br />
may also result in near-term funding<br />
issues that could hinder future growth.<br />
Due To Limited Data, Default Rates<br />
May Be Difficult To Determine<br />
The rooftop solar industry has only been<br />
operating on a significant scale for the<br />
past three or four years. The drastic<br />
increase in such installations can be seen<br />
in the chart. Because the solar industry<br />
is still in the nascent stages of development,<br />
there is limited data from which to<br />
draw conclusions regarding the likelihood<br />
of offtaker defaults under a lease<br />
or PPA agreement. Given that the length<br />
of these agreements may run up to 20<br />
years, we believe that reliance on shortterm<br />
data may not accurately reflect<br />
how an offtaker will behave over an<br />
extended period of time. In addition, we<br />
believe early adopters of this technology<br />
will be less likely to default because their<br />
reasons for entering into a lease or PPA<br />
may go beyond the more straightforward<br />
economic motivations. As such, we<br />
expect that defaults would be relatively<br />
low among the first generation of<br />
adopters and increase as the second and<br />
third generations move into the industry.<br />
At first glance, utility default rates<br />
might seem to be a useful proxy for evaluating<br />
PPA or lease default rates, but there<br />
are several issues with using this data set.<br />
First, utility default rates are typically presented<br />
on a nationwide basis and do not<br />
break down the results according to classifications<br />
of customer credit quality (i.e.,<br />
FICO scores). Second, virtually all customers<br />
participating in the small-scale<br />
solar programs that would be securitized<br />
remain connected to the grid and draw<br />
some of their power from a utility. It is<br />
possible, therefore, that those customers<br />
would be more likely to default on their<br />
solar bills than their utility bills.<br />
Given the nature of the offtakers and<br />
their obligations, it seems that existing<br />
methodologies could be used as a proxy
to evaluate the default risk in a solar portfolio.<br />
Existing models and approaches for<br />
analyzing residential or corporate credit,<br />
such as those used to analyze residential<br />
mortgage-backed securities or collateralized<br />
loan obligations, could be leveraged<br />
for this analysis.<br />
Lack Of Large Operation And<br />
Maintenance (O&M) Providers<br />
Can Create Additional Risks<br />
We believe there are currently few O&M<br />
providers that have the geographic reach<br />
necessary to service a diverse securitized<br />
pool. Due to the limited number of<br />
national O&M providers, we believe it<br />
may be difficult for a transaction to<br />
quickly find a replacement if the original<br />
servicer were to default on its obligations.<br />
This risk could pose a challenge to<br />
securitizations seeking ratings higher<br />
than the rating of the O&M provider.<br />
The limited number of O&M providers<br />
can affect the transactions in a number of<br />
ways. For example, if an extended period<br />
of time is required to replace the<br />
provider, the transaction’s cash flows<br />
could decline as systems are not maintained<br />
during this period of time and the<br />
forecast amount of energy is not produced.<br />
While solar systems do not<br />
require extensive maintenance, they do<br />
need to be continuously monitored to<br />
address issues as they arise. The performance<br />
of a securitization may also be<br />
hurt if the O&M rate required by a new<br />
provider is higher than the previous rate.<br />
Rising expenses would most likely reduce<br />
future cash flows, which in turn, increase<br />
the transaction’s credit risk profile.<br />
Declining Panel Prices May<br />
Result In Additional Credit Risks<br />
Over the past several years, prices of PV<br />
solar panels have drastically declined, and<br />
in some markets, installed costs are<br />
approaching grid parity. We believe the<br />
price of solar electricity is strongly correlated<br />
with panel prices and tax incentives.<br />
As the price of solar systems decline, it’s<br />
likely that solar lease and PPA rates will<br />
fall as well. However, the elimination of<br />
certain tax incentives may offset the<br />
decrease in panel prices. Many market<br />
participants are now expecting panel<br />
prices to reach $1/watt in the immediate<br />
future. To put this reduction in perspective,<br />
in 2009, many industry participants<br />
believed panel prices would fall to $1 per<br />
watt in 2014 or 2015 (see “Regulatory And<br />
Political Headwinds May Slow Renewable<br />
Energy Growth,” published Sept. 8, 2011, on<br />
RatingsDirect, on the Global Credit Portal).<br />
While there are signs that the sharp<br />
reduction in panel prices may not continue,<br />
further declines could leave many<br />
PPAs being underwritten today to be<br />
above market contracts.<br />
In addition to falling PPA and panel<br />
prices, offtakers are also benefiting from<br />
technological changes in the solar sector.<br />
As solar technology continues to<br />
improve and panels become more efficient,<br />
it’s likely that panels being used<br />
today may become outdated. While technological<br />
advances and falling prices may<br />
benefit the solar industry, significant<br />
improvements in panel prices and efficiencies<br />
may result in a number of original<br />
offtakers feeling buyer’s remorse as<br />
they may have entered into abovemarket<br />
contracts and leased obsolete<br />
solar systems. We believe declining<br />
prices and technological advancements<br />
may increase the risk that offtakers will<br />
try to renegotiate their rates after signing<br />
their initial agreement in an effort to<br />
reduce their PPA or lease payments. It’s<br />
also possible that offtakers who can’t<br />
renegotiate may selectively default on<br />
their PPA or lease obligations. We believe<br />
this risk is particularly high in situations<br />
where panels change hands, either in the<br />
event of a property sale or an insolvency<br />
of the owner (i.e., foreclosure).<br />
Depending on the agreement, the outgoing<br />
offtaker may be required to find a<br />
replacement who will assume the<br />
existing agreement or otherwise purchase<br />
the system at a fixed price. While<br />
we recognize that this contractual obligation<br />
exists, we think that offtakers that<br />
have recently defaulted on their mortgage<br />
or other financial obligations may<br />
have little incentive to fulfill the terms<br />
and conditions of their PPAs or lease<br />
agreements. We believe that to attract a<br />
new offtaker, the lease rate may have to<br />
go down or rate escalators be lowered or<br />
suspended for a period of time, which<br />
could materially affect the securitization’s<br />
future cash flows.<br />
Recovery Rates Vary<br />
The recovery amount following an event<br />
of default may vary depending on the<br />
recourse available to the transaction.<br />
The securitization’s recourse may not,<br />
for instance, extend beyond the right to<br />
remove the panels or take legal action<br />
against the offtaker for missed payments.<br />
We believe such limited recourse<br />
increases the offtaker’s risk profile, as it<br />
would have little incentive to avoid a<br />
default. Furthermore, limited recourse in<br />
conjunction with a depreciating asset<br />
may result in extremely low recovery<br />
rates. We believe that under a default<br />
scenario, there will likely be a periodic<br />
reduction in cash flows to account for<br />
the time needed to attract a new offtaker.<br />
We also believe that a reduction in rates<br />
will be necessary to attract a new offtaker<br />
due to technological changes and<br />
falling PPA prices as discussed earlier.<br />
Utility Rate Projections Have<br />
A High Margin For Error<br />
For the most part, offtakers in a solar<br />
securitization will be responsible for purchasing<br />
all power that a specific solar<br />
system produces. Typically, the securitization<br />
bills the offtaker a lower percentage<br />
of the applicable utility rate for<br />
the solar power generated, creating an<br />
economic incentive for the offtaker to<br />
maintain the contract. Most agreements<br />
include an annual billing rate escalator<br />
on the generated solar power for the<br />
remaining term of the lease or PPA.<br />
Depending on how the parties establish<br />
the differential between standard utility<br />
rates and the solar rates, the economic<br />
incentive may erode over time.<br />
We believe that, trend analysis aside,<br />
projecting a utility’s billing rates is a difficult<br />
exercise and that the longer the projection<br />
period, the higher the margin for<br />
error. Aggregated forecasts across different<br />
regions and utilities may underestimate<br />
or overestimate, depending on<br />
many variables.<br />
Any forecast of utility rates requires an<br />
in-depth understanding of the relevant<br />
utility’s operational strategy to establish<br />
<strong>Standard</strong> & Poor’s Ratings Services CreditWeek | May 23, 2012 43
FEATURES<br />
acceptable base case and stress case scenarios<br />
for that particular region. The<br />
region’s regulatory environment is also a<br />
critical factor to consider. Other factors<br />
to consider are the source and reliability<br />
of the data, the type of data (residential<br />
retail rate, usage assumptions, etc.), and<br />
assumptions for competitive versus regulated<br />
markets and municipal versus<br />
investor-owned and retail marketers.<br />
Energy Sales To The Grid<br />
In a situation where the offtaker is<br />
defaulting on its contractual arrangements,<br />
the securitization may rely on<br />
recovery from the utility by way of a sale<br />
back to the grid. Typically, such sales rely<br />
on the provisions under the Public Utilities<br />
Regulatory Policy Act of 1978, as<br />
amended (PURPA), whereby the solar<br />
project, as a qualifying facility (QF), sells<br />
the power to the utility. Under PURPA, the<br />
utility may be required to purchase the<br />
power at its avoided cost, which is the<br />
cost the utility would have incurred to<br />
produce the same quantity of power (the<br />
so-called ”must-take” provisions).<br />
Some of the questions that arise in<br />
connection with the assumption that the<br />
securitization can sell back to the grid are:<br />
● Is the utility subject to PURPA’s musttake<br />
provisions? Is the project an eligible<br />
QF? There may be applicable<br />
exemptions for the utility, as well as<br />
eligibility assumptions for the project’s<br />
“qualifying” status.<br />
● Is there, in fact, a market for the sale?<br />
A visible, active local transmissions<br />
market would give credibility to the<br />
recovery analysis.<br />
● Does the solar project have the<br />
mechanical capability to deliver the<br />
power to the grid? Where applicable,<br />
clearly delineated servicing procedures,<br />
in the securitization documents<br />
together with any necessary mechanical<br />
adjustments, would facilitate execution<br />
of the delivery.<br />
● What are the assumptions made for projecting<br />
the utility’s avoided costs? We<br />
may evaluate the utility’s procurement<br />
strategy and power mix, for example, in<br />
states that do not have Federal Energy<br />
Regulatory Commission guidance on<br />
establishing the calculations.<br />
44 www.creditweek.com<br />
SPECIAL REPORT<br />
Diversification Informs Our<br />
Solar Resource Analysis<br />
The solar resource—which refers to the<br />
amount of sunlight a given geographic<br />
area receives—is generally quite stable<br />
for PV panels, but there is some risk,<br />
due to measurement errors and a small<br />
inherent variability, that actual sunlight<br />
will be less than the forecast amount.<br />
The amount of sunlight also varies by<br />
location and time of year, which may<br />
result in the securitization having a<br />
volatile cash flow profile. For this<br />
reason we believe it’s imperative to<br />
base the solar resource forecast on<br />
monthly data so that it incorporates<br />
such seasonal variations.<br />
Solar securitizations will mostly likely<br />
benefit from a geographically diverse<br />
collateral pool across the U.S. This<br />
reduces the transaction’s operating risk<br />
profile because the securitization doesn’t<br />
depend on one area for most of its future<br />
cash flows. For example, the transaction’s<br />
performance is less likely to suffer<br />
if one region has, say, a long string of<br />
cloudy days. As such, most independent<br />
solar resource consultants account for<br />
diversification by reducing the collateral<br />
pool’s interannual variability, which<br />
measures the change in the solar<br />
resource from year to year.<br />
However, some securitizations may<br />
have a ramp-up phase where the collateral<br />
pool may not be complete at<br />
issuance. This could occur because the<br />
sponsor has not installed or acquired all<br />
of the solar systems and executed corresponding<br />
PPAs or lease agreements.<br />
Therefore, in such an instance we<br />
believe the full benefit of the reduction<br />
in interannual variability due to geographic<br />
diversification may not be<br />
appropriate during the ramp-up phase.<br />
Liquidity Can Pose<br />
Some Challenges<br />
Maintaining adequate liquidity in a solar<br />
securitization can be difficult due to several<br />
factors.<br />
Ramp-up risk<br />
Depending on the ramp-up strategy, the<br />
securitization’s credit risk profile may<br />
become more volatile if the sponsor has<br />
difficulty managing a large number of<br />
simultaneous installations across multiple<br />
geographic locations.<br />
The ramp-up needs to be fast enough<br />
and diverse enough to ensure that there<br />
is sufficient liquidity and that the portfolio<br />
does not become overly concentrated.<br />
We would expect the securitization<br />
to have mechanisms in place to<br />
address the potential for increased concentrations<br />
if the installations occur at<br />
an uneven pace among various locations,<br />
along with other measures of<br />
diversification.<br />
Dividends or other equity payments<br />
Dividends or other forms of cash payments<br />
to equity holders usually raise a<br />
transaction’s credit risk. Cash leakage, in<br />
conjunction with the seasonality of solar<br />
production, could hurt a transaction’s<br />
creditworthiness. If cash flow from the<br />
high-production summertime months<br />
leaks out of the deal, the amount available<br />
for debt service in the winter might<br />
prove insufficient.<br />
Regular maintenance expenses<br />
Inverters and other equipment require<br />
periodic replacement. Usually, reserve<br />
funds or dedicated cash flow are needed<br />
to account for these expenses.<br />
Securitization Is A Viable<br />
Funding Strategy<br />
We believe securitization of solar systems<br />
could be a feasible financing tool<br />
for developers who wish to monetize<br />
future cash flows. Securitization may<br />
reduce a developer’s financing cost as<br />
the creditworthiness of the transaction<br />
is dependent upon the collateral pool<br />
and not the credit quality of the issuer,<br />
which in most cases is in the speculative-grade<br />
category. CW<br />
For more articles on this topic search RatingsDirect with keyword:<br />
Solar Power<br />
Analytical Contacts:<br />
Andrew J. Giudici<br />
New York (1) 212-438-1659<br />
Jeong-A Kim<br />
New York (1) 212-438-1211<br />
Brian Yagoda<br />
New York (1) 212-438-2558
Credit FAQ<br />
Could Spain’s Halt On Renewable<br />
Energy Incentives Take The <strong>Wind</strong> Out<br />
Of Projects, Developers, And Utilities?<br />
Spain’s newly elected government<br />
recently announced the temporary<br />
suspension of economic incentives<br />
for electricity production from new clean<br />
energy installations included in the socalled<br />
special regime. Under this<br />
scheme, renewable energy facilities<br />
(renewables) have benefited from regulated<br />
rates above market prices for their<br />
electricity production, with solar and<br />
wind technologies absorbing the largest<br />
share of premiums.<br />
Electricity tariffs in Spain have not fully<br />
covered costs since 2000. As a result, utilities<br />
have financed a significant share of<br />
these costs—which include special regime<br />
premiums—although, in principle, these<br />
costs should be passed on to end-consumers<br />
through the electricity tariffs. The<br />
Spanish government has indicated that its<br />
moratorium on special regime premiums<br />
will help it control this electricity tariff<br />
deficit, which generated about €22 billion<br />
in cumulative debt by year-end 2011.<br />
<strong>Standard</strong> & Poor’s Ratings Services CreditWeek | May 23, 2012 45
FEATURES<br />
46 www.creditweek.com<br />
SPECIAL REPORT | Q&A<br />
(For further information, see “Credit FAQ:<br />
How The Spanish Electricity Tariff Deficit And<br />
Political Uncertainties May Affect The Ratings<br />
On Spanish Utilities,” published Jan. 12, 2012,<br />
on RatingsDirect, on the Global Credit Portal.)<br />
<strong>Standard</strong> & Poor’s Rating Services recognizes<br />
that market participants may be<br />
wary of the potential effect the legislation<br />
passed by the Spanish government<br />
(Royal Decree 01/2012) could have on a<br />
number of players in the Spanish energy<br />
market. Here, we address these concerns<br />
and answer investors’ frequently asked<br />
questions about how the new measure<br />
may affect Spanish renewable energy<br />
projects, project developers, and utilities.<br />
Q. What effects could the moratorium<br />
have on the creditworthiness of renewable<br />
energy projects in Spain?<br />
A. We don’t believe it will have any credit<br />
effect on projects already in operation and<br />
projects that, although not in operation,<br />
have already been granted the right to<br />
receive special remuneration (registered<br />
projects). This is because we understand<br />
that the measure will not alter the special<br />
remuneration framework for these projects.<br />
Although we do not have any public ratings<br />
on renewable energy projects in Spain,<br />
we continue to review their credit quality<br />
as part of our evaluation of the underlying<br />
collateral provided for various other transactions.<br />
These various renewables projects<br />
include wind, solar photovoltaic (PV), and<br />
concentrated solar power (CSP) projects.<br />
Breakdown Of Electricity Production From <strong>Renewables</strong> In Spain<br />
Hydropower <strong>Wind</strong> Solar photovoltaic Solar thermal Others<br />
Share of total electricity production from renewables (right scale)<br />
(GWh)<br />
50,000<br />
45,000<br />
40,000<br />
35,000<br />
30,000<br />
25,000<br />
20,000<br />
15,000<br />
10,000<br />
5,000<br />
0<br />
2006 2007 2008 2009 2010 2011<br />
GWh—Gigawatt hour.<br />
Sources: Ministerio de Industria, Turismo y Comercio (2006 to 2010); Red Electrica de España (2011).<br />
© <strong>Standard</strong> & Poor’s 2012.<br />
(%)<br />
35<br />
30<br />
25<br />
20<br />
15<br />
10<br />
5<br />
0<br />
Q. How could the halt on premiums<br />
affect the development of new renewables<br />
projects in Spain?<br />
A. We expect the moratorium will likely<br />
freeze the development of unregistered<br />
wind and solar projects in Spain. The<br />
measure will, for example, prevent 550<br />
megawatts (MW) of PV installations from<br />
obtaining special remuneration rights in<br />
2012, and will bar already authorized wind<br />
projects in excess of 9,000 MW from<br />
obtaining registration. We believe that,<br />
without special financial incentives, solarbased<br />
energy projects will remain uncompetitive<br />
in the liberalized Spanish electricity<br />
market. We also think that onshore<br />
wind farms in Spain that no longer benefit<br />
from the incentive scheme will not provide<br />
returns consistent with sponsors’ expectations<br />
for the time being. This is because, in<br />
the absence of economic incentives, only<br />
those wind projects with load factors well<br />
above the segment average—meaning<br />
those placed in the highest-wind sites in<br />
Spain—will be economically viable. Such<br />
high-load locations are very limited<br />
because most of them already host operational<br />
projects. That said, we believe that<br />
onshore wind projects could become economically<br />
viable in the future, depending<br />
on the evolution of electricity pool prices<br />
in Spain, as well as fast-evolving cost factors<br />
such as wind turbine prices.<br />
In light of the Spanish government’s<br />
commitment to eliminate the electricity<br />
tariff deficit by 2013, together with the<br />
declining cost of inputs for renewable<br />
energy installations, we consider it unlikely<br />
that any future special remuneration<br />
scheme would be more advantageous than<br />
the present one. We therefore see little<br />
practical incentive for sponsors of registered<br />
projects to hold back on their development<br />
in the hope of benefiting from a<br />
more favorable remuneration regime.<br />
Q. Does <strong>Standard</strong> & Poor’s consider that<br />
the decree signals the end of the “renewable-friendly”<br />
energy regime in Spain?<br />
A. No. In the long term, we think the<br />
Spanish government will eventually have<br />
to restore an incentive scheme if it is to<br />
meet the ambitious targets to increase
enewable energy consumption, as laid<br />
out in the 2009 European directive on<br />
the promotion of clean energy (Directive<br />
2009/28/EC).<br />
In 2010, Spain derived 11.3% of total<br />
energy consumption from renewable<br />
energy sources. This was twice as much<br />
as in 2005 but still some way off the<br />
EU’s target of 20% by 2020. In our view,<br />
some market participants understand<br />
that disincentivizing the development of<br />
renewables projects is incompatible with<br />
Spain’s stated target, and could consequently<br />
hold back from developing new<br />
projects until a more favorable regime is<br />
put in place.<br />
Q. How will the government’s latest<br />
action affect <strong>Standard</strong> & Poor’s view of<br />
regulatory risk for renewable energy<br />
projects in Spain?<br />
A. We think it could help dispel existing<br />
concerns regarding other immediate and<br />
retroactive detrimental regulatory<br />
changes that market participants had<br />
feared since the Spanish parliament<br />
passed legislation in 2010 effectively<br />
capping the revenues that operational<br />
PV plants were receiving.<br />
However, we don’t completely rule<br />
out the possibility that the government<br />
could take adverse regulatory actions in<br />
the future. We acknowledge that, if the<br />
economic environment further deteriorated,<br />
the government could once again<br />
seek financial relief from the renewable<br />
energy sector. Under such a scenario, we<br />
believe renewable energy projects would<br />
be particularly exposed to regulatory<br />
risk or, perhaps, financial penalties such<br />
as a tax levy as was the case in the<br />
Czech Republic (AA-/Stable/A-1+).<br />
On the other hand, we also think that the<br />
Ministry’s announcement should be viewed<br />
in the context of a wider reform of the<br />
Spanish electricity market heralded by the<br />
new government. Although announced as a<br />
“temporary suspension,” we believe that<br />
this interruption in economic incentives<br />
may be the prelude to an overhaul of the<br />
Spanish special remuneration system for<br />
energy producers. We believe this, in turn,<br />
could reduce future regulatory risk for<br />
Spanish renewable projects in the long<br />
term. A redefined remuneration regime<br />
designed under economic sustainability<br />
Table 1 | Spain’s Special Regime Premiums And Electricity Tariff Deficit<br />
2007 2008 2009 2010 2011* 2012§<br />
Total special regime premiums (bil. €) 2.8 4.1 6.5 7.1 6.1 7.2<br />
Special regime premiums (% of total regulated costs) 14.0 16.7 33.9 38.8 39.5 39.3<br />
Regulated costs liquidation deficit (bil. €) 1.4 5.8 4.6 5.6 3.3 3.0<br />
Special regime electricity production<br />
(% of total electricity production) 20.6 24.0 30.5 33.3 34.6 35.6<br />
*Provisional liquidation as of October 2011. §Comisión Nacional de Energía (CNE) forecast, Report 39/2011,<br />
published Dec. 28, 2011.<br />
Sources: CNE, Regulated Costs Liquidation Report.<br />
Table 2 | Expected 2011 Statistics For Spain’s Special Regime Energy Sources<br />
principles—as expressed by the government—could<br />
offer a more stable regulatory<br />
framework under which the renewable<br />
energy sector could expand. In our view,<br />
this would help attenuate investors’ wariness<br />
against supporting the development of<br />
new projects. In any event, we will assess<br />
the sustainability of any new framework for<br />
renewable energy once it is presented.<br />
Q. How could the initiative affect<br />
Spanish project developers’ creditworthiness?<br />
A. We think larger Spanish project<br />
developers should successfully weather<br />
any negative effect resulting from having<br />
to suspend or postpone a number of<br />
their planned operations. On the other<br />
hand, smaller developers may not have<br />
the means to withstand such a setback.<br />
In general terms, we consider that the<br />
most significant Spanish developers can be<br />
classified into two main groups. On the one<br />
hand, diversified industrial conglomerates<br />
such as Abengoa S.A. (B+/Stable/—),<br />
Acciona S.A. (not rated), or ACS Group (not<br />
rated) act as sponsors and engineering and<br />
construction (E&C) providers for incentivized<br />
energy projects. On the other, vertically<br />
integrated utilities such as Iberdrola<br />
S.A. (A-/Stable/A-2), Gas Natural SDG S.A.<br />
(BBB/Stable/A-2), or Endesa S.A.<br />
(A-/Watch Neg/A-2) cover a share of their<br />
generation capacity through the development<br />
of renewables projects, particularly<br />
those based on wind technologies.<br />
For developers in both categories, we<br />
believe that postponing or abandoning<br />
their planned projects should not have<br />
material credit rating implications.<br />
Solar photovoltaic Solar thermal <strong>Wind</strong> Hydropower* Cogeneration Biomass Other Total<br />
Installed capacity (MW) 4,188 856 20,658 2,045 6,182 752 1,230 35,911<br />
Annual production (GWh) 6,180 1,640 43,541 5,980 24,907 3,681 7,470 93,399<br />
Total premiums (mil. €) 2,405 394 1,800 234 1,352 271 421 6,877<br />
Unitary equivalent premium (€/MWh) 389.1 240.0 41.3 39.2 54.3 73.5 56.4 —<br />
Special regime production share (%) 6.6 1.8 46.6 6.4 26.7 3.9 8.0 100.0<br />
Special regime premiums share (%) 35.0 5.7 26.2 3.4 19.7 3.9 6.1 100.0<br />
*The special regime only comprises 10.4% of total national hydropower capacity as of year-end 2011 (source: Red Electrica de España). Note: The average final market price of electricity<br />
in 2011 was 60.09 €/MWh (source: Red Electrica de España).<br />
Sources: Comisión Nacional de la Energía, Report 39/2011, published Dec. 28, 2011. MW—Megawatt. GWh—Gigawatt hour.<br />
<strong>Standard</strong> & Poor’s Ratings Services CreditWeek | May 23, 2012 47
FEATURES<br />
48 www.creditweek.com<br />
SPECIAL REPORT | Q&A<br />
Companies in the first group generally<br />
have widely diversified revenue sources,<br />
whereas companies in the second group<br />
have particularly solid revenues streams<br />
and significant financial flexibility. Many<br />
developers, especially those in the first<br />
group, have already entered into other<br />
less-saturated international markets like<br />
the U.S. and Latin America that could<br />
absorb a share of their future untied operating<br />
capacity. In addition, companies in<br />
both groups have large balance sheets<br />
that should allow them to dilute any<br />
adverse effect following the moratorium.<br />
Conversely, we believe that smaller<br />
developers might not have the operational<br />
and financial strengths needed to<br />
cope with the moratorium. As a result,<br />
they will likely be hit harder than their<br />
larger counterparts.<br />
Q. How could the initiative affect<br />
<strong>Standard</strong> & Poor’s assessment of<br />
Spanish utilities’ creditworthiness?<br />
A. We believe that material efforts to<br />
control and reduce the existing tariff<br />
deficit, such as the moratorium, could<br />
provide Spanish utilities with greater<br />
operational and financial flexibility (see<br />
“Credit FAQ: How The Spanish Electricity<br />
Tariff Deficit And Political Uncertainties<br />
May Affect The Ratings On Spanish<br />
Utilities,” published Jan. 12, 2012). That<br />
said, we also recognize that the measure<br />
could be the prelude to other regulatory<br />
changes that could further alter utilities’<br />
credit profiles.<br />
We view the deteriorating tariff deficit as<br />
one of the key financial and business risks<br />
that Spanish utilities confront. Given that<br />
the moratorium only suspends the allocation<br />
of new remuneration rights to projects<br />
still pending official registration—and<br />
therefore relatively far from being operational—we<br />
believe that the announced<br />
moratorium will only marginally help alleviate<br />
the pressure over the tariff deficit in<br />
2012. In 2012 and 2013, our base-case scenario<br />
factors in a continued accumulation<br />
of tariff deficit receivables on the affected<br />
utilities’ balance sheets, but at a slower<br />
pace compared with 2010 and 2011, as the<br />
government gradually implements further<br />
structural measures to address the imbal-<br />
ance between electricity tariffs and costs.<br />
However, we still believe it will be politically<br />
difficult to reach the stated target to<br />
eliminate the tariff deficit by 2013.<br />
We also believe that measures directed<br />
toward sustainable cost-reflective tariff<br />
schemes could facilitate the securitization of<br />
accumulated and future tariff deficits. If the<br />
government takes steps in that direction, we<br />
think it could help limit potential investors’<br />
wariness against securities issued by the<br />
Fondo de Amortización del Déficit Eléctrico<br />
(FADE), the national securitization vehicle<br />
that ultimately transfers tariff deficit receivables<br />
off utilities’ balance sheets to the capital<br />
markets. Nevertheless, we will continue<br />
to be cautious about including proceeds<br />
from such a financing source in our forecasts<br />
for Spanish utilities given their high dependence<br />
on capital market conditions.<br />
We will monitor potential further regulatory<br />
changes that could alter utilities’<br />
operating framework, particularly in the<br />
context of intense sovereign stresses<br />
and a deteriorating economic environment.<br />
For example, we think it is possible<br />
that the announced wide-ranging<br />
revision of the electricity market might<br />
expose regulated transmission grid and<br />
distribution network operators to<br />
adverse changes in their supportive<br />
remuneration regimes. Similarly, we also<br />
think there is a risk that the Spanish government<br />
could resort to ad hoc taxation<br />
of utilities’ “windfall” profits, obtained<br />
from operational hydropower and<br />
nuclear installations that were already<br />
amortized under the pre-liberalization<br />
regime. In any case, we will assess the<br />
specific effects of any future structural<br />
measures on the utilities’ business risk<br />
and financial risk profiles if and when<br />
they materialize. CW<br />
For more articles on this topic search RatingsDirect with keyword:<br />
Renewable Energy<br />
Analytical Contacts:<br />
Michela Bariletti<br />
London (44) 20-7176-3804<br />
Michael Wilkins<br />
London (44) 20-7176-3528<br />
Daniel Climent-Soler<br />
Madrid (34) 91-389-6940<br />
Jose R. Abos<br />
Madrid (34) 91-389-6951
Overview<br />
● Australia’s carbon tax is to be<br />
implemented on July 1, 2012. It<br />
will include a fixed carbon price<br />
for three years, before permits can<br />
be traded in international markets.<br />
● Gas appears to be the likely<br />
transition fuel in the move away<br />
from coal-fired generation.<br />
● However, several key factors<br />
remain uncertain and could<br />
influence the economics of gas as<br />
replacement fuel: gas prices,<br />
carbon price volatility, plant<br />
capital costs, and the expected<br />
useful lives of new plants.<br />
● Moreover, investment prospects for<br />
new gas base-load stations seem<br />
limited because of a lack of potential<br />
investors and possibly shortened<br />
economic lives of new plants.<br />
Can Gas Smooth Australia’s<br />
Transition From Coal Or <strong>Will</strong><br />
<strong>Renewables</strong> Leap Ahead?<br />
Australia’s looming carbon tax could provoke a<br />
dramatic change to the power sector. As the country<br />
weans itself from reliance on coal to generate its<br />
power, gas production is set to boom with several planned<br />
projects in the coal-seam-gas to liquefied natural gas (LNG)<br />
industry. The expected surge suggests that gas is the most<br />
logical choice to smooth the long-term transition in Australia<br />
to clean energy because of its lower carbon intensity. But the<br />
winner of this carbon race is not so clear-cut.<br />
<strong>Standard</strong> & Poor’s Ratings Services CreditWeek | May 23, 2012 49
FEATURES<br />
Executive Summary:<br />
Limited Prospects For<br />
New Base-Load Power<br />
Potentially higher gas prices and carbon<br />
price volatility throw some doubt on the<br />
competitiveness of gas to challenge the<br />
dominance of coal-fired generation. The<br />
forecast boom in gas production would<br />
link prices to international benchmarks,<br />
potentially spurring steep rises. And the<br />
recent volatility in carbon prices in the<br />
European markets demonstrates that the<br />
jury is out as to whether the carbon tax<br />
is enough to offset coal’s cost advantage.<br />
(Million tons per annum)<br />
900<br />
800<br />
700<br />
600<br />
500<br />
400<br />
300<br />
200<br />
100<br />
50 www.creditweek.com<br />
SPECIAL REPORT<br />
Fueling the uncertainty is what we<br />
consider to be a short window for new<br />
gas base-load investments. Construction<br />
of new plants spans over extensive<br />
periods, while investors face long payback<br />
periods. Furthermore, the economic<br />
lives of new plants may be<br />
reduced. Beyond the initial 5% cut by<br />
2020 from carbon emissions levels in<br />
2000, the Australian government has set<br />
an ultimate aim of 80% in emissions<br />
reduction by 2050. As the ultimate target<br />
is less than 40 years away, new gas<br />
plants therefore may see shortened eco-<br />
Table 1 | Possible Trajectory Of Cuts In Carbon Dioxide Equivalent Emissions<br />
Scenario 2020 to 2030 2030 to 2040 2040 to 2050<br />
Severe back-ended reduction (% per year) 1.0 2.0 4.5<br />
Back-ended reduction (% per year) 2.0 2.5 3.0<br />
Straight-line reduction (% per year) 2.5 2.5 2.5<br />
Business-as-usual projections by Department of Climate Change and Energy Efficiency.<br />
Table 2 | Carbon Intensities Of Different Plant Fuel Types<br />
Plant fuel type Approximate CO 2 intensity (t/MWh)<br />
Brown coal (Loy Yang A & B) 1.20<br />
Black coal 1.00<br />
Open cycle gas turbines (peak load) 0.65<br />
Closed cycle gas turbines (base load) 0.45<br />
Approximate current NEM average 0.90<br />
CO 2 —Carbon dioxide. NEM—National Electricity Market. t/MWh—Terajoules per megawatt hour. A terajoule is equal<br />
to one trillion joules; one joule is a unit of energy.<br />
Chart 1 Emissions Trajectories<br />
Business-as-usual case Severe back-ended reduction Back-ended reduction<br />
Straight-line reduction<br />
Zone of heightened<br />
carbon risk<br />
0<br />
1980 1990 2000 2010 2020 2025 2030 2035 2040 2045 2050 2060<br />
Coal <strong>Renewables</strong> and gas<br />
Technology risk: solar,<br />
© <strong>Standard</strong> & Poor’s 2012.<br />
wind, geothermal, etc.<br />
nomic lives—even if investment decisions<br />
were made today.<br />
Continuing weak base-load demand also<br />
dims the prospect for investments in new<br />
gas base-load power. Conversely, demand<br />
for peak energy is rising. <strong>Standard</strong> & Poor’s<br />
Ratings Services therefore believes the<br />
main role of gas will be supplying peak<br />
rather than base-load power.<br />
What’s more, we consider the pool of<br />
investors to undertake such large and<br />
capital-intensive investments to be<br />
small. Only the big three integrated<br />
energy companies—Origin Energy Ltd.<br />
(BBB+/Stable/A-2), AGL Energy Ltd.<br />
(BBB/Watch Neg/—), and TRUenergy<br />
Pty Ltd. (BBB/Stable/—)—are best<br />
placed to invest or sponsor investments<br />
in generation through offtake contracts.<br />
These companies have led the consolidation<br />
in the retail sector, capturing 80%<br />
of the market after New South Wales’<br />
privatization in 2011. Likewise, the generation<br />
sector is set to merge in coming<br />
years as the companies seek greater vertical<br />
integration to manage their retail<br />
loads. AGL’s conditional announcement<br />
to acquire the Loy Yang A power station<br />
is in our view consistent with this trend.<br />
Owners of stand-alone base-load coal<br />
plants, however, are unlikely to invest in<br />
new generation, in our opinion. In particular,<br />
sponsors of highly leveraged<br />
project-financed vehicles that are struggling<br />
financially and facing truncated<br />
lives of existing plants are unlikely to<br />
have the surplus cash flow to compete<br />
with the “big 3” for new investments (see<br />
“Prospects Dim For Australian Power<br />
Generators As Weak Pricing And Carbon<br />
Uncertainty Stifle Outlook,” published June<br />
28, 2011, on RatingsDirect, on the Global<br />
Credit Portal). Moreover, the incentive to<br />
provide fresh equity without a retail offtake<br />
agreement is limited, and without<br />
such an agreement, financiers are<br />
unlikely to be attracted to provide capital.<br />
Nevertheless, government support<br />
could ignite new investments, especially<br />
in the renewables sector. The federal<br />
government’s A$10 billion Clean Energy<br />
Finance Corp. could be a major player in<br />
promoting renewable solutions. A material<br />
build-out of renewables is likely<br />
under the government’s requirement that
etailers source 20% of electricity from<br />
renewables by 2020.<br />
Once built, renewable generation with<br />
its negligible operating costs appears to<br />
have a clear cost advantage. A major<br />
build-out of renewables is likely to pressure<br />
the usage (capacity factors) of<br />
existing stations and wholesale prices.<br />
This, in turn, could mount the strain on<br />
highly leveraged thermal plants—in particular,<br />
older more carbon-intensive plants<br />
and those further up the merit order.<br />
So, while much of the existing coalfired<br />
fleet is likely to continue to be necessary<br />
for system security and reliability<br />
for decades to come, their profitability is<br />
not assured. The development of renewables<br />
as a major source of generation<br />
could further erode the business case for<br />
new gas base-load power.<br />
The Government’s Carbon<br />
Abatement Objectives<br />
The government’s carbon-abatement<br />
program will be implemented in several<br />
phases (see Appendix I for a summary of<br />
the scheme). The ultimate objective is to<br />
slash greenhouse gas emissions by 80%<br />
by 2050, compared to levels in 2000 of<br />
about 550 million tons (mt) of carbon<br />
dioxide (CO2) emissions, according to<br />
the state of Victoria’s Environment<br />
Protection Authority. With electricity<br />
generation being the single largest source<br />
of carbon emissions in Australia at 37%,<br />
this sector is clearly at the front-line of<br />
any plans to cut carbon emissions.<br />
Under the clean energy legislation,<br />
Australia has unconditionally committed<br />
to shave off 5% of its comparative 2000<br />
greenhouse gas emissions by 2020, to<br />
about 524 mt CO2 emissions. This is<br />
equivalent to a 9% (56 mt CO2 emissions)<br />
cut to current emissions, based on the<br />
Department of Climate Change expectations<br />
of average annual emissions of 580<br />
mt CO2 emissions from 2008 to 2012.<br />
The 5% target by 2020 is actually<br />
more challenging than it appears. On a<br />
normal case for the Australian economy,<br />
the Department of Climate Change<br />
expects average annual emissions to<br />
increase to 686 mt CO2 emissions by<br />
2020. Hence, the 5% cut could actually<br />
involve restructuring the carbon inten-<br />
sity of the economy to achieve a reduction<br />
of 162 mt CO2 emissions or 29% to<br />
a business-as-usual case.<br />
Given its proximity, the 2020 target is<br />
not surprisingly the focus of debate<br />
about emission reductions. Nonetheless,<br />
in our view, the next 10 to 15 years will<br />
also be key toward achieving the ultimate<br />
goal in 2050. Delays in investments<br />
to materially replace the current generation<br />
fleet beyond this period are likely to<br />
increase the risk of stranded thermal<br />
assets (see chart 1).<br />
Such a scenario elevates the technology<br />
risk to develop viable alternatives.<br />
In the past half-century, a wellmaintained<br />
coal-fired station typically<br />
was expected to have a useful life of up<br />
to 50 years or even longer. But because<br />
of the 2050 target, the economic lives of<br />
new thermal stations, in the absence of<br />
carbon capture and storage, are likely to<br />
have significantly shorter economic lives<br />
Chart 2 Historical Generation By Fuel Type<br />
For 2009 And 2010<br />
Source: RepuTex Carbon Analytics, 2012.<br />
© <strong>Standard</strong> & Poor’s 2012.<br />
<strong>Wind</strong> (1%)<br />
Natural gas (10%)<br />
Fuel oil (0%)<br />
Hydro (6%)<br />
Brown coal (27%)<br />
Black coal (56%)<br />
Chart 3 Historical Emissions By Fuel Type<br />
For 2009 And 2010<br />
Natural gas (6%)<br />
Brown coal (38%)<br />
Black coal (56%)<br />
Emissions are calculated as per metric ton of carbon dioxide.<br />
Source: RepuTex Carbon Analytics, 2012.<br />
© <strong>Standard</strong> & Poor’s 2012.<br />
Historical Generation<br />
<strong>Standard</strong> & Poor’s Ratings Services CreditWeek | May 23, 2012 51
FEATURES<br />
52 www.creditweek.com<br />
SPECIAL REPORT<br />
(stranded asset risk). As such, it is difficult<br />
to see thermal capacity replacing<br />
the current fleet of plants. Nuclear<br />
power is seen to be a politically difficult<br />
solution for ensuring energy supply. And<br />
current low-carbon technologies are<br />
generally considered unable to provide<br />
reliable supply at a cost commensurate<br />
with current thermal technologies that<br />
have lower carbon-intensity.<br />
Abundant And Relatively<br />
Cheap Coal Entrenches<br />
Reliance On The Fuel<br />
Australia’s endowment of abundant and<br />
cheap coal means that the country is<br />
largely reliant on this fuel for its electricity<br />
supply. About 80% of power is<br />
being sourced from carbon-intensive<br />
black and brown coal plants located<br />
close to the mines, making it among the<br />
cheapest sources of energy supply (see<br />
charts 2 and 3). The stations typically<br />
Table 3 | Scenarios Based On Changing Carbon And Gas Prices<br />
Carbon price Gas price per GJ<br />
Scenario 1 Per Treasury modeling* A$4.50<br />
Scenario 2 Per Treasury modeling* A$7.50§<br />
Scenario 3 Hits a floor in 2015 and stays low A$7.50§<br />
GJ—Gigajoule, or one billion joules (one joule is a unit of energy). *Per the Australian Energy Market Operator’s<br />
historical expectations of steady growth in electricity demand of about 2% per year. §Higher gas prices in 2015 to<br />
reflect international gas pricing following commencement of liquefied natural gas exports. A crucial assumption,<br />
particularly for Scenario 2, is that black coal prices do not increase to the extent that the carbon price shifts the<br />
relativities back toward gas as in Scenario 1. Additional assumptions are contained in Appendix II.<br />
Table 4 | Major Terms Of The Clean Energy Legislation<br />
have a 40 to 50 year physical lifespan.<br />
The balance is generated from a combination<br />
of gas, fuel oil, and renewables<br />
such as hydro and wind. However, much<br />
of the gas generation is for peak load<br />
rather than base load.<br />
Gas May Take Up The Slack<br />
As Coal Reliance Reduces<br />
At first glance, it would seem logical that<br />
the carbon tax would result in gas being<br />
the favored choice. Gas base-load generation<br />
emits about half the emissions of<br />
comparable coal-fired plants (see table 2).<br />
However, the economics of gas as a<br />
replacement fuel are subject to a number<br />
of factors. These include relative fuel<br />
costs, carbon prices, relative carbon<br />
intensities, plant capital costs, and<br />
expected plant useful lives.<br />
RepuTex Ltd., a Hong Kong-based<br />
firm specializing in carbon risk analytics,<br />
has modeled three scenarios to examine<br />
the sensitivity of the price of carbon permits<br />
and gas on the fuel mix beyond<br />
2020 (see table 3). The proportion of gas<br />
generation in the fuel mix rises under all<br />
three scenarios. It increases from historical<br />
levels of about 10%, to slightly more<br />
than 30% in Scenario 1 and to less than<br />
20% in Scenario 3, subject to gas and<br />
carbon prices (see chart 5). Under<br />
Scenario 1, coal’s contribution to the fuel<br />
mix drops to about half from 80%, with<br />
most of the gap being filled by gas.<br />
Scheme coverage Stationary energy, industrial processes, non-legacy waste, fugitive emissions, and transport (except household transport<br />
fuels, light vehicle business transport, and off-road fuel used by the agriculture, forestry, and fishing industries). In terms of<br />
waste exposure, only landfill facilities with direct emissions of 25,000 tons CO 2 emissions per year or more will be liable.<br />
Fixed price period Three years from July 1, 2012, with a starting price of A$23 per ton rising at 2.5% per year in real terms. Hence, if inflation<br />
is at 2.5%, the price will increase by 5%.<br />
Emissions trading scheme From July 1, 2015, with a price ceiling and floor for the first three years.<br />
● Ceiling: Set at A$20 above the expected international price, rising by 5% in real terms each year.<br />
Timeline for setting pollution caps<br />
● Floor: Set at A$15, rising by 4% each year in real terms.<br />
Permits under the scheme can be sourced from “credible” international carbon markets, but a minimum of 50% of the<br />
liability must be met from domestic permits.<br />
Deadline to set pollution cap Pollution cap announced for financial year(s) beginning:<br />
5/31/2014 2015 to 2019 inclusive<br />
6/30/2016 2020<br />
6/30/2017 2021<br />
The pollution cap is intended to be reset annually to maintain five years of known caps at any given time.
<strong>Renewables</strong> growth is limited in all<br />
three scenarios and fails to meet the 20%<br />
2020 target. <strong>Wind</strong> begins to appear in a<br />
material way in the fuel-mix picture,<br />
while hydro somewhat maintains its<br />
share (see chart 5).<br />
However, when gas price spikes to<br />
A$7.50 per gigajoule (GJ; or one billion<br />
joules, a unit of energy), the build-up in<br />
gas slows considerably. Scenarios 2 and<br />
3 illustrate the sensitivity of fuel costs to<br />
the evolution of the fuel mix despite<br />
there being a carbon price. Brown coal’s<br />
share would be largely taken up by gas,<br />
but also to some extent by black coal in<br />
Scenario 3. For the third scenario, the<br />
low price of carbon permits does not<br />
offset the cost advantage of coal as<br />
much compared to Scenario 2 if gas<br />
prices stayed at A$7.50 per GJ.<br />
…But Gas Is Unlikely To Be<br />
A Runaway “Winner”<br />
While gas is expected to be a “winner”<br />
under the carbon plan, the extent of the<br />
“victory” could be muted. The opening up<br />
of the east coast of Australia from 2014,<br />
as the coal seam gas (CSG)-to-LNG projects<br />
begin to export, is expected to push<br />
up gas prices, reflecting export parity<br />
pricing. RepuTex’s modeling suggests this<br />
impact on gas, particularly if carbon<br />
prices are low, will help preserve coal’s<br />
competitiveness. This expectation stands<br />
in marked contrast to that in the U.S. The<br />
advent of large exploitable amounts of<br />
shale gas has recently seen U.S. natural<br />
gas prices test new lows, leading to many<br />
utilities switching from coal to gas.<br />
Indeed, if gas prices were to steeply<br />
rise, we believe coal could still have a<br />
superior cost advantage. This is even<br />
though we expect new thermal coal<br />
prices will increase when long-term low<br />
price contracts are to be renewed at the<br />
higher levels of the past few years (to<br />
about US$100 to US$120 per metric ton<br />
from less than US$30 per ton 10 years<br />
ago). The successful development of the<br />
Cobborra mine by the New South Wales<br />
government—prices reported to be<br />
about A$30 per ton—could help offset<br />
any climb in coal fuel costs. Also, we<br />
expect fuel costs for the brown coal<br />
plants in Victoria to remain low with no<br />
Chart 4 Selected Coal-Fired Generators In Australia—<br />
Commissioned Prior To 1981<br />
2,500<br />
2,000<br />
1,500<br />
1,000<br />
Capacity (left scale)<br />
(Capacity [Megawatts])<br />
500<br />
0<br />
Energy Brix<br />
1960s<br />
Playford B<br />
1960s<br />
Carbon intensity (right scale)<br />
Collinsville<br />
1960s<br />
Hazelwood<br />
1960s<br />
Liddell<br />
1970s<br />
Carbon dioxide emissions (t/MWh)<br />
Vales Point B<br />
1970s<br />
Wallerawang C<br />
1970s<br />
Gladstone<br />
1980s<br />
Note: It is assumed that during 2012, the following power stations will be retired: Swanbank B Power Station<br />
(4x120 MW, coal fired, Queensland) and Munmorah Power Station (2x300 MW, coal fired, New South Wales).<br />
Sources: RepuTex Carbon Analytics, Australian Energy Market Operator, and <strong>Standard</strong> & Poor’s.<br />
© <strong>Standard</strong> & Poor’s 2012.<br />
Chart 5 Fuel Mix Changes From 2010 To 2020 Under Scenarios 1, 2, And 3<br />
(%)<br />
100<br />
90<br />
80<br />
70<br />
60<br />
50<br />
40<br />
30<br />
20<br />
10<br />
0<br />
Black Coal Brown Coal Natural Gas Fuel Oil* Hydro <strong>Wind</strong><br />
Historic 2010 Scenario 1 2020 Scenario 2 2020 Scenario 3 2020<br />
*No change.<br />
Source: RepuTex Carbon Analytics, 2012.<br />
© <strong>Standard</strong> & Poor’s 2012.<br />
Chart 6 Mainland Volume Weighted Average Spot Electricity Prices<br />
120<br />
100<br />
80<br />
60<br />
40<br />
20<br />
Queensland New South Wales Victoria South Australia<br />
(A$ per megawatt hour)<br />
0<br />
2000 2001 2002 2003 2004 2005 2006 2007 2008 2009 2010<br />
Source: Australian Energy Regulator.<br />
© <strong>Standard</strong> & Poor’s 2012.<br />
<strong>Standard</strong> & Poor’s Ratings Services CreditWeek | May 23, 2012 53<br />
1.8<br />
1.6<br />
1.4<br />
1.2<br />
1.0<br />
0.8<br />
0.6<br />
0.4<br />
0.2<br />
0.0
FEATURES<br />
export parity pricing. In fact, the Loy<br />
Yang plants in Victoria have the lowest<br />
short-run marginal costs in the National<br />
Electricity Market.<br />
The prospect of uncertain returns on<br />
new power stations would make<br />
attracting investors to new gas plants a<br />
major hurdle. This issue would become<br />
more acute when the government’s contract<br />
to close 2000 megawatts (MW) of<br />
carbon-intensive plants by 2015 is implemented.<br />
The RepuTex scenario outputs,<br />
particularly Scenario 1, are more theoretical<br />
possibilities if there was clarity<br />
and certainty about market dynamics,<br />
rather than a likely outcome we expect.<br />
Limited Near-Term Prospects For<br />
New Base-Load Generation<br />
Further clouding new investment<br />
prospects are the current demand and<br />
supply dynamics. Average wholesale<br />
prices for the past 10 years have been relatively<br />
flat once the impact of the drought<br />
in 2007 is removed (see chart 6). They also<br />
have consistently underperformed the forward<br />
price curve. Hence, we see limited<br />
reliable price signals that the market is in<br />
need of significant new supply.<br />
What’s more, actual energy dispatched<br />
in the past few years has<br />
declined (see chart 7). This trend has<br />
been contrary to Australian Energy<br />
Market Operator’s (AEMO) historical<br />
54 www.creditweek.com<br />
SPECIAL REPORT<br />
expectations of about 2% base-load<br />
growth. However, AEMO has more<br />
recently scaled back its future growth to<br />
be more in line with recent trends.<br />
We consider headwinds for electricity<br />
demand growth include:<br />
● Introduction of material demandmanagement<br />
programs particularly<br />
through smart meters such as those<br />
being rolled out in Victoria.<br />
● The impact of network-related price<br />
rises prompting consumers to actively<br />
monitor and reduce consumption<br />
through the use of more efficient<br />
appliances.<br />
● Continued “hollowing out” of<br />
Australia’s industrial base as manufacturing<br />
production plants relocate offshore.<br />
We note Alcoa is reviewing the<br />
future of its Point Henry Aluminium<br />
smelter, which if closed could add 200<br />
MW supply to the market.<br />
However, there is an expectation of<br />
electricity demand rising to power the<br />
CSG to LNG plants in Queensland.<br />
RepuTex estimates that this development<br />
could spur a rise of as much as<br />
1,000 MW from 2014. Over the very<br />
long term, the pace of any electrification<br />
of the road transport fleet, if this ever<br />
becomes material, is likely to be the<br />
main driver of demand.<br />
As such, we see the supply demand<br />
equation remaining in balance for some<br />
The prospect of uncertain returns on new power<br />
stations would make attracting investors to new<br />
gas plants a major hurdle.<br />
Table 5 | Expected Plant Closures Under Carbon Abatement Scheme*<br />
Power station Capacity (MWh energy) Emissions intensity (Tons CO 2 /MWh)<br />
Playford power station 1,216,818 1.36<br />
Energy Brix 938,369 1.40<br />
Hazelwood power station 10,100,000 1.14<br />
Collinsville power station 964,912 1.39<br />
Yallourn power station 11,500,000 1.11<br />
*RepuTex statistics used.<br />
years. There is little impetus for demand<br />
increasing to soak up any additional<br />
supply from any new base-load plants.<br />
With base-load demand likely to remain<br />
flat, current coal plants would need to be<br />
displaced in order to meet carbon emissions<br />
targets. But investors will have to<br />
be convinced of the adequacy of returns<br />
from alternative base-load power<br />
sources to undertake the large capital<br />
investment required.<br />
But we do envisage some additional<br />
investment in peaking plants. Trends show<br />
the market is becoming more skewed<br />
toward “peak” events, supporting AEMO’s<br />
2.6% forecast for annual peak demand<br />
growth. Nevertheless, such instances can<br />
pressure system supply and cause price<br />
spikes. We expect near-term investments<br />
would more likely be in cheaper, smallerscale<br />
gas peaking generation.<br />
It is likely that the removal of 2,000<br />
MW under the government’s contract<br />
will call for new plants to fill the gap.<br />
That said, we expect any closure to be<br />
done gradually, thereby dampening any<br />
potential price signal from such a large<br />
withdrawal of system supply. For<br />
example, if Hazelwood were chosen, it<br />
would make sense for a gradual shutdown<br />
of its eight 200 MW units—even<br />
as low as one unit per year—in order to<br />
maintain system robustness. Any such<br />
gradual change could well be filled with<br />
small units including renewables, which<br />
are being promoted under various government-sponsored<br />
schemes.<br />
New Base-Load Generation Faces<br />
Challenge From <strong>Renewables</strong><br />
Various renewable energy schemes<br />
implemented could dull the shine for<br />
new base-load investments. RepuTex<br />
estimates that rooftop solar installations<br />
over the past half dozen years or so have<br />
taken as much as 500 MW from demand<br />
as of the end of 2011. In addition,<br />
mandatory renewable schemes that<br />
require retailers to source 20% of power<br />
from renewable sources by 2020 could<br />
trigger sufficient incremental supply to<br />
meet any modest increase in demand.<br />
But new renewable generation effectively<br />
“lengthens” the queue of generators<br />
to be displaced (or the bid stack).
The addition of so much generation with<br />
negligible operating costs could also<br />
adversely affect the volume dispatched<br />
and energy price for thermal base-load<br />
plants. Such a trend could impede any<br />
near-term improvement in the financial<br />
conditions of stand-alone base-load generators<br />
that are highly leveraged.<br />
<strong>Renewables</strong> To Fall Short<br />
Of 2020 Target<br />
The three RepuTex scenarios expect<br />
renewables to fall short of the government’s<br />
requirement that 20% of energy<br />
sourced should be derived from renewable<br />
generation by 2020. RepuTex’s<br />
modeling suggests renewables generation’s<br />
market share would range from<br />
14% to 17%.<br />
To reach the government target, a<br />
considerable leap in current renewable<br />
generation is required. Installed capacity<br />
of wind farms would have to increase by<br />
between 4,750 MW and 5,000 MW (at<br />
an average 30% capacity factor) from<br />
1,842 MW at June 30, 2010, to reach the<br />
2020 target, based on RepuTex’s estimates.<br />
This means about 25 terawatt<br />
hours (TWh) of large-scale renewable<br />
energy, compared to 10.4 TWh in 2011.<br />
Judging by the currently small size of<br />
the renewables pipeline, meeting the<br />
2020 target could be a stretch (see charts<br />
8 and 9). The weak price and surplus of<br />
renewable energy certificates have<br />
affected investments in renewables.<br />
AGL’s 420 MW Macarthur wind farm is<br />
really the only project of scale under<br />
construction. In addition, projects under<br />
the government’s “Solar Dawn” project<br />
have thus far been unable to obtain<br />
power purchase agreements from creditworthy<br />
counterparties.<br />
On the other hand, energy retailers<br />
have a strong incentive to meet the government’s<br />
objective. Under any renewable<br />
shortfall, retailers face the imposition<br />
of large penalties of a flat A$65 per<br />
megawatt hour (MWh; which rises to<br />
A$92 per MWh if grossed up for its nondeductibility).<br />
As such, the penalties<br />
could spur investments in renewable<br />
generation to bridge the gap between<br />
RepuTex’s modeled contributions to the<br />
government target. Energy retailers may<br />
be at a competitive disadvantage if their<br />
rivals were able to avoid these potentially<br />
onerous costs and increase market<br />
share as a result of better pricing.<br />
However, a key caveat is that if wholesale<br />
power prices remain weak, it may<br />
be cheaper to pay the market penalty on<br />
the shortfall. The penalty is set at a flat<br />
rate with no escalation for continued<br />
noncompliance. In the overall scheme of<br />
things, it may be more efficient to absorb<br />
some uplift in the average cost of supply<br />
than to incur potentially large capital<br />
costs on relatively expensive renewable<br />
technology over a relatively compressed<br />
time frame.<br />
Gas could lose out if renewables, with<br />
their negligible operating costs,<br />
approach closer to the 20% mandatory<br />
renewable energy target. Particularly, in<br />
the absence of substantial system<br />
Chart 7 Actual NEM Generation Output Versus AEMO Demand Projections<br />
ESOO2011 ESOO2010 ESOO2009 ESOO2008 ESOO2007 Actual<br />
250,000<br />
240,000<br />
230,000<br />
220,000<br />
210,000<br />
200,000<br />
190,000<br />
180,000<br />
2007 2008 2009 2010 2011 2012 2013 2014 2015 2016 2017 2018 2019<br />
NEM—National Electricity Market.<br />
Source: AEMO: Australian Energy Market Operator forecasts from various annual Electricity Statement Of<br />
Opportunities (ESOO).<br />
© <strong>Standard</strong> & Poor’s 2012.<br />
Chart 8 Australian Installed Solar And <strong>Wind</strong> Capacity As Of May 2011<br />
(MW)<br />
3,000<br />
2,500<br />
2,000<br />
1,500<br />
1,000<br />
<strong>Wind</strong> installed capacity Solar installed capacity<br />
500<br />
0<br />
2000 2001 2002 2003 2004 2005 2006 2007 2008 2009 2010<br />
MW—Megawatts.<br />
Source: RepuTex Carbon Analytics, 2012.<br />
© <strong>Standard</strong> & Poor’s 2012.<br />
<strong>Standard</strong> & Poor’s Ratings Services CreditWeek | May 23, 2012 55
FEATURES<br />
56 www.creditweek.com<br />
SPECIAL REPORT<br />
Table 6 | RepuTex Ltd. Carbon Price<br />
Forecasts<br />
Year A$ per ton of CO 2 emissions<br />
2012 23.00<br />
2013 24.15<br />
2014 25.40<br />
2015 29.00<br />
2016 31.90<br />
2017 35.09<br />
2018 38.60<br />
2019 42.46<br />
2020 46.70<br />
Table 7 | RepuTex Ltd. CCGT<br />
And OCGT Capital<br />
Cost Assumptions<br />
Typical Project Cost<br />
Plant type size (MW) (2011$/KW)<br />
CCGT 700 1,268<br />
CCGT 430 1,005<br />
OCGT 160 900<br />
CCGT—Base-load gas transmission. OCGT—Peak-load<br />
gas turbines. MW—Megawatt. kW—Kilowatt.<br />
Table 8 | Long Run Marginal Cost: Coal, Gas, And <strong>Wind</strong><br />
demand, the small discrete size of many<br />
wind-farm projects could fill in any<br />
supply shortage, in our view. This further<br />
alleviates the need to build out largescale<br />
base-load gas plants.<br />
Toward 2050: Carbon Price<br />
Paradox And Increased<br />
Stranded Asset Risk<br />
In the longer term, the price of carbon<br />
would have to rise significantly to change<br />
the relative operating costs of coal and gas.<br />
In our view, the projected carbon price<br />
trend of the Treasury’s forecasts is highly<br />
uncertain. Furthermore, the certainty provided<br />
in the fixed carbon price period is just<br />
for three years, which is not very long in<br />
the scheme of new investments.<br />
What’s more, the flexible price<br />
period for 2015 to 2018 (with its price<br />
cap and floor) before moving to a<br />
market price, is likely to introduce<br />
carbon price volatility. Carbon prices<br />
collapsed in the European carbon<br />
market to about €7.30 (A$9.73) per ton<br />
of CO2 at the end of 2011, after fluctuating<br />
between €15 (A$20) to as much<br />
as €25 (A$33) for the past several years<br />
(see chart 10).<br />
Paradoxically, higher carbon prices<br />
would not necessarily trigger new<br />
investments. The timing of such rises<br />
is key. Should carbon prices rise substantially<br />
only some time after 2020 to<br />
2025, the window for gas as a transition<br />
fuel could be relatively short. The<br />
potential for stranded asset risk of<br />
new gas plants will intensify when<br />
seen in the context of the government’s<br />
longer term 80% carbon abatement<br />
target. Thus, if material investment<br />
in gas does not occur in the next<br />
10 years, there is a risk that gas may<br />
not be as big a “winner” as expected<br />
in the transition to a lower carbonintensity<br />
energy base. The later investments<br />
are delayed, the higher the risk<br />
of stranded assets.<br />
Another headwind for gas in the<br />
longer term is the development of<br />
renewable technologies. As advancements<br />
are made in renewable technologies<br />
and carbon price increases, renewables<br />
are likely to become more<br />
attractive to investors relative to gas.<br />
A Leap To <strong>Renewables</strong><br />
Could Occur<br />
Globally, gas may be in store for a golden<br />
age. But in Australia, the bias toward<br />
coal and limited available base-load gas<br />
may trigger a different dynamic. The<br />
near-term prospects for gas as a transition<br />
fuel are limited. We expect gas<br />
prices to increase, thus offsetting the<br />
impact of a higher carbon price.<br />
Schemes supporting renewable technology<br />
would also result in gas being<br />
less favored to take over coal. In the<br />
longer term, potential stranded asset<br />
risk is likely to see financiers being<br />
reluctant to commit to long-term<br />
stand-alone gas plants.<br />
If these predictions were to come<br />
true, meeting carbon emission targets<br />
may well hinge on renewables. We<br />
believe that if renewable technologies<br />
were to significantly improve the efficiency<br />
and cost of large-scale base-load<br />
renewable generation, they could effectively<br />
bypass gas. However, the technological<br />
potential remains uncertain, and<br />
unless renewables prove themselves in<br />
the next decade, the transition to clean<br />
energy could be a dramatic leap. Such a<br />
step-change needed further fuels doubts<br />
Avg LRMC (A$/MWh) Avg emission intensity Carbon price (A$) Adjusted LRMC (A$)<br />
Brown coal $48 1.3 $23 $77.90<br />
Black coal $54 1.1 $23 $79.30<br />
CCGT $60 0.48 $23 $71.04<br />
OCGT $88 0.65 $23 $102.95<br />
<strong>Wind</strong> $105 0 $23 $105<br />
Future capital costs are also scaled down by 30% of CPI for future years to reflect the technology cost downward trends. CCGT—Base-load gas turbines. OCGT—Peak-load gas<br />
turbines. LRMC—Long-run marginal costs. MWh—Megawatt per hour.
about the investment prospects in the<br />
Australian generation sector.<br />
Appendix I: Scheme Summary*<br />
*Source: Securing A Clean Energy Future: The<br />
Australian Government’s Climate Change Plan 2011.<br />
While the federal opposition’s policy is<br />
to repeal the current scheme, they support<br />
the principle of a 5% cut by 2020<br />
using alternative mechanisms. Hence,<br />
we consider that management of the<br />
issue of future abatement will continue<br />
to apply (see table 4).<br />
Transitional assistance<br />
for stationary energy<br />
To ease the transition under the<br />
scheme, the government has set up a<br />
compensation scheme of A$5.5 billion<br />
for coal-fired generation with emissions<br />
intensity that exceeds one metric<br />
ton of CO2 emissions per megawatt<br />
hour (effectively this will be for brown<br />
coal generation). This is broken down<br />
into A$1 billion in cash to be distributed<br />
before June 30, 2012. About<br />
A$4.5 billion of free permits will be<br />
issued over four years starting from<br />
fiscal year July 1, 2013. Therefore, the<br />
liability for fiscal 2013 will need to be<br />
covered from the cash compensation<br />
and working capital.<br />
The government has also initiated a<br />
contract for closure of up to 2,000 MW<br />
of capacity with emissions exceeding<br />
1.2 metric tons of CO2 emissions per<br />
megawatt hour. Effectively this scheme<br />
is restricted to five power stations (see<br />
table 5) with the Commonwealth’s preferred<br />
timing of closure to progressively<br />
occur from July 1, 2016 to June 30,<br />
2020 (subject to energy security).<br />
Negotiations regarding “contracts to<br />
close” are expected to be completed by<br />
June 30, 2012.<br />
Investment in renewable energy<br />
To promote investment in clean energy,<br />
the government will directly invest<br />
A$13 billion in clean energy projects.<br />
About A$10 billion would be via the<br />
Clean Energy Finance Corp., which is<br />
to commercialize “clean” technology<br />
and A$3.2 billion in research, development,<br />
and commercialization of early<br />
Chart 9 Forecast 2020 Renewable Generation Under RepuTex Modelling<br />
(%)<br />
25<br />
20<br />
15<br />
10<br />
5<br />
0<br />
Hydro <strong>Wind</strong> Solar<br />
Historical Scenario 1 2020 Scenario 2 2020 Scenario 3 2020<br />
Source: RepuTex Carbon Analytics, 2012<br />
© <strong>Standard</strong> & Poor’s 2012.<br />
2020 Target<br />
Chart 10 EU Allowance Price For December 2012 Delivery<br />
(Euro per metric ton of CO 2 emissions)<br />
20<br />
18<br />
16<br />
14<br />
12<br />
10<br />
8<br />
6<br />
4<br />
2<br />
0<br />
1/4/2011 3/4/2011 5/4/2011 7/4/2011 9/4/2011 11/4/2011 1/4/2012<br />
Source: Platts.<br />
© <strong>Standard</strong> & Poor’s 2012.<br />
stage renewable technologies via the<br />
Australian Renewable Energy Agency.<br />
Appendix II: RepuTex<br />
Modeling Assumptions<br />
The carbon price trajectory (real prices),<br />
assuming the Treasury’s price path, is<br />
shown in table 6. This price path is used<br />
as it is considered necessary given that<br />
gas CCGT’s (base-load gas turbines) longrun<br />
marginal cost is about 50% more than<br />
coal’s, and is considered necessary to<br />
make gas competitive and drive the government’s<br />
outcome (see tables 7 and 8). CW<br />
For more articles on this topic search RatingsDirect with keyword:<br />
Renewable Energy<br />
Analytical Contacts:<br />
Richard Creed<br />
Melbourne (61) 3-9631-2045<br />
Parvathy Iyer<br />
Melbourne (61) 3-9631-2034<br />
<strong>Standard</strong> & Poor’s Ratings Services CreditWeek | May 23, 2012 57
contactS<br />
Global Ratings Network<br />
Beijing<br />
Ping Chew<br />
Suite 1601, 16/F Tower D, Beijing CITC<br />
A6 Jian Guo Men Wai Da Jie<br />
Beijing, China 100022<br />
(86) 10-6569-2909<br />
Boston<br />
Kurt Forsgren<br />
225 Franklin Street, 15th Floor<br />
Boston, MA 02110-2804<br />
(1) 617-530-8308<br />
Buenos Aires<br />
Marta Castelli<br />
Torre Alem Plaza, Av<br />
Leandro N. Alem 855<br />
C1001AAD, Buenos Aires, Argentina<br />
(54) 114-891-2128<br />
Chicago<br />
Sarah W. Eubanks<br />
130 East Randolph Street, Suite 2900<br />
Chicago, IL 60601<br />
(1) 312-233-7019<br />
Dallas<br />
Alexander M. Fraser<br />
Lincoln Plaza<br />
500 North Akard Street, Suite 3200<br />
Dallas, TX 75201<br />
(1) 214-871-1400<br />
Dubai<br />
Jan <strong>Will</strong>em Plantagie<br />
Dubai International Financial Centre<br />
The Gate Village, Building 5-Level 2<br />
PO Box 506650<br />
Dubai, United Arab Emirates<br />
(971) 0-4-709-6800<br />
Frankfurt<br />
Torsten Hinrichs<br />
Neue Mainzer Strasse 52-58<br />
60311 Frankfurt-am-Main, Germany<br />
(49) 69-3399-9110<br />
Hong Kong<br />
Ping Chew<br />
Suite 3003 30th Floor<br />
Edinburgh Tower, The Landmark<br />
15 Queen’s Road Central, Hong Kong<br />
(852) 2533-3500<br />
Johannesburg<br />
Konrad Reuss<br />
Unit 4, 1 Melrose Boulevard<br />
Melrose Arch<br />
Johannesburg, South Africa<br />
(27) 11-214-1991<br />
Kuala Lumpur<br />
Surinder Kathpalia<br />
17-7, The Boulevard<br />
Mid Valley City, Lingkaran Syed Putra<br />
59200 Kuala Lumpur, Malaysia<br />
(60) 3-2284-8668<br />
London<br />
20 Canada Square, Canary Wharf<br />
London E14 5LH, U.K.<br />
(44) 20-7176-3800<br />
Madrid<br />
Jesus Martinez<br />
Jose Tora<br />
Marques de Villamejor, 5<br />
28006 Madrid, Spain<br />
(34) 91-389-6969<br />
www.standardandpoors.com<br />
Melbourne<br />
John Bailey<br />
Level 45, 120 Collins Street<br />
Melbourne VIC 3000, Australia<br />
(61) 3-9631-2000<br />
Mexico City<br />
Victor Herrera, Jr.<br />
Punta Santa Fe Torre A<br />
Prolongacion Paseo de la Reforma 1015<br />
Col. Santa Fe<br />
Deleg. Alvaro Obregon<br />
01376 Mexico City, C.P.<br />
(52) 55 5081-4410<br />
Milan<br />
Maria Pierdicchi<br />
Vicolo San Giovanni sul Muro 1<br />
20121 Milan, Italy<br />
(39) 02-72111-1<br />
Moscow<br />
Alexei Novikov<br />
4/7 Vozdvizhenka Street, Bldg. 2<br />
7th Floor<br />
Moscow 125009, Russia<br />
(7) 495-783-40-12<br />
Mumbai<br />
CRISIL House<br />
Cts Number 15 D<br />
Central Avenue, 8th Floor<br />
Hiranandani Business Park<br />
Powai Mumbai, India, 400 076<br />
(91) 22-3342 3561<br />
New York<br />
55 Water Street<br />
New York, NY 10041<br />
(1) 212-438-2000<br />
Paris<br />
Carol Sirou<br />
40 rue de Courcelles<br />
75008 Paris, France<br />
(33) 1-4420-6662<br />
San Francisco<br />
Steven G. Zimmermann<br />
One Market, Steuart Tower, 15th Floor<br />
San Francisco, CA 94105-1000<br />
(1) 415-371-5000<br />
São Paulo<br />
Regina Nunes<br />
Edificio Roberto Sampaio Ferreira<br />
Av. Brigadeiro Faria Lima, No. 201<br />
18th Floor<br />
CEP 05426-100, Brazil<br />
(55) 11-3039-9770<br />
Seoul<br />
J.T. Chae<br />
2Fl, Seian Building<br />
116 Shinmunro 1-ga, Jongno-gu<br />
Seoul, Korea, 110-700<br />
(82-2) 2022-2300<br />
Singapore<br />
Surinder Kathpalia<br />
Prudential Tower, #17-01/08<br />
30 Cecil Street<br />
Singapore 049712<br />
(65) 6438-2881<br />
Stockholm<br />
Peter Tuving<br />
Mäster Samuelsgatan 6, Box 1753<br />
111 87 Stockholm, Sweden<br />
(46) 8-440-5900<br />
Sydney<br />
Level 27, 259 George Street<br />
Sydney NSW 2000, Australia<br />
(61) 2-9255-9888<br />
Taipei<br />
Eddy Yang<br />
49F, Taipei 101 Tower<br />
No. 7, Xinyl Road, Sec 5<br />
Taipei, 11049, Taiwan<br />
(866) 2-8722-5800<br />
Tel Aviv<br />
Ronit Harel Ben Zeev<br />
12 Abba Hillel Silver Street<br />
Ramat-Gan 52506, Israel<br />
(972) 3-753-9703<br />
Tokyo<br />
Yu-Tsung Chang<br />
Marunouchi Kitaguchi Building<br />
27/28 Floor<br />
1-6-5 Marunouchi, Chiyoda-ku<br />
Tokyo, Japan 100-0005<br />
(81) 3-4550-8700<br />
Toronto<br />
Robert Palombi<br />
The Exchange Tower<br />
130 King Street West, Suite 1100<br />
P.O. Box 486<br />
Toronto, ON M5X1E5<br />
(1) 416-507-2529<br />
Ratings Information<br />
Call for ratings on all issues and issuers.<br />
Hong Kong<br />
Cherrie Chui<br />
(852) 2533-3516<br />
London<br />
Angela Barker<br />
(44) 20-7176-7401<br />
Madrid<br />
(34) 91-389-6969<br />
Melbourne<br />
(61) 1300-792-553<br />
Mexico City<br />
Ericka Alcantara<br />
(52) 55 5081-4427<br />
New York<br />
(1) 212-438-2400<br />
Paris<br />
Valerie Barata<br />
(33) 1-4420-6708<br />
Seoul<br />
J.T. Chae<br />
(82-2) 2022-2300<br />
Singapore<br />
Dowson Chan<br />
(65) 6530-6438<br />
Stockholm<br />
(46) 8-440-5900<br />
Tokyo<br />
(81) 3-4550-8711<br />
Fixed-Income Research<br />
Diane Vazza, New York<br />
(1) 212-438-2760<br />
Ratings Services<br />
Media Contacts<br />
Frankfurt<br />
Doris Keicher<br />
(49) 69-33-999-225<br />
Hong Kong<br />
Lisa Coory<br />
(852) 2533-3520<br />
London<br />
Matthew McAdam<br />
(44) 20-7176-3541<br />
Melbourne<br />
Sharon Beach<br />
(61) 3-9631-2152<br />
New York<br />
Fabienne Alexis<br />
(1) 212-438-7530<br />
Olayinka Fadahunsi<br />
(1) 212-438-5095<br />
Mimi Barker<br />
(1) 212-438-5054<br />
John Piecuch<br />
(1) 212-438-1579<br />
Jeff Sexton<br />
(1) 212-438-3448<br />
Edward Sweeney<br />
(1) 212-438-6634<br />
Paris<br />
Armelle Sens<br />
(33) 1-4420-6740<br />
Tokyo<br />
Kyota Narimatsu<br />
(81) 3-4550-8588<br />
Toronto<br />
Olayinka Fadahunsi<br />
(1) 212-438-5095<br />
Washington, D.C.<br />
David Wargin<br />
(1) 202-383-2298<br />
Seminar Programs<br />
Call for information on seminars<br />
and teleconferences.<br />
Hong Kong<br />
Virginia Lau<br />
(852) 2533-3500<br />
London<br />
Fleur Hollis<br />
(44) 20-7176-7218<br />
Melbourne<br />
Michelle Wang<br />
(61) 3-9631-2071<br />
New York<br />
Carla Cunningham<br />
(1) 212-438-6685<br />
Tokyo<br />
Toshiya Ishida<br />
(81) 3-4550-8683<br />
Subscriptions and<br />
Customer Service<br />
Call with questions on new or existing<br />
subscriptions to ratings publications<br />
and online products.<br />
Hong Kong<br />
(852) 2533-3535<br />
London<br />
(44) 20-7176-7425<br />
Melbourne<br />
Andrea Manson<br />
(61) 1300-792-553<br />
New York<br />
(1) 212-438-7280<br />
Singapore<br />
Amy Tan-Morel<br />
(65) 6239-6398<br />
Tokyo<br />
Minako Yoneyama<br />
(81) 3-4550-8711