

NUTRIENT INTAKE

You also want an ePaper? Increase the reach of your titles
YUMPU automatically turns print PDFs into web optimized ePapers that Google loves.
Appetite, 1997, 29, 11–24<br />
Meal Pattern and Nutrient Intake Among Adult Finns<br />
EVA ROOS and RITVA PRÄTTÄLÄ<br />
National Public Health Institute, Finland<br />
The purpose of this study was to investigate the relationship between meal pattern<br />
and diet. Nutrient contents of meals, snacks and other eating occasions were<br />
compared and differences in dietary intake analysed between respondents following<br />
a conventional meal pattern and others. A random sample of 1861 adults aged<br />
25–64 from four regions of Finland completed a mailed questionnaire and 3-day<br />
food record in the spring of 1992. A conventional meal pattern was defined on<br />
the basis of national dietary guidelines as including breakfast, warm lunch and<br />
warm dinner, and subjects were identified with the help of the questionnaire.<br />
Meals and snacks were defined according to the respondents subjective criteria.<br />
Forty-four percent of all respondents followed the conventional meal pattern.<br />
Meal pattern has no effect on nutrient intake in men and small effects in women.<br />
Women following the conventional meal pattern had higher energy and cholesterol<br />
intake and lower alcohol and vitamin C intake than other women. Meals<br />
contributed to energy, protein and fat intake, and snacks to sugar and alcohol.<br />
Meal pattern had only a small effect on diet and conventional meal pattern<br />
cannot be considered healthier than other meal patterns.<br />
© 1997 Academic Press Limited<br />
INTRODUCTION<br />
During this century the number of daily cooked meals has declined in Finland<br />
and other western countries. The main social factors promoting the meal pattern<br />
change have been urbanisation, industrialisation and the convenience provided by<br />
food processing (Rotenberg, 1981; Mintz, 1985; Prättälä & Helminen, 1990; Mennel,<br />
Murcott & van Otterloo, 1992; Prättälä, Pelto, Pelto, Ahola & Räsänen, 1993).<br />
There have been concerns expressed by the scientific community as well as the<br />
mass media about the rising consumption of snacks at the expense of “proper meals”.<br />
In public health studies skipping breakfast and eating snacks between meals have<br />
been classified as ‘‘bad’’ health habits (e.g. Belloc & Breslow, 1972; Segovia, Bartlett<br />
and Edwards, 1989; Sobal, Revicki & DeForge, 1992). Concern about the declining<br />
role of meals can even be seen in dietary recommendations. For example, the Swedish<br />
recommendations include a meal pattern (Standing Nordic Committee on Food,<br />
We are grateful to Dr Pirjo Pietinen, Head of the 1992 Dietary survey of Finnish Adults, M.Sc. Päivi<br />
Kleemola for checking the food records and analysing the dietary data and M.Sc. Jukka Lauronen for<br />
technical help.<br />
This work was supported by research grants from the Academy of Finland and the University of<br />
Helsinki.<br />
Correspondence should be addressed to: Eva Roos, National Public Health Institute, Department<br />
of Nutrition, Mannerheimintie 166, FIN-00300 Helsinki, Finland.<br />
0195–6663/97/040011+14 $25.00/0/ap960095 © 1997 Academic Press Limited
12 EVA ROOS AND RITVA PRÄTTÄLÄ<br />
1989): breakfast should provide you 1/4 of the daily energy intake, lunch and<br />
dinner both about 1/3, and the remainder should come from 1–2 snacks. Such<br />
recommendations are not based on scientific evidence, but on practical experience<br />
and the assumption that a regular pattern of warm meals guarantees a varied diet<br />
(Bruce, 1987; 1991; Standing Nordic Committee on Food, 1989). Although nutritional<br />
scientists have been worried about snacking patterns, especially among children and<br />
teenagers (Thomas & Call, 1973; Gillespie, 1983; McCoy et al., 1986; Dugdale,<br />
Townsend & Rigsby, 1988; Anderson, Macintyre and West, 1993; Cross, Babicz &<br />
Cushman, 1994) and obese (Birckbeck, 1981; Basdevant, Craplet and Guy-Grand,<br />
1993), meal patterns have received little attention in studies.<br />
A complication in meal pattern studies is that definitions of meals and snacks<br />
are not universal. In medical research, meals have been defined as any eating occasion<br />
(e.g. Franceschi, La Vecchia, Bidoli, Negri & Talamini, 1992; Fabry & Tepperman,<br />
1970) while in sociological studies a meal is regarded as a social event (see Mäkelä,<br />
1991, for review). In nutritional studies meals are usually defined by time, e.g.<br />
breakfast, lunch and dinner, and snacks as eating occasions between these meals<br />
(Pao & Mickle, 1981; Kennedy, Harrell & Frazao, 1982; Haraldsdottir, Holm, Jensen<br />
& Møller, 1987; Morgan, Johnson & Stampley, 1988; Virtanen, 1988; Ryan, Craig<br />
& Finns, 1992; Anderson et al., 1993; Prätälä et al., 1993; Roos, Quandt & DeWalt,<br />
1993; Summerbell, Moody, Shanks, Stock & Geissler, 1995). Time-based meal<br />
definitions can also be found in dietary recommendations (Standing Nordic Committee<br />
on Food, 1989). In some nutritional studies, however, meal definitions are<br />
based on the food and nutrient composition of eating occasions (Johansson, Callmer<br />
& Gustafsson, 1992; Lennernäs, Åkerstedt, Hagman, Bruce & Hambraeus, 1993;<br />
Rothenberg, Bosaeus, Steen, 1994).<br />
Because food is eaten as meals and snacks, not as single food items or nutrients,<br />
investigations of meal patterns have relevance for nutritional educators and food<br />
policy planners, as well as for multidisciplinary food research (Prättälä, 1991;<br />
Johansson et al., 1992; Holm, 1993). Since meals have social as well as nutritional<br />
significance, research on meals, by focusing on overlapping issues in the two fields,<br />
could narrow the gap between the social and nutritional sciences. In addition, dietary<br />
assessment methods could be improved by incorporating evaluations of meal patterns<br />
(Kohlmeier, 1994).<br />
The main question in the present study was: is a conventional meal pattern of<br />
breakfast, lunch and dinner healthier than other meal patterns including fewer meals?<br />
Nutrient contents of meals, snacks and other eating occasions of the study participants<br />
were compared, and the differences in dietary intake between those following a<br />
conventional three-meal daily pattern and those eating fewer meals were analysed.<br />
SUBJECTS AND METHODS<br />
Subjects<br />
The subjects and their recruitment have been described earlier (Kleemola, Virtanen<br />
& Pietinen, 1994; Roos, Ovaskainen & Pietinen, 1995a). Briefly, 1861 adults (991<br />
women and 870 men) who participated in a dietary survey in spring 1992 and had<br />
completed a 3-day food record were included in this study. The subjects were aged<br />
25–64 years and from four different regions of Finland; North Karelia (rural),
MEAL PATTERN AND <strong>NUTRIENT</strong> <strong>INTAKE</strong> AMONG ADULT FINNS<br />
13<br />
Kuopio (urban+rural), Turku-Loimaa (urban+rural) and Helsinki-Vantaa (urban).<br />
The original random sample was stratified by 10-year age groups, regions and sex.<br />
The response rate was 66% of the 2822 people contacted. Younger people, men and<br />
those who from the metropolitan area of Helsinki-Vantaa had lower response rates<br />
than others.<br />
Because our definition of a conventional meal pattern was time-based, we excluded<br />
160 shift workers (men 60, women 100) from the meal pattern analyses. We also<br />
excluded 12 subjects for missing values in the meal pattern question. Altogether,<br />
1689 subjects (801 men and 888 women) were used in the analyses of meal patterns.<br />
Questionnaire and 3-day Food Record<br />
All participants completed a mailed questionnaire before their study visit to a<br />
local health centre, where all answers were checked. In addition to several questions<br />
on socioeconomic status, health, smoking, alcohol intake and food habits (not<br />
reported here), the questionnaire included one question on meal pattern.<br />
During their examination on a weekday at the health centre, the participants<br />
were also asked to keep records of all the foods and beverages they consumed over<br />
the following three days. They were personally instructed on how to keep a food<br />
record starting the following morning. All days of the week were included in the<br />
results, with weekend days slightly over-represented. Amounts of food were estimated<br />
using a 63-page picture booklet or household measures. The record was open-ended<br />
and the subjects were asked to note the time, place (pre-coded) and company (precoded)<br />
of every eating occasion, and also to define each one as either a meal or a<br />
snack.<br />
Meal Patterns, Meals and Snacks<br />
The conventional meal pattern was defined by criteria outside this study. The<br />
definition was based on national dietary guidelines and recommendations for special<br />
population groups such as children, the elderly, sportsmen, and for hospital catering<br />
(National Board of Health, 1989; 1990; Ministry of Social Affairs and Health, 1992;<br />
1994). All these guidelines assume a meal pattern of 3 meals and 2–3 snacks during<br />
the day. A warm lunch and dinner are not recommended in every case, but a warm<br />
meal is considered more nutritious than a cold one. In our study the conventional<br />
meal pattern meant 3 meals during the day: breakfast, warm lunch, and warm dinner.<br />
The other meal pattern types were ‘‘2 meals per day’’ or ‘‘one meal or less per day’’.<br />
Subjects who had a conventional meal pattern were identified with the help of<br />
the mailed questionnaire. The question on meal pattern included in the questionnaire<br />
was structured into six time-based options: breakfast, snack in the morning, lunch,<br />
snack in the afternoon, dinner, and snack in the evening. For every eating occasion<br />
the subjects could choose between three pre-coded alternatives: 1. Do not eat, 2.<br />
Eat warm prepared food (including porridge) or 3. Eat something else—what? This<br />
question identified those who usually ate breakfast, warm lunch and warm dinner.<br />
Lunch and dinner was considered as a meal if the food eaten was warm. They<br />
were not defined by the type of food eaten at the eating occasion. This definition<br />
was used because of the structure of the meal pattern question. Breakfast was<br />
considered as a meal if 1. it was warm (e.g. porridge) or 2. the subject had something<br />
to eat (not just liquids) before 10 o’clock in the morning according to his/her food
14 EVA ROOS AND RITVA PRÄTTÄLÄ<br />
1200<br />
1000<br />
800<br />
Kjoule/hour<br />
600<br />
400<br />
200<br />
0<br />
0 2 4 6 8 10 12 14 16 18 20 22 24<br />
Time<br />
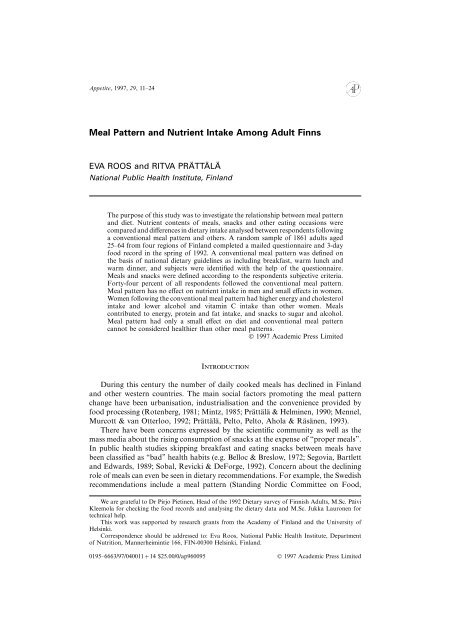
FIGURE 1.<br />
Distribution of energy intake during the day. Ε, men; Φ, women.<br />
record. Ten o’clock was chosen as the cut off point because it lay between the two<br />
energy peaks in the morning (Fig. 1). If the subject did not record breakfast against<br />
the meal pattern question, breakfast was not considered as a meal even if his/her<br />
food record indicated something eaten before 10 o’clock.<br />
Contrary to the definition of the conventional meal pattern, meals and snacks<br />
were defined according to the respondents subjective criteria. When keeping the food<br />
record the subjects were instructed to classify every eating occasion as either a meal<br />
or a snack. The respondents, however, were not able to classify all eating occasions,<br />
and the uncoded ones were called ‘‘other eating occasions’’ for the analyses.<br />
Dietary Analyses<br />
Daily intakes of nutrients and foods were computed from the 3 day food records<br />
using software developed at the National Public Health Institute and its food and<br />
nutrient data base (Ovaskainen, Lauronen & Haapakoski, 1994). The daily intakes<br />
of nutrients and food items were computed separately for meals, snacks and other<br />
eating occasions. Energy intake from different nutrients on an hourly basis through<br />
the day were also derived from the food records.<br />
Macronutrients, cholesterol, fibre, vitamin C, and carotenoids were analyzed as<br />
separate dietary items in order to form a general view of the quality of the diet.<br />
Cholesterol indicates the extent of animal sources, while fibre, vitamin C and<br />
carotenoids are good indicators of the consumption of vegetables, fruits and foods<br />
with high densities of other micronutrients. The macronutrient density of each type<br />
of eating occasion and the overall diet was measured as percentage of energy (E%);<br />
micronutrient and food item densities were measured as intake per 10 MJ.<br />
The food item classification used in this study was developed at the National<br />
Public Health Institute (Ovaskainen, 1992). The recorded items and dishes were
MEAL PATTERN AND <strong>NUTRIENT</strong> <strong>INTAKE</strong> AMONG ADULT FINNS<br />
15<br />
TABLE 1<br />
Percentage of men and women following different types of meal pattern according to<br />
age and region<br />
Three meals Two meals One meal per Total (N)<br />
per day per day day or less<br />
Men<br />
Age<br />
25–34 47 41 12 100 (167)<br />
35–44 49 44 7 100 (175)<br />
45–54 44 48 8 100 (208)<br />
55–64 46 50 4 100 (251)<br />
Region<br />
Helsinki-Vantaa (urban) 37 55 8 100 (186)<br />
Turku-Loimaa (urban+rural) 39 50 11 100 (213)<br />
Kuopio (urban+rural) 57 40 3 100 (212)<br />
North Karelia (rural) 52 42 6 100 (190)<br />
Men all 47 (371) 46 (372) 7 (58) 100 (801)<br />
Women<br />
Age<br />
25–34 41 51 8 100 (204)<br />
35–44 44 48 8 100 (213)<br />
45–54 39 56 5 100 (215)<br />
55–64 46 49 5 100 (256)<br />
Region<br />
Helsinki-Vantaa (urban) 29 59 12 100 (199)<br />
Turku-Loimaa (urban+rural) 35 55 10 100 (214)<br />
Kuopio (urban+rural) 51 47 2 100 (243)<br />
North Karelia (rural) 52 45 3 100 (232)<br />
Women all 42 (377) 51 (452) 7 (59) 100 (888)<br />
Total 44 (748) 49 (824) 7 (117) 100 (1689)<br />
grouped by their food use, processing and nutrient content into the food item groups<br />
presented in Table 5.<br />
Statistical Analyses<br />
The SAS statistical package (Release 6.08) was used for all analyses, which were<br />
carried out separately for men and women. All differences between eating occasions<br />
or meal pattern groups were tested by analysis of variance. The analyses of eating<br />
patterns were carried out in two different ways: firstly, intake and density of nutrients<br />
and food items were compared between meals and snacks; secondly, the daily intakes<br />
of nutrients and food items were compared between the groups following the<br />
conventional meal pattern or the other meal pattern. Because meal patterns were<br />
not equally distributed across the regions (Table 1) and because of the study design<br />
(sample stratified for age and region), all analyses where statistical significance was<br />
tested were adjusted for age and region.
16 EVA ROOS AND RITVA PRÄTTÄLÄ<br />
600<br />
Energy derived from fat kjoule/hour<br />
500<br />
400<br />
300<br />
200<br />
100<br />
0<br />
0 2 4 6 8 10 12 14 16 18 20 22 24<br />
Time<br />
FIGURE 2. Distribution of energy intake derived from fat during the day. Ε, men; Φ,<br />
women.<br />
RESULTS<br />
The distribution of energy intake during the day corresponded to the conventional<br />
3-meal pattern of one energy peak at breakfast time, one at lunch time and one at<br />
dinner time, for both men and women (Fig. 1). For the energy derived from fat,<br />
two peaks could be observed, one at lunch and one at dinner time, but a peak at<br />
breakfast time could only be observed for women (Fig. 2). The energy intake derived<br />
from sugar was evenly distributed from 6 a.m. to 9 p.m. (Fig. 3).<br />
About half the daily energy was obtained from meals (Table 2) and over 10% of<br />
the total daily energy intake came from eating occasions other than meals or snacks.<br />
Fat and protein intakes were associated with meals, whereas sugar and alcohol were<br />
mostly consumed in snacks and other eating occasions. Comparing nutrient densities<br />
of different eating occasions showed that meals contained more fat, proteins, fibre,<br />
carotenoids and cholesterol per energy unit, but less sugar, vitamin C and alcohol<br />
than other eating occasions (Table 3).<br />
The analysis of food items in different eating occasions showed that meals had<br />
a higher density of cereals and vegetables, and a lower density of fruit and berries,<br />
juices, coffee and tea, and desserts and cakes. As expected, meals had the highest<br />
density of cooked dishes, potatoes, pasta and rice, and snacks the lowest. Other<br />
eating occasions were intermediate in these respects and they included the highest<br />
proportions of juice, soft drinks, coffee and tea, candies and crisps.<br />
The distribution of meal patterns in different age groups and regions is shown<br />
in Table 1. The last two groups in Table 1 were combined in a further analysis of<br />
meal pattern into a single group ‘‘Other meal pattern’’ (2M), because of the few<br />
cases in the one meal group. Ninety two percent of the 2M-group ate breakfast,<br />
51% ate warm lunch and 46% ate warm dinner.
MEAL PATTERN AND <strong>NUTRIENT</strong> <strong>INTAKE</strong> AMONG ADULT FINNS<br />
17<br />
600<br />
Energy derived from sugar kjoule/hour<br />
500<br />
400<br />
300<br />
200<br />
100<br />
0<br />
0 2 4 6 8 10 12 14 16 18 20 22 24<br />
Time<br />
FIGURE 3. Distribution of energy intake derived from sugar during the day. Ε, men; Φ,<br />
women.<br />
TABLE 2<br />
Energy and nutrient intake from different eating occasions among 991 women and 870<br />
men<br />
Nutrients Meal Snack Other eating occasions Total<br />
Absolute (% of Absolute (% of Absolute (% of intake<br />
intake daily intake daily intake daily<br />
intake) intake) intake)<br />
Men<br />
Energy, kjoule 5 638 (55) 3 409 (32) 1 333 (13) 10 380<br />
Fat, g 56·1 (59) 29·2 (30) 10·1 (11) 95·3<br />
Saturated fat, g 25·0 (58) 13·9 (31) 4·1 (11) 43·7<br />
Carbohydrate, g 150 (51) 107 (36) 37 (13) 293<br />
Sugar, g 19·2 (34) 30·3 (50) 8·7 (16) 58·2<br />
Protein, g 62·7 (64) 24·9 (25) 10·2 (11) 98·2<br />
Alcohol, g 2·4 (20) 5·4 (40) 6·2 (40) 14·0<br />
Women<br />
Energy, kjoule 4 314 (55) 2 706 (34) 789 (11) 7 807<br />
Fat, g 41·8 (59) 22·3 (31) 6·6 (10) 71·1<br />
Saturated fat, g 18·5 (57) 11·0 (33) 3·1 (10) 32·6<br />
Carbohydrate, g 118 (50) 92 (39) 24 (11) 234<br />
Sugar, g 17·4 (35) 27·2 (53) 5·9 (12) 50·5<br />
Protein, g 48·0 (65) 18·8 (26) 6·8 (9) 73·9<br />
Alcohol, g 1·0 (24) 2·0 (48) 1·3 (28) 4·3
18 EVA ROOS AND RITVA PRÄTTÄLÄ<br />
TABLE 3<br />
Nutrient density of different eating occasions in 991 women and 870 men<br />
Density<br />
Nutrients In meals In snacks In other eating occasions<br />
Men<br />
Fat, E% 37·4∗ 30·9 22·8∗<br />
Saturated fat, E% 16·6∗ 14·8 10·6∗<br />
Carbohydrate, E% 45·2∗ 55·4 57·7<br />
Sugar, E% 5·6∗ 16·0 16·9<br />
Protein, E% 19·1∗ 12·1 10·6∗<br />
Alcohol, E% 1·3∗ 4·1 16·3∗<br />
Fibre, g/10 MJ 26·2∗ 21·9 18·6∗<br />
Vitamin C, mg/10 MJ 132∗ 172 183<br />
Carotenoids, mg/10 MJ 6·6∗ 2·8 3·6<br />
Cholesterol, mg/10 MJ 462∗ 316 239∗<br />
Women<br />
Fat, E% 36·5∗ 29·7 25·2∗<br />
Saturated fat, E% 16·1∗ 14·6 11·9∗<br />
Carbohydrate, E% 46·7∗ 59·3 57·0∗<br />
Sugar, E% 6·6∗ 16·9 18·2∗<br />
Protein, E% 19·2∗ 11·8 12·0<br />
Alcohol, E% 0·6∗ 2·0 6·7∗<br />
Fibre, g/10 MJ 27·8∗ 25·3 24·0<br />
Vitamin C, mg/10 MJ 181∗ 244 246<br />
Carotenoids, mg/10 MJ 9·3∗ 4·0 7·4∗<br />
Cholesterol, mg/10 MJ 449∗ 303 285<br />
∗ Starred density values are significantly different to snack density values (p
MEAL PATTERN AND <strong>NUTRIENT</strong> <strong>INTAKE</strong> AMONG ADULT FINNS<br />
19<br />
TABLE 4<br />
Daily intake of energy and nutrients by meal pattern of 888 women and 801 men<br />
Nutrients Conventional Other meal Δ 3M–2M, p-value,<br />
meal pattern pattern adjusted for adjusted for<br />
(3M), (2M), age and age and<br />
unadjusted unadjusted region region<br />
Men (N=371) (N=430)<br />
Kjoule 10656 10142 316 0·14<br />
Kcal 2548 2425 76 0·14<br />
Fat, E% 34·3 34·8 −0·2 0·60<br />
Saturated fat, E% 15·6 15·8 −0·2 0·48<br />
Carbohydrate, E% 48·9 47·6 0·8 0·15<br />
Sugar, E% 9·1 9·6 −0·6 0·09<br />
Protein, E% 16·5 16·1 0·4 0·10<br />
Alcohol, E% 3·4 4·4 −0·8 0·07<br />
Fibre g/10 MJ 24·8 23·2 0·9 0·08<br />
Vitamin C mg/10 MJ 134 136 0·4 0·94<br />
Carotenoids mg/10 MJ 4·8 4·7 0·2 0·35<br />
Cholesterol mg/10 MJ 399 394 10 0·32<br />
Women (N=377) (N=511)<br />
Kjoule 8107 7554 529 0·0003<br />
Kcal 1938 1807 126 0·0003<br />
Fat, E% 33·8 34·4 −0·2 0·60<br />
Saturated fat, E% 15·6 15·8 −0·03 0·90<br />
Carbohydrate, E% 51·7 50·5 0·6 0·27<br />
Sugar, E% 10·4 10·5 −0·2 0·49<br />
Protein, E% 16·5 16·3 0·2 0·40<br />
Alcohol, E% 1·2 1·9 −0·5 0·03<br />
Fibre g/10 MJ 26·8 25·7 0·5 0·36<br />
Vitamin C mg/10 MJ 184 201 −17 0·03<br />
Carotenoids mg/10 MJ 6·6 7·2 −0·3 0·33<br />
Cholesterol mg/10 MJ 399 385 17 0·05<br />
DISCUSSION<br />
Fewer than half the subjects followed the conventional meal pattern model used<br />
in dietary guidelines. About half those who did not follow this pattern skipped lunch<br />
and about half dinner, while breakfast was normally not skipped. The distribution<br />
of meal patterns we found corresponds well with data from a study of women in<br />
Helsinki, in which 47% ate breakfast, lunch and dinner, 27% skipped lunch and 25%<br />
skipped dinner (Prättälä et al., 1993).<br />
More than 10% of the energy intake in the present study came from the uncoded<br />
‘‘other eating occasions’’. These seemed to be partly missing entries and partly<br />
occasions when subjects were simply unable to code as either meals or snacks. In<br />
the earlier meal pattern study in Helsinki, snacks never included prepared or cooked<br />
food (Prättälä et al., 1993). The density of cooked food in ‘‘other eating occasions’’<br />
lay between those of meals and snacks; which suggests that some of the responses<br />
classified as ‘‘other eating occasions’’ were actually missing entries. The densities of<br />
beverages and typical snack foods like candies and crisps were highest for other<br />
eating occasions; maybe eating occasions that generally were not regarded as meals
20 EVA ROOS AND RITVA PRÄTTÄLÄ<br />
TABLE 5<br />
Daily intake of foods by meal pattern of 888 women and 801 men<br />
Food items g/10 MJ Conventional Other meal Δ 3M–2M, p-value<br />
meal pattern pattern adjusted for adjusted for<br />
(3M), (2M), age and age and<br />
unadjusted unadjusted region region<br />
Men (N=371) (N=430)<br />
Milk 359 345 1 0·96<br />
Cereals 95 68 26 0·001<br />
Bread 167 151 10 0·05<br />
Cheese 28 31 −2 0·42<br />
Cooked dishes 387 366 24 0·05<br />
Potatoes, pasta and rice 154 142 17 0·02<br />
Cooked vegetables 22 23 0 0·90<br />
Fresh vegetables 71 65 9 0·10<br />
Desserts and cakes 160 145 9 0·28<br />
Fruit & berries 155 174 −13 0·25<br />
Juices 135 125 5 0·71<br />
Coffee and tea 543 627 −83 0·0005<br />
Sweet and salty snacks 37 43 −6 0·13<br />
Women (N=377) (N=511)<br />
Milk 373 303 57 0·002<br />
Cereals 123 81 33 0·0002<br />
Bread 144 138 3 0·50<br />
Cheese 37 47 −7 0·005<br />
Cooked dishes 383 364 14 0·22<br />
Potatoes, pasta and rice 135 117 21 0·002<br />
Cooked vegetables 34 34 1 0·83<br />
Fresh vegetables 104 114 −2 0·75<br />
Desserts and cakes 207 189 8 0·40<br />
Fruit & berries 241 288 −45 0·0006<br />
Juices 147 147 −5 0·69<br />
Coffee and tea 639 733 −86 0·002<br />
Sweet and salty snacks 43 54 −11 0·005<br />
or snacks were not coded at all. It may have been difficult for subjects to code eating<br />
occasions as only meals or snacks; perhaps more pre-coded alternatives in the good<br />
record, e.g. drinks, would have decreased the frequency of uncoded eating occasions.<br />
Meals contributed to more than half of the daily energy and therefore retained<br />
their importance over snacks or other eating occasions during the day. However,<br />
the proportion of energy intake derived from meals (55%) was lower than that found<br />
in British and North American studies (Kennedy et al., 1982; Summerbell et al., 1995)<br />
and what was recommended in the Swedish nutrition and food recommendations<br />
(Standing Nordic Committee on Food, 1989). Uncoded eating occasions were quite<br />
commonly reported in our study, and probably some of the energy involved was<br />
actually derived from uncoded meals. Another possible reason why meals in Finland<br />
provided less of the daily energy intake than in the U.K. and U.S.A. is cultural<br />
differences in meal pattern or in defining eating occasions. The meaning of the words<br />
meal and snack might be different in Finland compared to their everyday use in the<br />
English language. For example, what is in this study meant by ‘‘meal’’ might be
MEAL PATTERN AND <strong>NUTRIENT</strong> <strong>INTAKE</strong> AMONG ADULT FINNS<br />
21<br />
better translated into English as a ‘‘proper meal’’ (Prättälä et al., 1993) and what is<br />
in this study meant by ‘‘snack’’ might be better translated into ‘‘sandwich meal’’.<br />
Also lay people and nutritional educators seemed to define eating occasions, especially<br />
breakfast, differently. Moreover, the studies themselves applied different methodologies<br />
and meal definitions.<br />
Meals contribute to protein and fat intake and snacks to sugar and alcohol<br />
intake. The macronutrient density (alcohol excluded) in the present study compares<br />
favourably with data from Virtanen (1988), who looked at the nutrient density in<br />
meals and snacks of Finnish adolescents. The only exception was the higher content<br />
of sugar among the young people’s snacks. Previous researchers have also found<br />
snacks to be higher in carbohydrate and sugar densities, and lower in protein and<br />
fat compared with meals (Pao & Mickle, 1981; Kennedy et al., 1982; McCoy et al.,<br />
1986; Summerbell et al., 1995). Differences in nutrient densities of meals and snacks<br />
can be explained in terms of food densities. In Finland cooked dishes are a primary<br />
source of fat (Roos, Kleemola & Pietinen, 1995b), so the high density of cooked<br />
dishes explains partly the high fat contribution of meals. The high consumption of<br />
vegetables during meals explains the high intake of carotenoids, and the high<br />
consumption of fruits, berries, desserts and cakes during snacks the high intake of<br />
sugars and vitamin C. Fruits, berries and fruit juices consumed as snacks seem to<br />
be more common in Finland than in the U.S.A. because we found a higher vitamin<br />
C density in snacks than meals, in contrast to the U.S.A. (Thomas & Call, 1973;<br />
Kennedy et al., 1982; McCoy et al., 1986).<br />
Findings of earlier studies in young people that snacks contribute far more than<br />
just ‘‘empty calories’’ (Thomas & Call, 1973; McCoy et al., 1986) are confirmed<br />
among adults by our findings. In fact, the fat density of snacks in our study was<br />
closer to the national recommendations (National Nutrition Council, 1989) than<br />
that of the meals. On the other hand, the sugar and fibre densities of meals were<br />
closer to the recommendations than those of snacks. Nutrient densities of snacks<br />
and meals are different and we find favourable and less favourable ‘‘components’’<br />
in both meals and snacks.<br />
The results of this study suggest, that meal pattern had only a small effect on<br />
diet and that meal pattern did not influence the healthfulness of the diet. Meal<br />
pattern had no effect on nutrient intake in men, but some effect in women; alcohol<br />
and vitamin C intakes were lower and cholesterol intake higher among women<br />
following the conventional meal pattern. Even though the differences between the<br />
meal pattern groups in women were significant, they were not large, and it is<br />
impossible to state that one meal pattern group had a more healthy diet than the<br />
others. The response rate in this study was 66% and those who answered the<br />
questionnaire had probably a healthier lifestyle than those who did not. It is possible<br />
that an association between meal pattern and the quality of diet existed in the entire<br />
population, but was not observed in this study due to selection bias. It is also<br />
possible that only a very irregular meal pattern (no warm meals daily) lowers the<br />
nutrient quality of diet. Finns eating very irregularly, i.e., less than two meals per<br />
day were too few for statistical analysis. A larger number of respondents would<br />
probably have permitted significant differences to emerge between this group and<br />
the others.<br />
Although meal pattern had no effect, or only a minor one, on nutrient intake, it<br />
had more influence on food intake. The intakes of cereals (porridge), potatoes, rice<br />
and pasta, and cooked dishes were higher and those of cheese, fruits and berries,
22 EVA ROOS AND RITVA PRÄTTÄLÄ<br />
sweet and salty snacks, and coffee and tea lower among those who followed the<br />
conventional meal pattern. Generally, the diet of the conventional meal pattern<br />
eaters seemed to be more traditional than that of the others, but did not differ in<br />
nutrient content from the more modern food pattern. The lower coffee and tea<br />
consumption among followers of the conventional meal pattern was expected; earlier<br />
studies have shown that warm and prepared meals have been replaced by coffee and<br />
tea (Mintz, 1985; Prättälä & Helminen, 1990).<br />
Today, the traditional assumption of a three meal pattern is true for less than<br />
half the population. We need new meal models in dietary guidelines which correspond<br />
better to daily meal patterns. The conventional three-meal pattern promoted in<br />
dietary recommendations seems not to be sufficiently relevant for encouraging a<br />
more nutritious diet. A healthy diet is possible both for those who follow the<br />
conventional meal pattern and for those who eat fewer meals per day. Both dietary<br />
guidelines and educators should place more emphasis on eating occasions. For<br />
example, it is more relevant to focus on meals when trying to decrease fat intake,<br />
and on snacks when sugar is the target.<br />
This study was not able to examine those with a very irregular meal pattern. The<br />
irregular meal pattern group was too small for further analysis in the present study.<br />
An irregular meal pattern could probably affect the daily nutrient intake. Other<br />
‘‘bad’’ lifestyle habits such as smoking and low physical activity may also be more<br />
common among those who eat irregularly. Unfortunately, this group of people is<br />
difficult to reach by mailed questionnaires and more likely to be found among study<br />
non-attenders. Other approaches and methods should be used to identify the irregular<br />
meal pattern group and to analyse associations between life style, irregular eating<br />
and nutrient intakes.<br />
REFERENCES<br />
Anderson, A. S., Macintyre, S. & West, P. (1993). Adolescent meal patters: grazing habits in<br />
the west of Scotland. Health Bulletin, 51, 158–165.<br />
Basdevant, A., Craplet, C. & Guy-Grand, B. (1993). Snacking patterns in obese French<br />
women. Appetite, 21, 17–23.<br />
Belloc, N. B. & Breslow, L. (1972). Relationship of physical health status and health practices.<br />
Preventive Medicine, 1, 409–421.<br />
Birkbeck, J. A. (1981). Obesity, socioeconomic variables and eating habits in New Zealand.<br />
Journal of Biosocial Science, 13, 299–307.<br />
Bruce, Å. (1987). Måltidsordning (Meal pattern). Vårföda, 6, 244–246.<br />
Bruce, Å. (1991). Inledning (Introduction). In Måltiden och måltidsordningen (Meal and meal<br />
pattern). p. 5–7. Forskningsrådsnämnden. Report 91:3.<br />
Cross, A. T., Babicz, D. & Cushman, L. F. (1994). Snacking patterns among 1,800 adults and<br />
children. Journal of American Dietetic Association, 94, 1398–1403.<br />
Dugdale, A. E., Townsend, B. & Rigsby, B. (1988). The eating and snacking patterns of young<br />
people in Brisbane, Australia. Journal of Human Nutrition and Dietetics, 1, 95–104.<br />
Fabry, P. & Tepperman, J. (1970). Meal frequency—a possible factor in human pathology.<br />
American Journal of Clinical Nutrition, 23, 1059–1068.<br />
Franceschi, S., La Vecchia, C., Bidoli, E., Negri, E. & Talamini R. (1992). Meal frequency<br />
and risk of colorectal cancer. Cancer Research, 52, 3589–3592.<br />
Gillespie, A. (1983). Assessing snacking behavior of children. Ecology of Food and Nutrition,<br />
13, 167–172.<br />
Haraldsdottir, J., Holm, L., Jensen, J. H. & Møller, A. (1989). Danskernes kostvaner 2. Hvem<br />
spiser hvad? (Danish food habits 2, who is eating what?) Denmark: LST, 154.
MEAL PATTERN AND <strong>NUTRIENT</strong> <strong>INTAKE</strong> AMONG ADULT FINNS<br />
23<br />
Holm, L. (1993). Cultural and social acceptability of a healthy diet. European Journal of<br />
Clinical Nutrition, 47, 592–599.<br />
Johansson, G., Callmer, E. & Gustafsson, J.-Å. (1992). Changing from a mixed diet to a<br />
Scandinavian vegetarian diet: effects on nutrient intake, food choice, meal pattern and<br />
cooking methods. European Journal of Clinical Nutrition, 46, 707–716.<br />
Kennedy, E. T., Harrell, M. W. & Frazao, B. (1982). Distribution of nutrient intake across<br />
meals in the United States Population. Ecology of Food and Nutrition, 11, 225–233.<br />
Kleemola, P., Virtanen, M. I. & Pietinen, P. (1994). The 1992 Dietary Survey of Finnish Adults.<br />
Publications of the National Public Health Institute B2/1994. Helsinki.<br />
Kohlmeier, L. (1994). Gaps in dietary assessment methodology: meal- vs. list-based methods.<br />
American Journal of Clinical Nutrition, 59 (suppl), 175–9.<br />
Lennernäs, M. A.-C., Åkerstedt, T., Hagman, U., Bruce, Å. & Hambraeus, L. (1993). A new<br />
approach for evaluation of meal quality and meal patterns. Journal of Human Nutrition<br />
and Dietetics, 6, 261–273.<br />
McCoy, H., Moak, S., Kenney, M. A., Kirby, A., Chopin, L., Billon, W., Clark, A., Disney,<br />
G., Ercanli, F. G., Glover, E., Korslund, M., Lewi, H., Ritchey, J., Schilling, P., Shoffner,<br />
S. & Wakefield, T. Jr. (1986). Snacking patterns and nutrient density of snacks consumed<br />
by southern girls. Journal of Nutrition Education, 18, 61–66.<br />
Mennel, S., Murcott, A. & van Otterloo, A. H. (1992). The Sociology of Food: Eating, Diet<br />
and Culture. SAGE Publications, London.<br />
Ministry of Social Affairs and Health. (1992). Dietary guidelines for elderly (in Finnish).<br />
Publications of Ministry of Social Affairs and Health 12/92. Helsinki.<br />
Ministry of Social Affairs and Health. (1994). Dietary guidelines for hospital catering (in<br />
Finnish). Publications of Ministry of Social Affairs and Health 1994:2. Helsinki.<br />
Mintz, S. (1985). Sweetness and power. The place of Sugar in Modern History. New York:<br />
Viking.<br />
Morgan, K. J., Johnson, S. R. & Stampley, G. L. (1988). Relationship between snack and<br />
meal consumption. Nutrition Research, 8, 703–716.<br />
Mäkelä, J. (1991). Defining a meal. In: Fürst, E. L., Prättälä, R., Ekström, M., Holm, L. &<br />
Kjærnes, U. (Eds), Palatable worlds: sociocultural food studies. Pp. 87–108. Oslo: Solum<br />
Forlag A/S.<br />
National Board of Health. (1989). Child, family and diet (in Finnish). Publications of the<br />
National Board of Health, Finland. Series statistics and reviews 7/1989. Helsinki.<br />
National Board of Health. (1990). Dietary guidelines for sportsmen (in Finnish). Publications<br />
of the National Board of Health, Finland. Series statistics and reviews 5/1990. Helsinki.<br />
National Nutrition Council. (1989). Dietary Guidelines and their scientific principles. Résumé<br />
of the committee report 1987:3. Helsinki: Government Printing Centre. 55 pp.<br />
Ovaskainen, M.-L. (1992). The diet of male smokers, its structure and associations with health<br />
status (in Finnish). English summary. Publications of the National Public Health Institute<br />
A9/1992. Helsinki.<br />
Ovaskainen, M.-L., Lauronen, J. & Haapakoski, J. (1994). Epidemiological food and nutrient<br />
database at the National Public Health Institute. Scandinavian Journal of Nutrition,<br />
Supplement No 29 (Advances in Nutrition Research 10-Year Anniversary Symposium of<br />
the Department of Clinical Nutrition), 38, 10.<br />
Pao, E. M. & Mickle, S. J. (1981). Nutrients from meals and snacks consumed by individuals.<br />
Family Economics Review, Summer 1981, 9–15.<br />
Prättälä, R. & Helminen, P. (1990). Finnish meal patterns. In: Somogyi, J. C. & Koskinen,<br />
E. H., (Eds), Nutritional adaptation to new life-styles. Bibl Nutr Dieta, 45, Pp. 80–91.<br />
Basel, Karger.<br />
Prättälä, R. (1991). Outlining multidisciplinary food research. In: Fürst, E. L., Prättälä, R.,<br />
Ekström, M., Holm, L. & Kjærnes, U. (Eds), Palatable worlds: sociocultural food studies.<br />
Pp. 17–31. Oslo: Solum Forlag A/S.<br />
Prättälä, R., Pelto, G., Pelto, P., Ahola, M. & Räsänen, L. (1993). Continuity and chance in<br />
meal patterns: the case of urban Finland. Ecology of Food and Nutrition, 31, 87–100.<br />
Roos, E., Ovaskainen, M.-L. & Pietinen, P. (1995a). Validity and comparison of three saturated<br />
fat indices. Scandinavian Journal of Nutrition, 39, 55–59.<br />
Roos, E., Kleemola, P. & Pietinen, P. (1995b). Tyydyttyneen rasvan lähteet eri väestöryhmien<br />
ravinnossa (Diet and sources of saturated fat in different socioeconomic classes). Suomen<br />
Lääkärilehti, 50, 1735–1739.
24 EVA ROOS AND RITVA PRÄTTÄLÄ<br />
Roos, G. M., Quandt, S. A. & DeWalt, K. M. (1993). Meal patterns of the elderly in rural<br />
Kentucky. Appetite, 21, 295–298.<br />
Rotenberg, R. (1981). The impact of industrialization on meal patterns in Vienna, Austria.<br />
Ecology of Food and Nutrition, 11, 25–35.<br />
Rothenberg, E., Bosaeus, I. & Steen, B. (1994). Food habits, food beliefs and socio-economic<br />
factors in an elderly population. Scandinavian Journal of Nutrition, 38, 159–165.<br />
Ryan, A. S., Craig, L. D. & Finns, S. C. (1992). Nutrient intakes and dietary patterns of<br />
older Americans: A national study. Journal of Gerontology, 47, M145–M150.<br />
Segovia, J., Bartlett, R., F. & Edwards, A. C. (1989). The association between self-assessed<br />
health status and individual health practices. Canadian Journal of Public Health, 80,<br />
32–37.<br />
Sobal, J., Revicki, D. & DeForge, B. R. (1992). Patterns of interrelationships among healthpromotion<br />
behaviors. American Journal of Preventive Medicine, 8, 351–359.<br />
Standing Nordic Committee on Food. (1989). Nordic Nutrition Recommendations. 2nd ed.<br />
Copenhagen: Nordic Council of Minister.<br />
Summerbell, C. D., Moody, R. C., Shanks, J., Stock, M. J. & Geissler, C. (1995). Sources of<br />
energy from meals versus snacks in 220 people in four age groups. European Journal of<br />
Clinical Nutrition, 49, 33–41.<br />
Thomas, J. A. & Call, D. L. (1973). Eating between meals—a nutrition problem among<br />
teenagers. Nutrition Reviews, 31, 137–139.<br />
Virtanen, S. (1988). Meal pattern and composition of the diet of Finnish adolescent diabetics<br />
and non-diabetic controls. Näringsforskning, 32, 9–13.<br />
Received 26 February 1996, revision 25 April 1996