- Page 2 and 3:
Turning the Improbable Into the Exc
- Page 4 and 5:
Page 4 of 140
- Page 6 and 7:
Page 6 of 140
- Page 8 and 9:
6. 1 We disseminate Quarterly publi
- Page 10 and 11:
Page 10 of 140
- Page 12 and 13:
Page 12 of 140
- Page 14 and 15:
23 “His master replied, ‘Well d
- Page 16 and 17:
Page 16 of 140
- Page 18 and 19:
Domini, shareholder advocacy and co
- Page 20 and 21:
Two good things came out this resea
- Page 22 and 23:
Fund Azzad Ethical Mid Cap Fund Bri
- Page 24 and 25:
Fund Fund A Praxis Growth Index Fun
- Page 26 and 27:
development in the US, or are made
- Page 28 and 29:
concern, and submitting and voting
- Page 30 and 31:
sustain land trusts, to a meeting o
- Page 32 and 33:
Page 32 of 140
- Page 34 and 35:
that are often excluded from market
- Page 36 and 37:
Some organisations that have used S
- Page 38 and 39:
it helps identify the critical sour
- Page 40 and 41:
Page 40 of 140
- Page 42 and 43:
and shareholder trust through posit
- Page 44 and 45:
Approaches Some commentators have i
- Page 46 and 47:
Wieland and Handfield (2013) sugges
- Page 48 and 49:
EthicalQuote (CEQ) tracks reputatio
- Page 50 and 51:
Displaying commitment to CSR is one
- Page 52 and 53:
Brand Differentiation CSR can help
- Page 54 and 55:
takes health and safety, diversity
- Page 56 and 57:
advance with the practice of CSR wh
- Page 58 and 59:
Stakeholder Influence One motivatio
- Page 60 and 61:
Regulation Fifteen European Union c
- Page 62 and 63:
jurisdictions. E.g., some jurisdict
- Page 64 and 65:
"Impact investments can be made in
- Page 66 and 67:
venture capital community. Investor
- Page 68 and 69:
countries via local intermediaries.
- Page 70 and 71:
determining views of affected commu
- Page 72 and 73:
Another measure of economic impact
- Page 74 and 75:
Page 74 of 140
- Page 76 and 77:
The Board for the CCEG was to inclu
- Page 78 and 79:
17 Love Relationship Online dating
- Page 80 and 81:
Social Value Act 2012 legislation.
- Page 82 and 83:
Development released a report outli
- Page 84 and 85:
Benefits and Costs of Social Impact
- Page 86 and 87:
UK On 18 March 2010, Secretary of S
- Page 88 and 89:
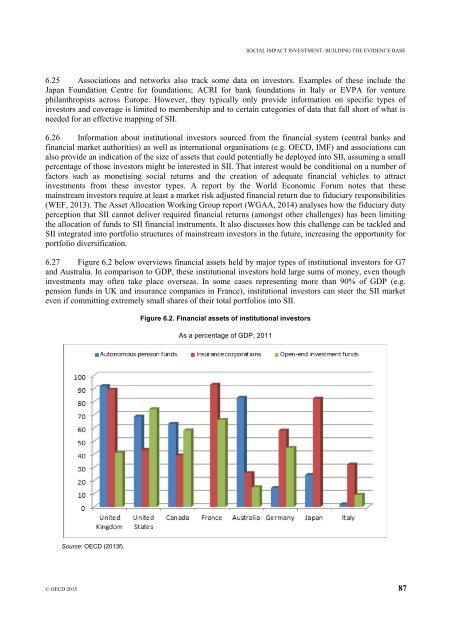
US Massachusetts: The second of two
- Page 90 and 91:
US Federal: The U.S. Department of
- Page 92 and 93:
would establish a five-year pilot p
- Page 94 and 95:
We are dedicated to finding ways to
- Page 96 and 97:
In the past, public monies have oft
- Page 98 and 99:
indicate that more Americans want t
- Page 100 and 101:
Youth" to "Opportunity Youth" in or
- Page 102 and 103:
income must file a Form 990. The fo
- Page 104 and 105:
In its first three years, SIF has a
- Page 106 and 107:
The Office of Social Innovation pri
- Page 108 and 109:
of Management at UCLA; and launched
- Page 110 and 111:
Page 110 of 140
- Page 112 and 113:
Notes _____________________________
- Page 114 and 115:
Page 114 of 140
- Page 116 and 117:
Investing for Impact Case Studies A
- Page 118 and 119:
Contents What is Impact Investment?
- Page 120 and 121:
What is Impact Investment? Impact I
- Page 122 and 123:
A case study approach in an asset a
- Page 124 and 125:
Segments of Impact Investors High T
- Page 126 and 127:
Foundations Like high net worth ind
- Page 128 and 129:
in the developed and the developing
- Page 130 and 131:
By creating mechanisms through whic
- Page 132 and 133:
Asset Allocation Framework Asset cl
- Page 134 and 135:
Cash Shorebank Deposit Program fina
- Page 136 and 137:
Mezzanine/Quasi Equity Instruments
- Page 138 and 139:
Venture Capital Bridges Ventures CD
- Page 140 and 141:
Real Estate JP Morgan Urban Renaiss
- Page 142 and 143:
absolute return (hedge funds) BelAi
- Page 144 and 145:
senior debt Root Capital Impact Fir
- Page 146 and 147:
Venture Capital Aavishkaar Impact F
- Page 148 and 149:
eal estate Ignia Impact First Inves
- Page 150 and 151:
senior debt Root Capital Layered St
- Page 152 and 153:
The New York City Acquisition Fund
- Page 154 and 155:
Appendix Methodology The Investing
- Page 156 and 157:
Websites •• Bridges Ventures: h
- Page 158 and 159:
Cash Quasi Equity Public Equity Buy
- Page 160 and 161:
Page 116 of 140
- Page 164 and 165:
SOCIAL IMPACT INVESTMENT: BUILDING
- Page 166 and 167:
SOCIAL IMPACT INVESTMENT: BUILDING
- Page 168 and 169:
SOCIAL IMPACT INVESTMENT: BUILDING
- Page 170 and 171:
SOCIAL IMPACT INVESTMENT: BUILDING
- Page 172 and 173:
SOCIAL IMPACT INVESTMENT: BUILDING
- Page 174 and 175:
SOCIAL IMPACT INVESTMENT: BUILDING
- Page 176 and 177:
SOCIAL IMPACT INVESTMENT: BUILDING
- Page 178 and 179:
SOCIAL IMPACT INVESTMENT: BUILDING
- Page 180 and 181:
SOCIAL IMPACT INVESTMENT: BUILDING
- Page 182 and 183:
SOCIAL IMPACT INVESTMENT: BUILDING
- Page 184 and 185:
SOCIAL IMPACT INVESTMENT: BUILDING
- Page 186 and 187:
SOCIAL IMPACT INVESTMENT: BUILDING
- Page 188 and 189:
SOCIAL IMPACT INVESTMENT: BUILDING
- Page 190 and 191:
SOCIAL IMPACT INVESTMENT: BUILDING
- Page 192 and 193:
SOCIAL IMPACT INVESTMENT: BUILDING
- Page 194 and 195:
SOCIAL IMPACT INVESTMENT: BUILDING
- Page 196 and 197:
SOCIAL IMPACT INVESTMENT: BUILDING
- Page 198 and 199: SOCIAL IMPACT INVESTMENT: BUILDING
- Page 200 and 201: SOCIAL IMPACT INVESTMENT: BUILDING
- Page 202 and 203: SOCIAL IMPACT INVESTMENT: BUILDING
- Page 204 and 205: SOCIAL IMPACT INVESTMENT: BUILDING
- Page 206 and 207: SOCIAL IMPACT INVESTMENT: BUILDING
- Page 208 and 209: SOCIAL IMPACT INVESTMENT: BUILDING
- Page 210 and 211: SOCIAL IMPACT INVESTMENT: BUILDING
- Page 212 and 213: SOCIAL IMPACT INVESTMENT: BUILDING
- Page 214 and 215: SOCIAL IMPACT INVESTMENT: BUILDING
- Page 216 and 217: SOCIAL IMPACT INVESTMENT: BUILDING
- Page 218 and 219: SOCIAL IMPACT INVESTMENT: BUILDING
- Page 220 and 221: SOCIAL IMPACT INVESTMENT: BUILDING
- Page 222 and 223: SOCIAL IMPACT INVESTMENT: BUILDING
- Page 224 and 225: SOCIAL IMPACT INVESTMENT: BUILDING
- Page 226 and 227: SOCIAL IMPACT INVESTMENT: BUILDING
- Page 228 and 229: SOCIAL IMPACT INVESTMENT: BUILDING
- Page 230 and 231: SOCIAL IMPACT INVESTMENT: BUILDING
- Page 232 and 233: SOCIAL IMPACT INVESTMENT: BUILDING
- Page 234 and 235: SOCIAL IMPACT INVESTMENT: BUILDING
- Page 236 and 237: SOCIAL IMPACT INVESTMENT: BUILDING
- Page 238 and 239: SOCIAL IMPACT INVESTMENT: BUILDING
- Page 240 and 241: SOCIAL IMPACT INVESTMENT: BUILDING
- Page 242 and 243: SOCIAL IMPACT INVESTMENT: BUILDING
- Page 244 and 245: SOCIAL IMPACT INVESTMENT: BUILDING
- Page 246 and 247: SOCIAL IMPACT INVESTMENT: BUILDING
- Page 250 and 251: SOCIAL IMPACT INVESTMENT: BUILDING
- Page 252 and 253: SOCIAL IMPACT INVESTMENT: BUILDING
- Page 254 and 255: SOCIAL IMPACT INVESTMENT: BUILDING
- Page 256 and 257: SOCIAL IMPACT INVESTMENT: BUILDING
- Page 258 and 259: SOCIAL IMPACT INVESTMENT: BUILDING
- Page 260 and 261: SOCIAL IMPACT INVESTMENT: BUILDING
- Page 262 and 263: SOCIAL IMPACT INVESTMENT: BUILDING
- Page 264 and 265: SOCIAL IMPACT INVESTMENT: BUILDING
- Page 266 and 267: SOCIAL IMPACT INVESTMENT: BUILDING
- Page 268 and 269: SOCIAL IMPACT INVESTMENT: BUILDING
- Page 270 and 271: SOCIAL IMPACT INVESTMENT: BUILDING
- Page 273 and 274: SOCIAL IMPACT INVESTMENT: BUILDING
- Page 275 and 276: SOCIAL IMPACT INVESTMENT: BUILDING
- Page 277 and 278: SOCIAL IMPACT INVESTMENT: BUILDING
- Page 279 and 280: SOCIAL IMPACT INVESTMENT: BUILDING
- Page 281 and 282: SOCIAL IMPACT INVESTMENT: BUILDING
- Page 283 and 284: SOCIAL IMPACT INVESTMENT: BUILDING
- Page 285 and 286: SOCIAL IMPACT INVESTMENT: BUILDING
- Page 287 and 288: SOCIAL IMPACT INVESTMENT: BUILDING
- Page 289 and 290: SOCIAL IMPACT INVESTMENT: BUILDING
- Page 291 and 292: SOCIAL IMPACT INVESTMENT: BUILDING
- Page 293 and 294: SOCIAL IMPACT INVESTMENT: BUILDING
- Page 295 and 296: SOCIAL IMPACT INVESTMENT: BUILDING
- Page 297 and 298: SOCIAL IMPACT INVESTMENT: BUILDING
- Page 299 and 300:
Page 118 of 140
- Page 301 and 302:
Global Research 29 November 2010 Im
- Page 303 and 304:
Impact Investments: An emerging ass
- Page 305 and 306:
Impact Investments: An emerging ass
- Page 307 and 308:
Impact Investments: An emerging ass
- Page 309 and 310:
Impact Investments: An emerging ass
- Page 311 and 312:
Impact Investments: An emerging ass
- Page 313 and 314:
Impact Investments: An emerging ass
- Page 315 and 316:
Impact Investments: An emerging ass
- Page 317 and 318:
Impact Investments: An emerging ass
- Page 319 and 320:
Impact Investments: An emerging ass
- Page 321 and 322:
Impact Investments: An emerging ass
- Page 323 and 324:
Impact Investments: An emerging ass
- Page 325 and 326:
Impact Investments: An emerging ass
- Page 327 and 328:
Impact Investments: An emerging ass
- Page 329 and 330:
Impact Investments: An emerging ass
- Page 331 and 332:
Impact Investments: An emerging ass
- Page 333 and 334:
Impact Investments: An emerging ass
- Page 335 and 336:
Impact Investments: An emerging ass
- Page 337 and 338:
Impact Investments: An emerging ass
- Page 339 and 340:
Impact Investments: An emerging ass
- Page 341 and 342:
Impact Investments: An emerging ass
- Page 343 and 344:
Impact Investments: An emerging ass
- Page 345 and 346:
Impact Investments: An emerging ass
- Page 347 and 348:
Impact Investments: An emerging ass
- Page 349 and 350:
Impact Investments: An emerging ass
- Page 351 and 352:
Impact Investments: An emerging ass
- Page 353 and 354:
Impact Investments: An emerging ass
- Page 355 and 356:
Impact Investments: An emerging ass
- Page 357 and 358:
Impact Investments: An emerging ass
- Page 359 and 360:
Impact Investments: An emerging ass
- Page 361 and 362:
Impact Investments: An emerging ass
- Page 363 and 364:
Impact Investments: An emerging ass
- Page 365 and 366:
Impact Investments: An emerging ass
- Page 367 and 368:
Impact Investments: An emerging ass
- Page 369 and 370:
Impact Investments: An emerging ass
- Page 371 and 372:
Impact Investments: An emerging ass
- Page 373 and 374:
Impact Investments: An emerging ass
- Page 375 and 376:
Impact Investments: An emerging ass
- Page 377 and 378:
Impact Investments: An emerging ass
- Page 379 and 380:
Impact Investments: An emerging ass
- Page 381 and 382:
Impact Investments: An emerging ass
- Page 383 and 384:
Impact Investments: An emerging ass
- Page 385 and 386:
Impact Investments: An emerging ass
- Page 387 and 388:
Impact Investments: An emerging ass
- Page 389 and 390:
Impact Investments: An emerging ass
- Page 391 and 392:
Impact Investments: An emerging ass
- Page 393 and 394:
Impact Investments: An emerging ass
- Page 395 and 396:
Impact Investments: An emerging ass
- Page 397 and 398:
Page 120 of 140
- Page 399 and 400:
Advocacy Foundation Publishers The
- Page 401 and 402:
XVI for Drug-Free Communities Landm
- Page 403 and 404:
Vol. VIII 2022 ComeUnity ReEngineer
- Page 405 and 406:
Vol. XV 2029 Inner-Cities Revitaliz
- Page 407 and 408:
The e-Advocate Journal of Theologic
- Page 409 and 410:
Issue Title Quarterly Vol. I 2015 I
- Page 411 and 412:
The e-Advocate Juvenile Justice Rep
- Page 413 and 414:
2018 - The Theological Law Firm Aca
- Page 415 and 416:
About The Author John C (Jack) John
- Page 417:
Page 140 of 140