Acoem Integro LIDAR Network brochure
Acoem Integro LIDAR Network brochure
Acoem Integro LIDAR Network brochure

You also want an ePaper? Increase the reach of your titles
YUMPU automatically turns print PDFs into web optimized ePapers that Google loves.
<strong>Integro</strong> <br />
<strong>LIDAR</strong> <strong>Network</strong><br />
HOLISTIC 3D<br />
DUST MONITORING SYSTEM
How do you shorten the<br />
path between monitoring<br />
and informed action?<br />
For more than 50 years we have been designing<br />
and manufacturing class-leading multi-parameter<br />
environmental monitoring and industrial reliability<br />
solutions.<br />
We offer our global customers a complete range of<br />
integrated measurement technologies and services,<br />
ensuring that your data is always accurate and your<br />
equipment operates with maximum efficiency.<br />
We believe in helping you find the right balance<br />
between progress and preservation.<br />
Empowering industries, government authorities,<br />
scientists and communities to make knowledgeable<br />
decisions based on reliable data, our holistic<br />
solutions lead to operational excellence and better<br />
outcomes.<br />
At <strong>Acoem</strong>, we create environments of possibility.<br />
acoem.com.au/lidar | 3
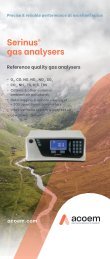
The <strong>Integro</strong> <strong>LIDAR</strong> <strong>Network</strong><br />
A complete dust measurement and<br />
monitoring system<br />
The <strong>Integro</strong> <strong>LIDAR</strong> <strong>Network</strong> is a turnkey solution that<br />
effectively and efficiently monitors on-site dust levels<br />
and displays data in near-real time, providing accurate<br />
feedback to enable dust mitigation strategies including<br />
suppression systems.<br />
DUST AND METEOROLOGICAL<br />
MONITORING STATIONS<br />
The <strong>Integro</strong> <strong>LIDAR</strong> network utilises ground-based dust<br />
measurements along with wind speed and direction from<br />
fixed stations to correlate the scanned data to real world<br />
measurement units such as μg/m 3 .<br />
<strong>LIDAR</strong> TECHNOLOGY<br />
The <strong>LIDAR</strong> instrument, developed by Leosphere, is used to<br />
continuously scan the observed area and measure dust<br />
concentration and radial wind speed/wind direction to identify<br />
dust emission sources and dust dispersion trajectories.<br />
AIRODIS SOFTWARE<br />
Data from the <strong>LIDAR</strong> instrument and the monitoring stations is<br />
correlated to determine the extent and load of atmospheric dust<br />
every 5-10 minutes.<br />
ACOEM CLOUD 3D INTERFACE<br />
The web browser-based interface gives users a highresolution<br />
Google Earth-like 3D viewing experience for live<br />
and historical site data.<br />
DUST MANAGEMENT MEASURES<br />
Operation managers use the data to immediately<br />
implement targeted dust management measures.
Around the world, governments, corporations and<br />
communities are increasingly concerned about the<br />
health and environmental impact of dust migration<br />
from mining and industrial activities.<br />
Their concerns are well-founded, with<br />
an abundance of evidence proving that<br />
air pollution has an adverse effect on the<br />
health and quality of life of people living<br />
and working in exposed areas.<br />
<strong>Acoem</strong> – over 40 years of<br />
dust monitoring expertise<br />
<strong>Acoem</strong> has been at the forefront of dust monitoring<br />
for over 40 years. Driven by industries' and regulatory<br />
authorities’ need for an advanced compliance solution<br />
for real-time dust monitoring over large areas, we were<br />
one of the first companies in the world to offer our<br />
global customers a working <strong>LIDAR</strong>-based dust<br />
monitoring system.<br />
The <strong>Integro</strong> <strong>LIDAR</strong> <strong>Network</strong> by <strong>Acoem</strong> is an essential<br />
operational tool for businesses looking to increase<br />
efficiency and enhance workplace safety while also<br />
fulfilling their regulatory compliance responsibilities<br />
— making it so much more than an environmental<br />
monitoring tool.<br />
Track dust behaviour from the exact<br />
emission source<br />
<strong>Integro</strong> <strong>LIDAR</strong> <strong>Network</strong> is currently being used in some of<br />
the world’s harshest and most remote locations. Suitable<br />
for a variety of applications, including mining, ports,<br />
infrastructure construction and community engagement,<br />
the <strong>Integro</strong> <strong>LIDAR</strong> <strong>Network</strong> gives you full visibility over<br />
concentrations on site.<br />
The <strong>Integro</strong> <strong>LIDAR</strong> <strong>Network</strong> consists of:<br />
- A Light Detection and Ranging (<strong>LIDAR</strong>) Windcube®<br />
that continuously scans the required area & measures<br />
dust concentration & radial wind speed/wind direction<br />
- Reference-quality dust & meteorological stations<br />
- <strong>Acoem</strong> Airodis software to capture, analyse<br />
& correlate your data<br />
- <strong>Acoem</strong> Cloud which stores your data & powers<br />
the fully-interactive interface.<br />
acoem.com.au/lidar | 5
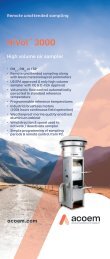
The <strong>LIDAR</strong> technology<br />
difference<br />
The Leosphere Windcube®, a <strong>LIDAR</strong> (Light<br />
Detection and Ranging) instrument,<br />
measures dust emission sources and dust<br />
movement over a scanned area.<br />
15º<br />
Unlike fixed dust monitoring stations — where detection<br />
is delayed and the spatial extent is poorly constrained<br />
- <strong>LIDAR</strong> accurately captures dust emission sources,<br />
movement and trajectories over the entire scanned area.<br />
RHI<br />
Real-time information allows facility managers and<br />
environmental officers to track dust behaviour from<br />
the exact emission source and immediately respond by<br />
implementing a corrective action plan.<br />
PPI<br />
The Windcube® can be configured to<br />
complete several different scan types,<br />
including:<br />
- Radial or Planned position Indication (PPI) which covers<br />
a full 360° rotation or a targeted partial segment scan,<br />
plus wind speed & direction<br />
- Vertical or Range Height Indication (RHI) which<br />
determines the lift off & ceiling height of the dust plume<br />
dispersion & lets you choose the desired resolution of the<br />
dispersion images.<br />
Coverage area ranges from a few hundred metres up to<br />
12 km (24 km scan diameter).<br />
The advanced <strong>LIDAR</strong> technology in the <strong>Integro</strong> <strong>LIDAR</strong><br />
<strong>Network</strong> captures 10,000 to 50,000 individual data points<br />
per scan every 5-10 minutes.<br />
This, together with data from the fixed monitoring<br />
stations, provides information on dust mass<br />
concentration measurements in µg/m3. That is the<br />
equivalent of running up to 50,000 individual dust<br />
monitoring stations using one integrated system.<br />
<strong>LIDAR</strong> technology works in harmony with the fixed<br />
stations, using their regulatory dust concentration<br />
measurements to correlate its scanned data.
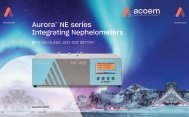
3D mapping brings<br />
your data to life<br />
The 3D mapping platform of the <strong>Integro</strong><br />
<strong>LIDAR</strong> <strong>Network</strong> offers a whole new level<br />
of interactivity with an enhanced user<br />
experience that empowers you to make<br />
informed operational decisions.<br />
Fully integrated and built into the <strong>Acoem</strong> Cloud web<br />
browser, access the interface from any enabled device —<br />
smartphone, tablet or computer.<br />
Offering a high-resolution Google Earth-like 3D viewing<br />
experience, the intuitive mapping platform helps you<br />
transform your monitoring data into immediate action.<br />
- Visualise in 3D actual particulate concentrations &<br />
aerosol plumes on your site in near-real time<br />
- Zoom in or zoom out with the touch of a button<br />
- Scan up & down to view the colour-coded data from<br />
above, from the side or any angle<br />
- Quickly & easily identify hotspots or fluctuations<br />
- Access historical data using the horizontal time scale<br />
- Pinpoint changes over specific time periods & compare<br />
results<br />
- Evaluate the effectiveness of mitigation measures.<br />
VERTICAL SCAN<br />
HORIZONTAL SCAN<br />
acoem.com.au/lidar | 7
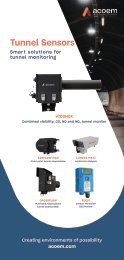
How <strong>LIDAR</strong> works<br />
The Leosphere Windcube® takes a<br />
snapshot measurement of dust backscatter<br />
at preconfigured ‘gates’ along<br />
its line of sight.<br />
The spacing between the gates is programmable,<br />
structured to best measure and record dust activity<br />
across the total distance.<br />
Most often, gate spacing is set at 25 metres, but in many<br />
applications, may have smaller intervals. The scanning<br />
speed can be varied with lower scan speeds producing<br />
higher resolution images of a dust plume. The <strong>LIDAR</strong><br />
configuration is easily modified allowing scanning<br />
scenarios to be selected to target specific areas.<br />
Beam scans the area to provide 2-3D spatial coverage<br />
Portion of scattered light is<br />
collected by the telescope<br />
25m pulse transmitted<br />
at 100-500 times a second<br />
Pulse envelope (25m)<br />
Doppler shift of particles Wind speed & direction.<br />
Backscattered light Detect the presence of particles.<br />
NOTE: Diagram not to scale<br />
LEOSPHERE WINDCUBE® FEATURES<br />
Dimension 1.5 m 2<br />
Weight<br />
Scanning type<br />
Scanning mode<br />
Scanning speed<br />
250 kg<br />
Endless, full hemispherical<br />
scanning<br />
Continuous scan mode<br />
Up to 30°/s<br />
Range of azimuth angle 0 to 360°<br />
Range of elevation angle -15 to 195°<br />
Angular resolution 0.1°<br />
Pointing accuracy
DUST MONITORING STATIONS<br />
Fixed dust monitoring stations are deployed as part of the<br />
<strong>Integro</strong> <strong>LIDAR</strong> <strong>Network</strong>. These stations are used to record<br />
localised dust concentration levels and wind speed/wind<br />
direction data.<br />
Data from the monitors is used to convert the optical<br />
data recorded on the Windcube® and display it as a mass<br />
concentration in µg/m 3 . This calculation occurs every<br />
hour within the Airodis software, utilising a correlation<br />
algorithm developed by <strong>Acoem</strong>.<br />
METEOROLOGICAL DATA<br />
Measuring wind speed and wind direction is vital to<br />
the accurate determination of dust emission sources<br />
and lift-off points. The network has several sensors at<br />
varying heights to record both local and site-wide wind<br />
conditions.<br />
Ambient temperature and relative humidity are<br />
monitored at a central location on the site. This data<br />
is used to fine tune and check the <strong>LIDAR</strong> settings and<br />
allows the Windcube® to record data that will enable the<br />
interface to produce consistent high quality images.<br />
Additional instrumentation can be included within the<br />
meteorological network to calculate evapotranspiration.<br />
This information can be useful when trying to determine<br />
how much water leaves the stockpiles through<br />
evaporation.<br />
The Windcube® is mounted<br />
at a height that allows a<br />
clear line of sight over the<br />
scanning area. This ensures<br />
that the PPI and RHI scans<br />
are uninterrupted by physical<br />
structures or stockpiles.<br />
acoem.com.au/lidar | 9
Always connected<br />
via Airodis software<br />
& <strong>Acoem</strong> Cloud<br />
<strong>Acoem</strong> Airodis software is the primary<br />
data handling tool for the <strong>Integro</strong> <strong>LIDAR</strong><br />
<strong>Network</strong>, capturing real-time data in<br />
5-10 minute intervals and automatically<br />
downloading it to the server.<br />
Airodis then processes the <strong>LIDAR</strong> and reference stations<br />
data to determine and report the mass concentration<br />
levels of dust dispersion.<br />
Processed data is transferred in real time via the <strong>Acoem</strong><br />
Cloud to populate the mapping platform interface with<br />
constant access to live and historical views of your site.<br />
Benefits of the<br />
<strong>Integro</strong> <strong>LIDAR</strong> <strong>Network</strong><br />
- Access real-time, precise information to inform<br />
effective & targeted dust suppression measures<br />
- Comply with government regulations for dust emissions<br />
- Identify the exact source of dust emissions exceedances<br />
- Enhance operational efficiency<br />
- Easy-to-use 3D graphic interface<br />
- Protect the safety of your workers<br />
- Safeguard the health & quality of life of<br />
surrounding communities<br />
- Conserve resources<br />
- Always connected.
Creating complete<br />
end-to-end systems<br />
for better outcomes<br />
<strong>Acoem</strong>’s commitment to shortening the<br />
path between monitoring and informed<br />
action inspires us to push the boundaries<br />
of our technology’s functionality and<br />
capabilities.<br />
Our goal is to continually improve the user experience<br />
and create value-added systems for our customers.<br />
<strong>Acoem</strong> not only creates technology but it partners with<br />
like-minded innovators in environmental management to<br />
provide holistic data-powered solutions and full end-toend<br />
services.<br />
Our highly skilled Environmental Reporting Services (ERS)<br />
team consistently oversees the network to make sure<br />
that data captured is validated and accurate.<br />
Because of changes in background and atmospheric<br />
conditions, ERS team members review the <strong>Network</strong> daily<br />
and make any required <strong>LIDAR</strong> parameter changes.<br />
Our technicians also deliver on-the-ground support,<br />
managing maintenance issues and calibration so you can<br />
concentrate on your core business activities and make<br />
timely, accurate and informed operational decisions.<br />
acoem.com.au/lidar | 11
About <strong>Acoem</strong><br />
At <strong>Acoem</strong>, we create environments of possibility — helping organisations<br />
find the right balance between progress and preservation — safeguarding<br />
businesses and assets, and maximising opportunities while conserving<br />
the planet’s resources. We deliver unrivalled, interoperable AI-powered<br />
sensors and ecosystems that empower our customers to make enlightened<br />
decisions based on accurate information.<br />
Together with 150 distributors, our 800+ employees work across 26 offices,<br />
5 manufacturing facilities and 3 R&D centres in 11 countries, to provide<br />
trusted, holistic data solutions for customers worldwide.<br />
<strong>Acoem</strong> links possibilities with protection.<br />
For more information visit acoem.com<br />
<strong>Acoem</strong><br />
1492 Ferntree Gully Road<br />
Knoxfield VIC 3180<br />
Melbourne Australia<br />
+61 3 9730 7800 | email@acoem.com<br />
acoem.com.au/lidar<br />
Specifications subject to change without notice. All images used are for illustrative purposes only.<br />
<strong>Integro</strong> <strong>LIDAR</strong> <strong>Network</strong> has no affiliation with Google LLC or its Google Earth program. All trademarks and registered trademarks are the property of their respective owners. ©2021 <strong>Acoem</strong> and all related entities. All rights reserved. 20210721