

NCAS Poster
NASA's Galaxy Evolution Explorer (GALEX) provided near- and far-UV observations for approximately 77 percent of the sky over a ten-year period; however, the data reduction pipeline initially only released single NUV and FUV images to the community. The recently released Python module gPhoton changes this, allowing calibrated time-series aperture photometry to be extracted easily from the raw GALEX data set. Here we use gPhoton to generate light curves for all hot subdwarf B (sdB) stars that were observed by GALEX, with the intention of identifying short-period, p-mode pulsations. We find that the spacecraft's short visit durations, uneven gaps between visits, and dither pattern make the detection of hot subdwarf pulsations difficult. Nonetheless, we detect UV variations in four previously known pulsating targets and report their UV pulsation amplitudes and frequencies. Additionally, we find that several other sdB targets not previously known to vary show promising signals in their periodograms. Using optical follow-up photometry with the Skynet Robotic Telescope Network, we confirm p-mode pulsations in one of these targets, LAMOST J082517.99+113106.3, and report it as the most recent addition to the sdBVr class of variable stars.
NASA's Galaxy Evolution Explorer (GALEX) provided near- and far-UV observations for approximately 77 percent of the sky over a ten-year period; however, the data reduction pipeline initially only released single NUV and FUV images to the community. The recently released Python module gPhoton changes this, allowing calibrated time-series aperture photometry to be extracted easily from the raw GALEX data set. Here we use gPhoton to generate light curves for all hot subdwarf B (sdB) stars that were observed by GALEX, with the intention of identifying short-period, p-mode pulsations. We find that the spacecraft's short visit durations, uneven gaps between visits, and dither pattern make the detection of hot subdwarf pulsations difficult. Nonetheless, we detect UV variations in four previously known pulsating targets and report their UV pulsation amplitudes and frequencies. Additionally, we find that several other sdB targets not previously known to vary show promising signals in their periodograms. Using optical follow-up photometry with the Skynet Robotic Telescope Network, we confirm p-mode pulsations in one of these targets, LAMOST J082517.99+113106.3, and report it as the most recent addition to the sdBVr class of variable stars.

Create successful ePaper yourself
Turn your PDF publications into a flip-book with our unique Google optimized e-Paper software.
A Search for Short Period Pulsation in All Hot Subdwarfs<br />
with NASA's GALEX Mission<br />
Thomas Boudreaux 1 , Brad N. Barlow 1 , Scott W. Fleming 2 , and Alan Vasquez Soto 1<br />
1: Department of Physics, High Point University, One University Parkway, High Point, NC 27268 USA<br />
2: Space Telescope Science Institute, 3700 San Martin Dr., Baltimore, MD 21218, USA<br />
Introduction<br />
Data Extraction<br />
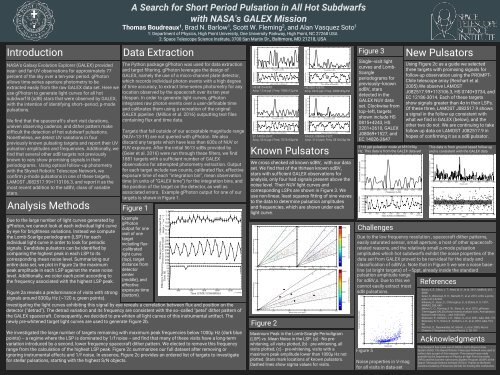
Figure 3<br />
New Pulsators<br />
NASA's Galaxy Evolution Explorer (GALEX) provided<br />
near- and far-UV observations for approximately 77<br />
percent of the sky over a ten-year period. gPhoton<br />
allows time-series aperture photometry to be<br />
extracted easily from the raw GALEX data set. Here we<br />
use gPhoton to generate light curves for all hot<br />
subdwarf B (sdB) stars that were observed by GALEX,<br />
with the intention of identifying short--period, p-mode<br />
pulsations.<br />
We find that the spacecraft's short visit durations,<br />
uneven observing cadence, and dither pattern make<br />
difficult the detection of hot subdwarf pulsations.<br />
Nonetheless, we detect UV variations in four<br />
previously known pulsating targets and report their UV<br />
pulsation amplitudes and frequencies. Additionally, we<br />
find that several other sdB targets not previously<br />
known to vary show promising signals in their<br />
periodograms. Using optical follow--up photometry<br />
with the Skynet Robotic Telescope Network, we<br />
confirm p-mode pulsations in one of these targets,<br />
LAMOST J082517.99+113106.3, and report it as the<br />
most recent addition to the sdBV r class of variable<br />
stars.<br />
Analysis Methods<br />
Due to the large number of light curves generated by<br />
gPhoton, we cannot look at each individual light curve<br />
by eye for brightness variations. Instead we compute<br />
the Lomb-Scarlge periodogram (LSP) for each<br />
individual light curve in order to look for periodic<br />
signals. Candidate pulsators can be identified by<br />
comparing the highest peak in each LSP to its<br />
corresponding mean noise level. Summarizing our<br />
entire data set, we plot in Figure 2a the maximum<br />
peak amplitude in each LSP against the mean noise<br />
level. Additionally, we color each point according to<br />
the frequency associated with the highest LSP peak.<br />
Figure 2a reveals a predominance of visits with strong<br />
signals around 8300μ Hz (~120 s; green points).<br />
The Python package gPhoton was used for data extraction<br />
and target filtering. gPhoton leverages the design of<br />
GALEX, namely the use of a micro-channel plate detector,<br />
which records individual photon events with a high degree<br />
of time accuracy, to extract time-series photometry for any<br />
location observed by the spacecraft over its ten year<br />
lifespan. In order to generate light curves, gPhoton<br />
integrates raw photon events over a user-definable time<br />
and calibrates them using a recreation of the original<br />
GALEX pipeline (Million et al. 2016) outputting text files<br />
containing flux and time data.<br />
Targets that fall outside of our acceptable magnitude range<br />
(NUV=13-19) are not queried with gPhoton. We also<br />
discard any targets which have less than 600s of NUV or<br />
FUV exposure. After the initial 5613 sdBs provided by<br />
(Geier et al. 2016) were run through these filters, we find<br />
1881 targets with a sufficient number of GALEX<br />
observations for attempted photometry extraction. Output<br />
for each target include raw counts, calibrated flux, effective<br />
exposure time of each “integration bin”, mean observation<br />
time (in units of ”GALEX time”) for the integration bins, and<br />
the position of the target on the detector, as well as<br />
associated errors. Example gPhoton output for one of our<br />
targets is shown in Figure 1.<br />
Figure 1<br />
Example<br />
gPhoton<br />
output for one<br />
visit of one<br />
target<br />
including flux-<br />
-calibrated<br />
light curve<br />
(top), target<br />
distance from<br />
detector<br />
center<br />
(middle), and<br />
effective<br />
exposure time<br />
(bottom).<br />
Investigating the light curves exhibiting this signal by eye reveals a correlation between flux and position on the<br />
detector ("detrad"). The detrad variation and its frequency are consistent with the so--called "petal" dither pattern of<br />
the GALEX spacecraft. Consequently, we decided to pre-whiten all light curves of this instrumental artifact. The<br />
newly pre-whitened target light curves are used to generate Figure 2b.<br />
We investigated the large number of targets remaining with maximum peak frequencies below 1000μ Hz (dark blue<br />
points) -- a regime where the LSP is dominated by 1/f noise -- and find that many of these visits have a long-term<br />
variation introduced by a second, lower frequency spacecraft dither pattern. We elected to remove this frequency<br />
range from the calculation of the highest LSP peak. Figure 2c summarizes our full dataset after removing or<br />
ignoring instrumental effects and 1/f noise. In essence, Figure 2c provides an ordered list of targets to investigate<br />
for stellar pulsations, starting with the highest S/N objects.<br />
HS 0815+4243:<br />
Amp: 12±4 ppt | Freq: 7880±12μ Hz<br />
EC 14026-2647:<br />
Amp: 22±4 ppt | Freq: 7074±53μ Hz<br />
Known Pulsators<br />
We cross checked all known sdBV r with our data<br />
set. We find that of the thirteen known sdBV r<br />
stars with sufficient GALEX observations for<br />
analysis, only four had signals present above the<br />
noise level. Their NUV light curves and<br />
corresponding LSPs are shown in Figure 3. We<br />
use non-linear, least squares fitting of sine waves<br />
to the data to determine pulsation amplitudes<br />
and frequencies, which are shown under each<br />
light curve.<br />
Figure 2<br />
HS 2201+2610:<br />
Amp: 20±2 ppt | Freq: 2800±45μ Hz<br />
GALEX J08069+1527:<br />
Amp: 31±3 ppt | Freq: 2810±32μ Hz<br />
Maximum Peak in the Lomb-Scargle Periodigram<br />
(LSP) vs. Mean Noise in the LSP. (a) - No prewhitening,<br />
all visits plotted, (b) - pre-whitening, all<br />
visits plotted, (c) - pre-whitening, visits with a<br />
maximum peak amplitude lower than 1000μ Hz not<br />
plotted. Stars mark locations of known pulsators.<br />
Dashed lines show sigma values for visits.<br />
Single--visit light<br />
curves and Lomb-<br />
Scargle<br />
periodograms for<br />
previously--known<br />
sdBV r stars<br />
detected in the<br />
GALEX NUV data<br />
set. Clockwise from<br />
top--left, targets<br />
shown include HS<br />
0815+4243, HS<br />
2201+2610, GALEX<br />
J08069+1527, and<br />
EC 14026-2647<br />
21±4 ppt pulsation mode at 6810±56μ<br />
Hz. This data is from the GALEX data-set<br />
Challenges<br />
Due to the low frequency resolution , spacecraft dither patterns,<br />
easily saturated sensor, small aperture, a host of other spacecraftrelated<br />
reasons, and the relatively small p-mode pulsation<br />
amplitudes which hot subdwarfs exhibit the noise properties of the<br />
data set from GALEX proved to be non-ideal for the study and<br />
classification of sdBV r s. Note that in Figure 5 we see a noise baseline<br />
(at bright targets) of ~5ppt, already inside the standard<br />
pulsation amplitude range<br />
for sdBV r s. Due to this we<br />
cannot easily extract most<br />
sdB pulsations.<br />
Figure 5<br />
Noise properties in V-mag<br />
for all visits in data-set<br />
Using Figure 2c as a guide we selected<br />
three targets with promising signals for<br />
follow-up observation using the PROMPT-<br />
Chile telescope array (Reichart et al.<br />
2005).We observe LAMOST<br />
J082517.99+113106.3, HS 0740+3734, and<br />
EC 12186-3014. Each of these targets<br />
show signals greater than 4σ in their LSPs.<br />
Of these three, LAMOST J082517.9 shows<br />
a signal in the follow up consistent with<br />
what we find in GALEX (below), and the<br />
other two do not. We are continuing to take<br />
follow up data on LAMOST J082517.9 in<br />
hopes of confirming it as a sdB pulsator.<br />
This data is from ground based follow up<br />
and is consistent with the GALEX data<br />
References<br />
- Baran, A. S., Gilker, J. T., Reed, M. D., et al. 2011, MNRAS, 413,<br />
2838<br />
- Geier, S., Østensen, R. H., Nemeth, P., et al. 2016, ArXiv e-prints,<br />
arXiv:1612.02995<br />
- Kilkenny, D., Koen, C., O’Donoghue, D., & Stobie, R. S. 1997,<br />
MNRAS, 285, 640<br />
- Million, C. C., Fleming, S. W., Shiao, B., et al. 2016, gPhoton:<br />
Time-tagged GALEX photon events analysis tools, Astrophysics<br />
Source Code Library, , , ascl:1603.004<br />
- Østensen, R., Solheim, J.-E., Heber, U., et al. 2001, A&A, 368, 175<br />
- Østensen, R. H., Oreiro, R., Solheim, J.-E., et al. 2010, A&A, 513,<br />
A6<br />
- Reichart, D., Nysewander, M., Moran, J., et al. 2005, Nuovo<br />
Cimento C Geophysics Space Physics C, 28, 767<br />
Acknowledgments<br />
This Research has made use of NASA’s Astro-Physics Data<br />
System (ADS). The Skynet Robotic Telescope Network was used to<br />
collect data as part of this research. This research was made<br />
possible by the Department of Physics at High Point University<br />
(HPU) and the Summer Astronomy Student Program (SASP) at the<br />
Space Telescope Science Institute (STScI). Thanks to the North<br />
Carolina Academy of Sciences (<strong>NCAS</strong>) for hosting this conference.
