Food Consumption Patterns Part 2

You also want an ePaper? Increase the reach of your titles
YUMPU automatically turns print PDFs into web optimized ePapers that Google loves.
151<br />
50%<br />
40%<br />
30%<br />
20%<br />
10%<br />
0%<br />
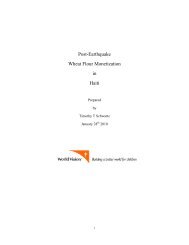
Figure A9-1: Frequency <strong>Consumption</strong> of Peanuts vs. Peanut<br />
Butter (n=113)<br />
32% 34%<br />
29%<br />
39%<br />
21%<br />
7%<br />
14%<br />
8% 6%<br />
5%<br />
4%<br />
1%<br />
Peanut Butter<br />
Peanuts<br />
100%<br />
80%<br />
60%<br />
40%<br />
20%<br />
87%<br />
Figure A9-2: Usual Time of <strong>Consumption</strong><br />
78%<br />
17%<br />
9% 11% 9% 7%<br />
12% 10% 12%<br />
0%<br />
morning mid_morning noon afternoon evening<br />
Peanut Butter<br />
Peanuts<br />
Regarding<br />
the<br />
peanut<br />
butter sachets, 85% would buy them, most said that they would like to pay 5 goud, however, 73%<br />
siad they thought they could sell it, would like to pay 3 goud (median) and sell it for 5 goud<br />
(median). The recommended number per case was a median of 100 sachet; 85% felt that there<br />
was a sufficient quanity in the sachet, 95% would pay more for if it was bigger (Table 3).<br />
Table A9-2: Reactions to Sachets of Peanut Butter<br />
Would<br />
Quantity<br />
in sachet<br />
is<br />
Would pay<br />
more for<br />
bigger<br />
Thinks<br />
they<br />
could Purchase Resale<br />
Recommended<br />
number of<br />
sachets per case<br />
buy it sufficient sachet sell it Avg Med Avg Med Avg Med<br />
85% 85% 95% 73% 5.3 gd 3 gd 7.8 gd 5 gd 115 100