Food Consumption Patterns Part 2

Create successful ePaper yourself
Turn your PDF publications into a flip-book with our unique Google optimized e-Paper software.
Percentage (%)<br />
145<br />
100%<br />
Figure A8-3: Products respondent sells (N=33)<br />
100%<br />
90%<br />
80%<br />
76%<br />
70%<br />
60%<br />
50%<br />
52%<br />
40%<br />
30%<br />
30%<br />
20%<br />
10%<br />
0%<br />
6%<br />
3%<br />
6% 6%<br />
6%<br />
Product<br />
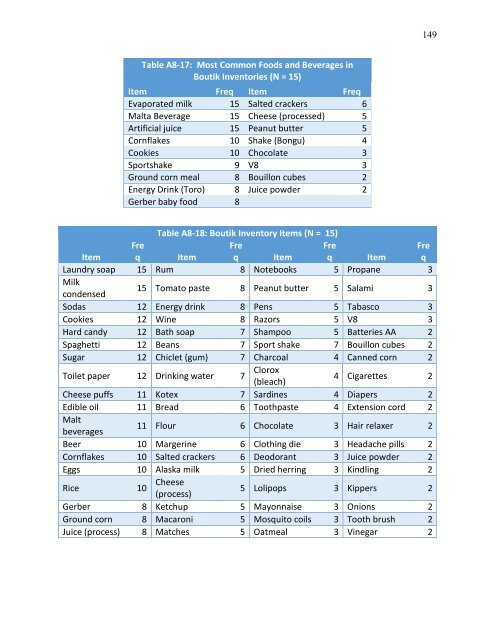
Among drinks, carbonated sodas were the most frequently stocked. Twenty-four of the 33<br />
respondents, or 73%, listed sodas as one of their two most commonly purchased beverages,<br />
accounting for 36% of the 66 responses. Processed juice (Tampico) was the second most<br />
commonly cited drink. It was listed by 22 respondents (67%) and accounted for a third of all<br />
responses. The other most common drinks were beer, other types of sugared drinks, and canned<br />
juice (Tables X and Y).<br />
Table A8-14: Top 5 beverages<br />
Stores selling<br />
Beverage<br />
(N=33)<br />
Carbonated soda 24<br />
Processed juice (Tampico) 22<br />
Beer 8<br />
Other sugar drink 6<br />
Juice 2