Food Consumption Patterns Part 2

You also want an ePaper? Increase the reach of your titles
YUMPU automatically turns print PDFs into web optimized ePapers that Google loves.
HG per mammit<br />
85<br />
in the dry Department of the North West peanuts are the major cash crop grown in many mountain<br />
areas where they are intercropped with tobacco, castor beans, sorghum, melons, squash, okra,<br />
pigeon peas, sweet potatoes, and sesame. They are also grown at lower altitudes of the North West,<br />
in loamy patches of desert where, farmers report, just two rains can be sufficient to obtain a<br />
profitable yield.<br />
The Market<br />
Peanuts are definitively a market crop. TechnoServe (ibid) estimates that 5% or less of Haiti’s<br />
peanuts are consumed by the household that produces them. TechnoServe estimated that only<br />
another 5% of peanuts go to the formal sector: 3-4% to industrial peanut butter and peanut<br />
processors, 1-2% to RUTFs manufactured by the only two social enterprises in Haiti that engage<br />
in the sector, PIH and MFK. Fully 95% of peanuts were going to the informal sector: 46.5% sold<br />
immediately after harvest, and 44.9% stored for subsequent sale over a period extending to six<br />
months, during which time the revenue generated eventually reaches three times the price at the<br />
time of harvest. (see also Jolly and Prophete, 1999). iv<br />
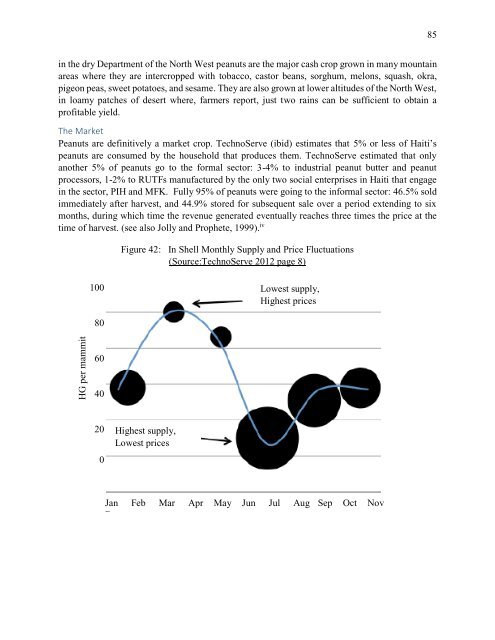
Figure 42: In Shell Monthly Supply and Price Fluctuations<br />
(Source:TechnoServe 2012 page 8)<br />
100<br />
Lowest supply,<br />
Highest prices<br />
80<br />
60<br />
40<br />
20<br />
0<br />
Highest supply,<br />
Lowest prices<br />
Jan Feb Mar Apr May Jun Jul Aug Sep Oct Nov<br />
Dec