CNSA Targeting

You also want an ePaper? Increase the reach of your titles
YUMPU automatically turns print PDFs into web optimized ePapers that Google loves.
29<br />
To be sure, there are some differences, for example in regional migration patterns, remittances,<br />
and slight differences in dependency on agricultural strategies. <strong>CNSA</strong>/FEWSNET (2009)<br />
documented differences in vulnerability and infrastructure at the sub-department level. But the<br />
same figures vary by survey, a probable consequence of sampling error; ix and they vary by year, a<br />
probable consequence of climate variation and differential temporally idiosyncratic shocks. The<br />
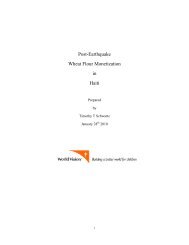
variation over time can be seen in nutritional status of children per department (see Figure 21,<br />
below); and it can be seen in <strong>CNSA</strong>/FEWSNET Vulnerability maps (see Figure 22 below). The<br />
variation over time, with extremes of vulnerability moving from department or commune to<br />
another raise the question: to what degree are differences observed between households a<br />
consequence of temporary impacts? Moreover, differences in one variable are offset by others.<br />
For example, while in the 2007 CFSVA the department of the Artibonite had the lowest<br />
educational level and the highest number of food insecure months, it has the greatest availability<br />
of household water sources, irrigated land, and one of the highest rural income levels (at 6.4 in the<br />
<strong>CNSA</strong>/CFVSA p55 and Verner 2008:18). In short, the bulk of the population is uniformly<br />
destitute; and advantages in one respect in a particular region are consistently offset by<br />
comparatively greater disadvantages in other respects. Even rural urban distinctions can be called<br />
into question: the proportion of the population poor in provincial cities and towns vs. those in rural<br />
areas are insignificant until one reaches the highest 20% of the population (Figure 23). In summary,<br />
if we consider how small the differences in most indicators are between municipal districts and<br />
ecological zones, and then we consider change from a longitudinal perspective, the most fantastic<br />
thing about geographical profiles in Haiti is the overall homogeneity.<br />
Nippes<br />
Nord-Ouest<br />
Grande-Anse<br />
Sud<br />
Centre<br />
Artibonite<br />
Nord-Est<br />
Nord<br />
Sud-Est<br />
Ouest<br />
AireMétropolitaine<br />
Figure 21: Change in Chronic Child Malnutrition by<br />
Department (EMMUS 2000, 2005,2012)<br />
2012 2005 2000<br />
0% 5% 10% 15% 20% 25% 30% 35% 40%<br />
Figure 4: Change in Chronic Child Nutrition by Department