0 - University of California, Berkeley
0 - University of California, Berkeley
0 - University of California, Berkeley

Create successful ePaper yourself
Turn your PDF publications into a flip-book with our unique Google optimized e-Paper software.
ADDITIONS TO THE IMAGING CAPABILITY OF SAMPLE<br />
by<br />
Mark D. Prouty<br />
Memorandum No. UCB/ERL M84/111<br />
SAMPLE Report No. SAMD-8<br />
10 December 1984
ADDITIONS TO THE IMAGING CAPABILITY OF SAMPLE<br />
by<br />
Mark D. Prouty<br />
Memorandum No. UCB/ERL M84/111<br />
10 December 1984<br />
ELECTRONICS RESEARCH LABORATORY<br />
Col 1 ege <strong>of</strong> Engi neeri ng<br />
<strong>University</strong> <strong>of</strong> <strong>California</strong>, <strong>Berkeley</strong><br />
94720
Table <strong>of</strong> Contents<br />
Table <strong>of</strong> Contents ............................................................................................<br />
list <strong>of</strong> lqplres .............................. ) ..................................................................<br />
1 Introduction ..................................................................... ...........................<br />
2 Calculating Images <strong>of</strong> Phase Shift Masks ....................................................<br />
2.1 Introduction ...........................................................................................<br />
2.2 Mathematical Methods ...........................................................................<br />
2.3 Implementation ......................................................................................<br />
3 Results using the Enhanced Program ..........................................................<br />
9.1 Introduction ........................................................................................... 7<br />
3.2Results .................................................................................................... 7<br />
3.3 Conclusion .............................................................................................. 10<br />
4 2-D User's Manual ......................................................................................... 11<br />
4.1 Introduction ........................................................................................... 11<br />
4.2 Rwming the Image Program .................................................................. 11<br />
4.3 How the Prograrn Works ......................................................................... 12<br />
Appendix 1 Comparison <strong>of</strong> New and Old Versions <strong>of</strong> SAMPLE .......................... 14<br />
Appendix 2 2-D Example ............................................................................... 15<br />
Appendix 3 Defect Printability in 2-D Goodman vs . Subrammian ................ 17<br />
References ....................................................................................................... 18<br />
1<br />
2<br />
3<br />
3<br />
3<br />
5<br />
6<br />
7<br />
.
fist <strong>of</strong> F'igures<br />
F'igure 1. Region <strong>of</strong> integration for equation (7)<br />
Qure 2.<br />
Figure 3.<br />
Figure 4.<br />
Figure 5.<br />
Figure 6.<br />
Figure 7.<br />
Region <strong>of</strong> integration for equation (7)<br />
Region <strong>of</strong> integration for equation (7)<br />
Region <strong>of</strong> integration for equation (7)<br />
Image intensity for a periodic series <strong>of</strong> lines and spaces 0.75 pm<br />
wide, for no phase shift (B) and 180" phase shift (A).<br />
Contrast vs. Defocus for series <strong>of</strong> lines and spaces.<br />
Contrast vs. Defocus for series <strong>of</strong> lines and spaces.<br />
Figure E. Contrast vs. Feature size for series <strong>of</strong> lines and spaces.<br />
Frgure 9. Contrast vs. Feature size for series <strong>of</strong> lines and spaces.<br />
Figure 10. Intensity proNe for 0.2 p m wide phase shift line defect.<br />
Figure 11. Intensity minimum vs. size for phase shift line defects.<br />
Figure 12. Intensity minimum vs size for phase shift line defects.<br />
Figure 13. Phase angle for necessary feature contrast and defect minimum as a<br />
function <strong>of</strong> size. o = 0.3.<br />
Figure 14. Minimum intensity for clear field phase transition.<br />
Figure 15. Image prome for clear field phase transition. Phase shifting material<br />
is on the right hand side.<br />
Fuure 16. Image pr<strong>of</strong>iles for smooth 180" transition over a distance <strong>of</strong> 0.6 (A),<br />
0.9 (B), and 1.2 (C) pm.<br />
Figure 17. Image pr<strong>of</strong>lles for 0.62 pm line with 0.3 pm (A), 0.2 p m (B), 0.1 +TI<br />
(c), and no (D) 180" phase shifted proximity feature. Center to<br />
center distance is 1.15 grn in all cases.<br />
2
1. ~uction<br />
#dditims bo the Imaging Capability <strong>of</strong> sAMpI;E<br />
Mark D. Prouty<br />
As feature sizes decrease in optical lithography. becoming smaller than the<br />
ratio <strong>of</strong> wavelength to numerical aperture, the faithfulness <strong>of</strong> imaging is<br />
significantly reduced. This makes zomputer simulations <strong>of</strong> optical lithography<br />
more difficult. flrst <strong>of</strong> all because more general techniques. such as phase shift<br />
masks, are being used to improve the image and secondly because the<br />
differences between 1 dimensional and 2 dimensional patterns, such as line end<br />
shortening and rounding <strong>of</strong> square apertures, are more important. Therefore,<br />
the capabilities <strong>of</strong> imaging phase shifting masks and 2 dimensional masks have<br />
been,added to the processing simulation program S.LMPLE.<br />
The second chapter <strong>of</strong> this paper outlines the details <strong>of</strong> the changes this<br />
author made in the program to calculate images <strong>of</strong> phase shift masks. The next<br />
chapter outlines some results obtained using the new program. The fourth<br />
chapter outlines the use <strong>of</strong> the'2-D code written by Shardcar Subramanian. Since<br />
&is work was never documented or implemented in the SAMPLE program this<br />
chapter will serve as a user's manual for 2-D imaging.<br />
2 Calculating Images <strong>of</strong> Wase Wt Masks.<br />
21. lntrodllctioa<br />
The resolution in uptical lithography is limited by proximity effects, that<br />
is. the spillover <strong>of</strong> difkacted light between adjacent features. In conventional<br />
lithography, 'light from each feature arrives in phase betMeen them, causing a<br />
slightly lightened area where a dark one is-desired. However. if the light coming<br />
from one <strong>of</strong> the features is delayed by a coating so that it arrives 180" out <strong>of</strong><br />
3
phase. the two Wacted beams will cancel, and the desired dark area will'be<br />
obtained.<br />
A mask using this technique, Plrst proposed by Levenson, et al.(l), has<br />
been dubbed a phase shift mask Levenson, using the basic case <strong>of</strong> a 180" phase<br />
shift. predicted theoretically and verified experimentally a much increased con-<br />
trast. The success <strong>of</strong> this phase mask approach has raised many conceptual and<br />
practical questions. Therefore, we decided to &enhance the capabilites <strong>of</strong> the<br />
SAMPLE program.<br />
The SAMPLE program calculates images using Hopkins(2) theory <strong>of</strong> partially<br />
coherent imaging. Briefly, the image intensity is given as the convolution <strong>of</strong> the<br />
Fourier transform <strong>of</strong> the mask intensity distribution with a function known as<br />
the transmission cross-coefficient (TCC). The TCC is in turn the convolution <strong>of</strong><br />
two functions, one over the condenser aperture and the other over the objective<br />
pupil. More details <strong>of</strong> this theory will be given later.<br />
Previously, the SAMPLE program calculated images <strong>of</strong> real masks which<br />
only required calculating the real part <strong>of</strong> the TCC. W-e have modified the pro-<br />
gram to calculate complex coefficients for the Fourier series <strong>of</strong> the mask and to<br />
also calculate the imaginary part <strong>of</strong> the TCC. This is a more complicated pro-<br />
cedure, but many symmetries could be exploited to shorten the numerical<br />
integration. In addition, the program will accept masks with up to 33 different<br />
regions with arbitrary amplitude transmission and phase shift. This method<br />
requires slightly more CPU time than the previous SAJfPLE version, up to twice<br />
as long. This time is from 2 to 12 CPU seconds on a VAX 11/780 with UNIX,<br />
depending on the size <strong>of</strong> the image. For an image period <strong>of</strong> 2 microns, for exam-<br />
ple, 4 seconds are required.<br />
4
22. &thematid Methods<br />
Kintner(3) gives details <strong>of</strong> the partial coherence theory, and<br />
Subrarnanian(4) shows how the theory is used in the SAMPLE program. There it<br />
is shown that the transform <strong>of</strong> the image intensity may be given as<br />
I<br />
W)= 2 (%%mfp. a+ E %+rn
the region where KCf+f', 9) is non-zero, uiz. a circle <strong>of</strong> radius 1 centered at<br />
(-f', 0) and .C" is the region where r(J +f". g ) is non-zero. viz. a circle <strong>of</strong><br />
radius 1 centered at (-I", 0) . Several.cases <strong>of</strong> these intersections are shown in<br />
figures 14.<br />
The speciAc formulas used in the program to integrate equation (7) are<br />
dependent upon the geometry <strong>of</strong> the circles C, C', C" . For the case shown in<br />
Figure 1<br />
ReT(f ', I") = If cos -27rp[f'2-f''2+2( (f '-f" )} "If dg<br />
ImT is identical, except cos is replaced by sin.<br />
These integrands all contain radicals unsuitzbk for Gaussian quadrature.<br />
Therefore, a transformation <strong>of</strong> the form<br />
Then the fhst integral becomes<br />
= s cos z or f +f ' = cos z is made.<br />
j I<br />
sin2z cos-2np f *2-f"Z+2(cosz -f ')(f '-f** I] (9)<br />
rn84fff + f ')<br />
With the further changes sin'z + (1-cos 22)/2 , f' + -f, and<br />
cos x .* cos(n-z) ( which just changes the limits <strong>of</strong> integration), these integrals<br />
are encoded in the program as functions gtl and gtli (gtl calculates the real<br />
part and gtli calculates the imaginary part). The second integral becomes func-<br />
tions gt2 and gt2i. The functions gtl and gtli are also used to integrate the<br />
third expression.<br />
6
When the geometry is as in kure 2, gcl and gcli are used to inhegrate (7).<br />
F’urther, for the case where s > 1. ft2(i) and ft3(i) are used forcases shown in<br />
fjgure 3 and4, respectively.<br />
9.1. Introduction<br />
Here, we explore a number <strong>of</strong> the phase mask imaging issues raised by<br />
Levenson’s work. The first question raised is how much the contrzst <strong>of</strong> periodic<br />
features depends upon defocus and the amount <strong>of</strong> phase shift used, and how this<br />
dependence changes with feature size. The second issue is what size defects in<br />
the phase shifting material may be tolerated. We also explore the possibility <strong>of</strong><br />
making clear field transitions between phases without causing printable defects.<br />
The hal issue is whether unprintable prosimity features may be used to<br />
enhance the image <strong>of</strong> isolated features.<br />
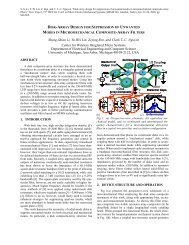
3.2. Results<br />
Image calculations <strong>of</strong> the new extension to SAMPLE indicate. tfit narkc!<br />
improvement in image quality possible in using phase-shift masks. Fignre 5<br />
shows the intensity pr<strong>of</strong>ile for a periodic series <strong>of</strong> lines and spaces 0.75 prn in<br />
width (in all simulations throughout this chapter the wavelength used i, 0.4355<br />
prn the lens has a numerical aperture <strong>of</strong> 0.28 and the defocus is 1.5 w.). Curve<br />
B is the image obtained with no phase shifting, and curve A is that obtained with<br />
every other space phase shifted 180’. The large improvement in contrast is due<br />
both to a decrease in the minimum intensity, as well as to an increase in the<br />
maximum intensity. This increase is due to the extra path difference!involved in<br />
the light from both images. The beams that arrived out <strong>of</strong> phase in conventional<br />
lithography now arrive in phase.<br />
7
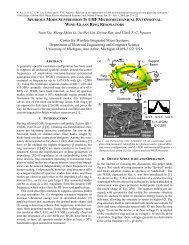
This improvement is quantified more Nly in fgures 6 through 9. In<br />
sure 8 we plot contrast ( ( I,--f~/(I-+f~-) ) vs. defocus for a partial<br />
roherence factor (sigma) <strong>of</strong> 0.7. Figure 7 shows the same thing for a sigma <strong>of</strong><br />
0.3. In both cases contrast is improved. The improvement is much greater for<br />
the lower sigma values, which is what we would expect from the mutual coher-<br />
ence function (MCF). This function gives the degree <strong>of</strong> correlation <strong>of</strong> the<br />
incident light as a function <strong>of</strong> distance across the mask. The width <strong>of</strong> its central<br />
lobe is equal to 1.22x/WAo. Since phase changes are significant only for phase<br />
related beams, the latger the central lobe <strong>of</strong> the MCF (caussd by a smaller<br />
sigma), the greater we would expect to be the effect <strong>of</strong> pha- .e shifts.<br />
Examining Qure 7 more closely, we see how the phase shifting not only<br />
increases the level <strong>of</strong> contrast, but also makes the contrast more focus tolerant.<br />
This graph clearly shows the steady improvement possible by increasing the<br />
phase shift up to 180". (However, we shall see later that we must pay a price for<br />
this.<br />
In figures '8 and 9 we now plot contrast vs. size, still for periodic<br />
sequences <strong>of</strong> lies and spaces. These curves show that for widths <strong>of</strong> less than 1<br />
pm, steady contrast improvement may be obtahed by increasing the phase<br />
shift. Above 1 pin proximity effects are lessened, and the two features are<br />
further apart than the diameter <strong>of</strong> the MCF. Therefore, little improvement is<br />
possible for features larger than 1 &m.<br />
Improvement in image quality, unfortunately, comes at the price <strong>of</strong> an<br />
improvement in defect-printability. In figure 10 we plot the image intensity for<br />
0.2 Fm wide 180" and 90" phase shift material defects on clear areas. This pro-<br />
duces surprisingly large ripples in the intensity, which may leave resist remain-<br />
ing on the wafer in what was supposed to be a clear area. For features this<br />
amall, however, the assumption <strong>of</strong> uniform intensity across the opening in the<br />
8
mas% made by the -image calculation algorithm, is not exactly true and these<br />
results only give an approximate indication <strong>of</strong> the problem for a 1X system.<br />
Defect printability may be reduced by using phase shifts <strong>of</strong> less than'<br />
180". This is shown in f3gures 11 and 12 where we plot, for sigmas <strong>of</strong> 0.7 and 0.3<br />
respectively, image intensity rninimum vs. defect size. Thus, by lowering the<br />
phase angle, defect printability may also be lowered. For comparison. the con-<br />
trast <strong>of</strong> an opaque defect is also shown in these Qures.<br />
The trade<strong>of</strong>f between defect printability and contrast improvement is<br />
summarized in 'figure 13. There we have plotted, vs. defect size, the phase which<br />
gives an intensity minimum <strong>of</strong> 0.5, which is the minimum tolerable intensity. We<br />
have also plotted the phase angle which gives periodic features a contrast <strong>of</strong><br />
0.85, which we have taken as the minimum allowable feature contrast. As an<br />
example, if we wanted periodic features 0.75 p m wide, we need at least a phase<br />
shift <strong>of</strong> 90°. Moving to the left untii we.hit the defect line, then dropping down<br />
we see that the largest allowable defect at that phase angle is 0.2 Fm.<br />
In a 2-dimensional mask, it would be desirable for all adjacent features<br />
to be out <strong>of</strong> phase with respect to each other. This is similar to the problem <strong>of</strong><br />
coloring a map with only 2 or 3 colors. Thus, it might be desirable to switch the<br />
phase <strong>of</strong> different parts <strong>of</strong> the same opening, that is, to color parts <strong>of</strong> the same<br />
country different colors. This type <strong>of</strong> phase transition, however, will cause a<br />
printable glitch as seen in figure 14. This Qure plots the phase shift depen-<br />
dence <strong>of</strong> the image intensity minimum <strong>of</strong> a large clear region next to a large,<br />
clear, phase shifted region. We see protlles for a 180" and 90" phase transition in<br />
@re 15. Obviously, this type <strong>of</strong> phase shift will cause a defect to print.<br />
We may reduce the contrast <strong>of</strong> this type <strong>of</strong> transition be making a smooth<br />
change in phase Over a small length. Figure 16 shows pr<strong>of</strong>iles for a 180" phase<br />
shift made smoothly (by making 12 steps <strong>of</strong> 15" each) over a length <strong>of</strong> 0.6. 0.9,<br />
9
and 1.2 pm. This reduces the contrast, but separating the Oo &d 180' regions<br />
by more than 1.0 prn defeats the purpose <strong>of</strong> having the phase transition. Thus<br />
even this smooth phase transition method is no good.<br />
The discussion <strong>of</strong> printing features up to now has involved periodic<br />
sequences <strong>of</strong> lines and spaces. Another use <strong>of</strong> the phase mask is to add non-<br />
printable features next to an isolated feature to enhance its image. Figure 17<br />
shows an attempt to improve the image <strong>of</strong> a .62 pm wide isolated line (this size<br />
was chosen 'because the intensity peak <strong>of</strong> the unenhanced image drops to one<br />
half the clear field value), Curves A through C are for t'ne line with a 0.3. 0.2, and<br />
0.1 pm wide 180" phase shifted proximity feature on each side. respectively.<br />
Curve I) is for the line by itself. The center to center distance between the line<br />
and the proximity feature is 1.15 pn in all cases. The maximum intensity <strong>of</strong> the<br />
line increases as the proximity linewidth increoses. and the peak becomes<br />
slightly narrower, making this a potentially useful technique.<br />
3.3. Conclusion<br />
We see, then, that phase masks may improve both periodic and isolated<br />
features. The size <strong>of</strong> periodic features may be reduced from 1.2 pm to 0.5 pm<br />
end still have a contrast <strong>of</strong> 0.85 by using phase shifts. This improvement is<br />
robust with respect to phase shift angle; 120' gives nearly as good results as<br />
180". Below 120", however, improvement does drop <strong>of</strong>f. The peak intensity <strong>of</strong><br />
isolated features may be increased 30 percent by using unprintable proximity<br />
features. This improvement decreases for phase shifts <strong>of</strong> less than 120 '.<br />
We have also seen that phase transitions above 90n will produce defects.<br />
nus, clear held transitions are not viable even when the transition is relatively<br />
smooth Another key problem is the printability <strong>of</strong> small defects. We have<br />
shown that a 90" defect prints about the same as an opaque defect, and shifts <strong>of</strong><br />
120" and 180" cause defects twice as small to print. With the limitations <strong>of</strong> no<br />
10
dear 'field transitions and proper defect control very significant improvements<br />
in aerial irnage quality are possible with phase masks.<br />
Not included within the SAMPLE program, but related to it, are a set <strong>of</strong> pro-<br />
grams witken by Shankar Subrarnanian for calculating 2 dimensional images.<br />
Programs for plotting contour plots and pr<strong>of</strong>iles <strong>of</strong> the images, written by this<br />
author, are also included. This chapter will outline the use <strong>of</strong> these programs.<br />
4.2. Running the Image Program<br />
Two versions <strong>of</strong> Shankar's imaging program exist. The program image.out<br />
calculates images with arbitrary defocus, while nodef.out calculates images with<br />
no defocus. 930th programs assume X = .436 pn , NA = 0.28, and have the same<br />
I/O format.<br />
' Each program reads 6 parameters, zs,zf,ys,yl,s,def, in free format from a<br />
file namedlines The &st four parameters specify the mask intznsity in the fol-<br />
lowing way. The mask intensity is assumed to be a separable function <strong>of</strong> z and y,<br />
Le.<br />
J(2.Y) =Xb)Y(y) (10)<br />
X(Z) has period zs + ~l, and Y(y) has period ys+yZ. The program defines X (z)<br />
in the first period as follows<br />
Y(z)<br />
I<br />
is dehed similarly. The parameter s is the partial coherence factor, and<br />
0 -(zs+21)/2 c 2 s -zs/2<br />
X(z> = [ 1 --2s/2 42s zs/2<br />
0 zs/2 czs (zs+zL)/2<br />
def is the defocus in pm. The program nodef.out ignores cf.!?f.<br />
11<br />
(11)<br />
The output <strong>of</strong> the programs is written to an unforrnatted file called M t ,<br />
which contains a 100 by 100 array <strong>of</strong> intensities, followed by the two parameters
dz and dy. These two parameters are the spacings between z and y points,<br />
respectively, in'units af ,A/ NA<br />
rint contains intensities for one .quadrant <strong>of</strong> one period <strong>of</strong> the image, which,<br />
because <strong>of</strong> the z and symmetry. contains all the information <strong>of</strong> the entire<br />
image. Tiht(1,l) is the intensity at the origin, &nt(1,100) is the intensity at<br />
(0, 99dgUNA) . Tint(100.1) is the intensity at ( 99dyh/ArA, 0). The interactive<br />
programs 'pr<strong>of</strong>ile and contour sets up a file <strong>of</strong> points called f77punch7 suitable<br />
for plotting with the SAMPLE plotting programs.<br />
4.3. How the Program Works<br />
The 2-D program uses the same partial coherence formulas as the 1-D case,<br />
except, <strong>of</strong> course. in two dimensions. This makes the geometry more compli-<br />
cated, since the circles C: and C' are no longer centered on the z axis.<br />
The main program calculates the Fourier coefficients <strong>of</strong> the mask.<br />
Currently, the method used is a speciflc one for the separable fgnction <strong>of</strong> z and<br />
I/ assumed. The rest <strong>of</strong> tbe program, however, does not require that<br />
simplification. Therefore, a more general routine for calculating Fourier<br />
coefficients could be added. The only requirement is that the intensity<br />
transmissibn be real, and periodic and symmetric in both z and y directions.<br />
After computing the Fourier coefficients, main calls spect, the subroutine<br />
which calculates the transform <strong>of</strong> the image intensity, performing many suma-<br />
tions similar to the 1-D case. 'The 'transmission cross-coefficients, now functions<br />
<strong>of</strong> four variables, are calculated by the function t, two versions <strong>of</strong> which exist.<br />
The file croas1.f contains the version for the no defocus case, while the general<br />
case is located in crdd2o.f, each <strong>of</strong> which requires several functions. The<br />
required modules are hain.f, crdss1.f (cross20.f). arc.f, rsect.l,inside.f, intf.<br />
12
and spec1.f.<br />
The run time for these programs varies roughly proportionally to the area<br />
<strong>of</strong> the image period. The program image.out requires about 20 CPU seconds on a<br />
VAX ,11/780 with UNIX per square micron, while nodef.out requires about half<br />
that.<br />
5. Acknowiedgement<br />
This work was supported by the National Science Foundation under grant<br />
ECS-8106234 and industrial contributions under the MICRO program (83-14).<br />
13
-14-<br />
Appendix 1<br />
Comparison <strong>of</strong> old and new SAMPLE images.<br />
The following table shows a comparison <strong>of</strong> the output for a periodic series <strong>of</strong><br />
0.75 pm lines and spaces calculated three different ways. First, using SAMPLE<br />
1.5b and input A, second using SAMPLE 1.5~ and input A, and third using SAMPLE<br />
1.5~ and input B. All images are identical, as expected.<br />
distance<br />
A<br />
0.000<br />
0.031<br />
0.061<br />
0.092<br />
0.122<br />
0.153<br />
0.184<br />
0.214<br />
0.245<br />
0.276<br />
0.306<br />
0.337<br />
0.367<br />
0.398<br />
0.429<br />
0.459<br />
0.490<br />
0.520<br />
0.551<br />
0.582<br />
0.612<br />
0.643<br />
0.673<br />
0.704<br />
0.750<br />
1.5b input A<br />
,220<br />
.221<br />
.225<br />
.231<br />
.240<br />
.251<br />
.264<br />
.280<br />
.298<br />
.319<br />
.342<br />
.367<br />
.393<br />
.420<br />
.449<br />
.4?7<br />
.505<br />
.533<br />
.558<br />
.582<br />
.602<br />
.619<br />
.633<br />
.642<br />
.647<br />
input k. proj .6<br />
lambda .5<br />
trial 3 1 0 1<br />
linespace .75 .?5<br />
run 1<br />
end<br />
intensity<br />
1.5~ input A<br />
.220<br />
.221<br />
.225<br />
.231<br />
.240<br />
.251<br />
.264<br />
.280<br />
.298<br />
-319<br />
.342<br />
.367<br />
.393<br />
.420<br />
.449<br />
.477<br />
.505<br />
.533<br />
.558<br />
.582<br />
.602<br />
.619<br />
.633<br />
.642<br />
.647<br />
1.5~ inputB<br />
.220<br />
.221<br />
.225<br />
.231<br />
.240<br />
.251<br />
.264<br />
-280<br />
.295<br />
.3 19<br />
.342<br />
.367<br />
-393<br />
.420<br />
-449<br />
.477<br />
.505<br />
.533<br />
.558<br />
.582<br />
.602<br />
.619<br />
.633<br />
.642<br />
.647<br />
input B: proj .6<br />
lambda .5<br />
trial 3 1 0 1<br />
trial 19 0 0.75 1 0 .?5<br />
run 1<br />
end
- 14a-<br />
Invoking the new SAMPLLE routines<br />
The new routines are invoked through the 'trial 19' statement. Its form is:<br />
trial 19 (ampl. phasel, distl). ... , (ampN. phaseN, distN )<br />
where amp, phase, and dist specify the amplitude and phase (in degrees)<br />
transrqission for a region <strong>of</strong> length dist. Up to 33 regions may be specified.<br />
The program then makes an even, periodic extension <strong>of</strong> this function It does<br />
so by first halving the length <strong>of</strong> the first and last regions. This now forms one<br />
half-period <strong>of</strong> the function. The other half-period is the mirror image <strong>of</strong> the<br />
first.<br />
For example, the statement,<br />
produces :<br />
I<br />
trial 19 1 180 .75 0 0 .5 10 .75 0 0 5<br />
I I
-15-<br />
Appendix 2<br />
The following is an input example for image.out The Ale lines contains the<br />
me line: 1.0 1.0 1.0 1.0.3 1.5 . Running image.out then contour, and plotting<br />
the &e fT7punch7 produces:<br />
-<br />
J<br />
E<br />
&<br />
9<br />
d<br />
P<br />
1 *.e<br />
0 .eo0<br />
0 06.0<br />
0 A00<br />
0 0200<br />
0.<br />
0. o.t.0 0.400 0.600 0.000 1 .m Distance (urn)<br />
These routines are currently located in the directory,<br />
/od/sample /#routy/Twodixu
16<br />
Running pr<strong>of</strong>ile and plotting f77punch7 produces:<br />
1 .e0<br />
0.808<br />
8.200<br />
e.<br />
CPL' time for calculating this image was 20 seconds.
-<br />
-17-<br />
'. Appendix3<br />
Comparison <strong>of</strong> Goodman and Subramanian<br />
The following table compares the intensity at the center <strong>of</strong> small isolated<br />
squares <strong>of</strong> different sizes. Goodman's program was run by this author while<br />
working at IBM Watson Research Center. As shown, Subramanian's program gives<br />
identical results.<br />
size A/ NA<br />
1.0<br />
0.8<br />
0.7<br />
0.6<br />
0.5<br />
0.4<br />
0.3<br />
Goodman<br />
1.10 t<br />
.94 t<br />
.77 f<br />
.57 =f<br />
.34 t<br />
.16 7<br />
.064<br />
Subramanian<br />
1.165<br />
.954<br />
.762<br />
.547<br />
.338<br />
.171<br />
.064<br />
t These numbers were extrapolated from a graph and are accurate only to<br />
*0.02.<br />
The followkg figure plots the intensity at the center <strong>of</strong> small opaque and<br />
small open squares and. for comparison, lines.<br />
1.2<br />
1.1<br />
1 .e<br />
.9<br />
.8<br />
.I<br />
.6<br />
.S<br />
04<br />
.3<br />
.2<br />
.1<br />
0.
-18 -<br />
References<br />
[l] M.D. Levenson, N.S. Viswanathan, Rk Simpson, "Improving Resolution in<br />
Photolithography with a Phase-Shifting Mask," IEEE Trans. Elect. Dev., vol<br />
ED-29 NO. 12. ~1828. 1982.<br />
[Z] H.H. Hopkins, Proc. R SOC. London Ser A, vol 217, ~405, 1953.<br />
[3] E.C. Kintner, "Method for the Calculation <strong>of</strong> Partially Coherent Imagery,"<br />
Appl. Opt., vol 17, p2747, 1978.<br />
[4] S. Subramanian. "Rapid Calculation <strong>of</strong> Defocused Partially Coherent<br />
Images," Appl. Opt., vol 20, p1854, 1951.<br />
[5] M. Prouty, A. Neureuther, "Optical Imaging With Phase Shift Masks,'' SPIE<br />
conference on Microlithography, 470-26, March 1954.
I<br />
Figure 1. Region <strong>of</strong> integration for equation (7)<br />
Figure 2 Region <strong>of</strong> integration for equation (7)
Figure 3. Region <strong>of</strong> integration for equation (7)<br />
Figure 4. Region <strong>of</strong> integration for equaLlull ;:)
m<br />
0<br />
00, co + a Lo d rc) N--<br />
- 0 0 O d d 0 0 0 0 0<br />
AlISN3lNI<br />
figure 5. Image intensity for a eriodic series <strong>of</strong> lines and spaces 0.75 pm<br />
wide, for no phase shift fB) and l8Oo phase shift (A).<br />
II<br />
b
0 00 a w- CV 0<br />
0 -<br />
0<br />
0<br />
0<br />
0 0 0 0 0<br />
lSWtllNO3<br />
Fuure 6. Contrast vs. Defocus for series <strong>of</strong> lines and spacps.<br />
m
0<br />
-<br />
a3<br />
0 0 0<br />
1SWl N 03<br />
Kgure 7. Contrast vs. Defocus for series <strong>of</strong> lines and spaces.<br />
cu<br />
0<br />
rr)<br />
0<br />
II<br />
b<br />
0<br />
0
0 -<br />
I1 IJ<br />
Q)<br />
e<br />
lSV~lN03<br />
Fiure 8. Contrast vs. Feature size for series <strong>of</strong> lines and spaces.<br />
n<br />
v9<br />
w<br />
-<br />
N<br />
v,<br />
W<br />
LL
E<br />
8-<br />
11 11<br />
rn<br />
3<br />
b o<br />
0<br />
Y-<br />
u) Tt .<br />
0 0<br />
Figure 9. Contrast vs. Feature size for series <strong>of</strong> lines and spaces.<br />
cv .<br />
0<br />
0<br />
0<br />
n<br />
v)<br />
w<br />
LL
0 00 - 0<br />
u3<br />
0<br />
AlISN31NI<br />
E<br />
=t<br />
mLn<br />
Flgure 10. Intensity pr<strong>of</strong>ile for 0.2 pm wide phase shift line defect.<br />
0<br />
+<br />
Q,<br />
D<br />
d cv<br />
0 0<br />
0<br />
0
0<br />
u)<br />
Figure 11. Intensity minimum vs. size for phase shift line defects.<br />
0<br />
0<br />
0
0<br />
m<br />
0<br />
(D<br />
I I I I I I 1 I 1<br />
UUnUUINlUU AlISN31NI<br />
Figure 12. Intensity minimum w size for phase shift line defects.
0<br />
00<br />
-<br />
0<br />
-<br />
0 0 0<br />
cu 6) (D<br />
319NW 3SVHd<br />
Fuure 13. Phase angle 'for necessary feature contrast and defect minimum as a<br />
function <strong>of</strong> size. u = 0.3.
0 -<br />
II / I<br />
I I I I<br />
a3 w d' cu<br />
0 0 .o 0<br />
Nnw I N I W AlISN31N I<br />
F'igure 14. Minimum intensity for clear field phase transition.<br />
0<br />
0<br />
0<br />
do
AlISN3lNI<br />
a w<br />
0 0<br />
cu<br />
0 0<br />
Figure 15. Image pr<strong>of</strong>lle for clear field phase transition. Phase shifting material<br />
is on the right hand side.
m<br />
Y<br />
L)<br />
mure 16. Image pr<strong>of</strong>iles for smooth 180° transition over a distance <strong>of</strong> 0.6 (A),<br />
0.9 (B), and 1.2 (C) pm.<br />
.<br />
m
E<br />
=t<br />
mln<br />
rn<br />
b 3<br />
0<br />
Y-<br />
Q)<br />
c3<br />
Figure 17. Image' pr<strong>of</strong>lles for 0.62 Frn line with 0.3 pm (A), 0.2 prn (B), 0.1 pm<br />
(C). and no (I)) 180" phase shifted proximity feature. Center to<br />
center distance is 1.15 Frn in all cases.
C<br />
C<br />
C<br />
c E.<br />
C<br />
C<br />
C<br />
C<br />
C<br />
C<br />
C<br />
sub1 ..utine clwtf i (ilmbd 1<br />
clmc.fi computes the diffraction limited fourier components POI.<br />
the vzrious ra~es. a maximum <strong>of</strong> 41 Frequencies is taken far the<br />
linespace and 41 frbequencies zre taken for line and for spdce.<br />
nota - each horizontal point is the center <strong>of</strong> a cell.<br />
(pr?jEction zItC.tem only. 1<br />
corn:, I ex Fcamsk ( 41 1, Fsaimg (1 1)<br />
com:n.ir, /cbwilici/ window, edge, wndorg<br />
cornrn~r~<br />
com:ntn /harimqi del tx, mnhpts, nmhpts, horint (50)<br />
/fouseri mxrmfr, nmfrcp, fsarnsk(411, fsaimg(41)<br />
comm!~n Iirnq2pi.l rna, mrnwtf, nmwtfc, rrntfwt(41)<br />
comin:~~ /img3pl-i iincoh, ipdrco~ ifulco, icoher, signa, dfdist corn~.'~ri /io1 i itei.;ni, ibulk, iprout, ircsvl, iin. iprint, ipunrh<br />
corr.:nrln /ob,~nski mlinc, rnEpace, mlnspa, mirreg, mask ty<br />
comrn:l,; 103 jn~;~/ r*lwl rsw, rjw2, rsw2<br />
cnm:r7:::i /optic i cui.i,jl, VlJ vmax, thorin(50)<br />
CQPQ-,~~~ /spectr/' mnlrnbd, nmlmbd, rlambd( 101, relint ( 10)<br />
cnm:r.-tii fcnosk/ nurni.e:pa am(100),phi(100), dsize(1001, zperid<br />
i.c st?t rn~xinum freqttcncy for coherent, partially coherent,<br />
/it -11- inc ohwC.::t case.<br />
ii: (iroher ~ 3 . iinc.oh) v:nar = 2. %rna/rlambd(ilmbd)<br />
ii: (~roher . eq. iparco) vmax = (rna/rlarnbd(ilmbd))+(l. +sigma)<br />
if orolrcr . 58 ifulco) vinax = rna/rlambd(ilmbd)
c<br />
C<br />
C<br />
C<br />
C<br />
C<br />
c<br />
C<br />
C<br />
C<br />
C<br />
c<br />
C<br />
C<br />
C<br />
C<br />
C<br />
/* ca!cula?e t.3e fourier coeifficents for the pattern<br />
450 call Foirrcf(. t.rue. , PSW~ rlw;'. T'SW~, rlw, fsamsk, mxnmfr, nmfrcp-1 1<br />
q 0 t ; ; r,:r+r)
L<br />
C<br />
C<br />
C<br />
C<br />
C<br />
20<br />
C<br />
10<br />
30<br />
C<br />
C<br />
40<br />
C<br />
1000<br />
C<br />
patperid<br />
p i-7. 14 1 5926<br />
w=2*pi/p<br />
convert degrees to radians<br />
do 20 i=I,nuarreg<br />
ong i >=phi ( i )/360. *2*pi<br />
. ...._.<br />
do 1030 n=l, wmc<strong>of</strong> x 130.<br />
x 24.<br />
reor9.<br />
a i mo-9.<br />
do 40 i=l,numreg<br />
~ 2 1 x rx 2 ( i 1<br />
rel=2+rm~i~+~sin~n+u~x2~~si~~n*~xl~~/~n*pi~<br />
reo=reo+rel+cos(ang(i) 1<br />
rimo=aimo+rel+iin(.ng(i))<br />
xl=xL?<br />
continue<br />
rcoeff (n+l)ncapIx(reo,.iIo)<br />
continue<br />
return<br />
end<br />
._ . .,'..,.T. .. . .- I .<br />
. -.
c<br />
c<br />
subr;vtine foi~rcf(lext8 rsl,TI&', ro2,rlf, d1,nsnutnc<strong>of</strong>)<br />
c 5<br />
C the t-ci~'rier coefficients for the mask amplitude transmission are<br />
C tal- *:at€d.
C<br />
C<br />
c 2.<br />
sub; -.:.tine p?~coZ(iIrnbd)<br />
C this Eubr is a modified version <strong>of</strong> Mike O'loole's subr parcoh.<br />
C It iicrs the values <strong>of</strong> rlw arid rsw calculated irl subr image<br />
C<br />
C<br />
to calculate the Fourier coeFficients for the mask amplitude<br />
tra:,r:~i~5ian (exterided as aw even periodic furrction if necessary)<br />
C and places ?hfn in the arrau ai(41). It then calls subr crus5<br />
C which calculates thF FouriFr coefficients for the image intensity<br />
C pattcrn and lrcves them in thc array spec(U1)<br />
C the cGrnmon blocks /trans/ contains ai(411, sprc(81), 5 (sigma),<br />
C n (cht number <strong>of</strong> spD.tia1 Frequency components (at most 40)),<br />
C and dl- (norrn.Jlised dcfocus).<br />
C<br />
(.<br />
comsi cx f samsk ( 41 1, f5aimg (4 1)<br />
comui~x ai(4i)s spec(U1)<br />
c om:p urI / c 3 w i rr ci i w i 1-1 d ow, e d 9 e, WII d or g<br />
corn;n-,fi-! /fouser/ mxnmfr, nmft-cp, fsamsk(41), fr;aimg(41)<br />
com~qn /hariaqi deltx, mnhptr., nmhptr., horint(50)<br />
com~:tn /ingf!o/' imgfl (5)<br />
com:a.r!i /jmg2pi-/ rna, mxnwtf, rimwtfc, rmtfwt(41 1<br />
comv:~*i /img3pt.i iincoh, iparco, ifulco, icoher, sigma, dfdist<br />
cornn:;~.~ /io1 i itarmi, ibulk, iprout, iresvl, iin, iprint, ipunch<br />
com;7,;:ri /optic i curt((l. +r!l'p)<br />
if !I: . It. 4\11 goto 100<br />
I ' -<br />
'0
z<br />
c:'<br />
C<br />
C<br />
100<br />
/* tw5y 15 thcre no check for. ni=O? march 25, 1981)<br />
/it tht Fourier coefficients for the mask amplitude transmission<br />
/+ i.1'- now caicu1atr.d.<br />
if ta.:-skty. e?. 5) call cFour(ai,n)<br />
if (n:..skty. e? 2.) golo 101<br />
call<br />
kour.cF(. Palse. , rsw, 1.1~12, i.si&J rlw# si, 41J n)<br />
call crc155<br />
or i '1 I I:= ( --r s w/d -e d 9 e 1 /r p er<br />
i + ( m i = k t y . e q. m 5. p a c e 1 or i Q i n= ( 1. sw/2. -e d g e ) /r p er<br />
i f ( m.-, e k t y . e q. m i r r e 9 ) OP i g i n= ( T' p er +r l w 1 /2. 0-e d g e 1 / r p i.r<br />
aftn;=kty. eq. 5) ai-igin = (j~.ize(l)/2..rdge)/rp~~.<br />
X=QI I .-, i ri<br />
n2 et;<br />
de 1 ti!- window/ i nmhp te,--l) *rper 1
C<br />
t<br />
C I<br />
subcoutine cross<br />
-_ .-- __- - --_ -<br />
-<br />
f<br />
commn /iapQl / iapert, isquare icirc<br />
common /trans/s, n, p, df, ii(4l)r spae(81)<br />
comean /Qig/P, g<br />
complex ai(41), rpec(81)<br />
cornpiex fac<br />
external gcl, gtl, gt2, ft2, ft3<br />
external gcli, gtli, gt2ic ftZi, Qt3i<br />
C<br />
C /* set all elements oQ spec to zero<br />
do 1 .iL-1,81<br />
SP'C (j)=(O. 0.0.0)<br />
C<br />
c??<br />
1 contirvuc<br />
specc&)=ai(l)uconjg(ai(l))<br />
p i 4 34159265558<br />
p iZrp i 12.<br />
/* ciFcular and square pupils me handled separately<br />
/* the following line was present in a previous version.<br />
c??<br />
c??<br />
C<br />
/w whtt? (march 31, 1981).<br />
if (n. eq. 0 ) return<br />
if (ispert. eq. i squar) goto 66<br />
i9 (r.spert. ne. icirc) return<br />
/w set, amax, the mox. area <strong>of</strong> ovwlap<br />
amaz L. s*s+pi<br />
if (5. gt. 1. 1 aaax=pi<br />
C /w for circular pupils 131 and s
.c?? /* whu doesn't the rtrnt for ac3 h8v8- the bias oP O.-OOOl 3<br />
ac4 = .cos(d2~(s+O.0001))<br />
Call g.USS(gt1, 8Cfr 8C218lt)<br />
- call grUciS(gt2. 8C3, aC4,82t)<br />
t (slt 482t)fi2./amax<br />
calf g~ur,r(gtli~~cI,~~Z~~fti)<br />
call gauss(gt2ir ac3, ac44 a2ti)<br />
ti = (alti +a,3ti)*2./arnsx<br />
5 spec (l+j)=con jg (ai( 1) )*ai( j+1)*2. *cmplx (t, ti)<br />
3 contirue<br />
C /* the nested do loops that follow make single sum series out<br />
C /+ <strong>of</strong> the double sum series<br />
do 1 ;=I,,<br />
e=J*D<br />
do 4 k=frJ<br />
gr)r*,l<br />
tf =-ZJ<br />
ta =i:.<br />
tli =-?.<br />
t2i ~2.<br />
C /w calculate tl and t2. in qeneral. integrate OYCP three<br />
c /w circles. in some cases the limits UP integration are<br />
C /* are the ssme Qor an integral. this io because the<br />
c /* reqion <strong>of</strong> integration does not include that mea.<br />
e /w this depends on the values <strong>of</strong> f and g.<br />
C /* eo..rt tl<br />
altt =-om<br />
a2tl =o.<br />
a3tl -0.<br />
altli =O.<br />
o2tli =O.<br />
a3tli =Q.<br />
C /* if (f+g).qc 2 C' and C" don't intersect and t14.<br />
if((t'+g).ge.s !goto 25<br />
C /w set the limits for integrating over C 'tC and C" for tl<br />
a1 = r-1.<br />
a2 =
C<br />
C<br />
C<br />
C??<br />
C<br />
C<br />
C<br />
C<br />
C<br />
24<br />
28<br />
25<br />
/* br zero - __.____<br />
a2 = if-9)/2.<br />
a3 = a2<br />
/w transform limits<br />
acl = rcoo(f-el)<br />
ac2 = ecos(f-e2)<br />
irc3 = acoo(a3ls)<br />
/* s is incrmsed by 0.0001 to keep the 8rpument to COS .Xe. 1 .<br />
/it (march 318 1981) why does the above stmt for re3 not have it?<br />
ac4 = acos(a2/(s+O. 0001))<br />
ac5 = acos(a4 +g)<br />
acb = acos(a3 + g)<br />
/* iqtegrate over C',C & C"<br />
gtl celculates the integral over C'. The reel part <strong>of</strong> the<br />
integral over C" uses the same function, but the<br />
imaginary part uses the negation. Hence the switching<br />
<strong>of</strong> the limits <strong>of</strong> integration in calculating the imaginary<br />
part <strong>of</strong> t he integral over C".<br />
nw,<br />
call causs(gt1, aclIac2,altl)<br />
call oou.ss(gt2. ac3, ac41 eat11<br />
call G S U S S ( ~ ac5,acb8a3tl)<br />
~ ~ ~<br />
tl Firltl + a2tl + a3tl)/amax<br />
call oauss(gtii, aclI a628 altli)<br />
call qa~s5(gt2i,ac3~oc4, a2tli)<br />
call aauss(gtli,acbIac5,a3tli)<br />
tli =(altli f a2tfi + a3tli)/amax<br />
got:) 25<br />
call oauss(gclI 0. I pi21 tl)<br />
tl = tl/amax<br />
call oauss(gcli,O. ,pi28 tli)<br />
tli = tlj/amsx<br />
/* heie calcglete t2<br />
/* if (f-g).ge 2 C' 8t C" don't intersect.<br />
if(if-g).ge.2 )goto 10<br />
/* 2' is centred at f I Cy at g. g . le. f so if 9. la. (l.-s) C is<br />
/* inside both C' & C". In all cases there's no integral over C".<br />
if ! F. le. (1. -5) 1 goto 29<br />
/* if f. le. (1. --SI C i5 inside C' & em.<br />
a 1 tZ= 0.<br />
a2tZ- P.<br />
a3 td= 0.<br />
a1 t2i -0.<br />
aZt2i=O.<br />
a3t2i=Q.<br />
a1 = f-1.<br />
a2 = ((.+.-1. )/f + f)/;t.<br />
if(9. gt. (1. -s))goto 26<br />
81 * -8<br />
a2 = -8
!<br />
(<br />
26 a3 =s<br />
I-p-__<br />
c??<br />
acl = scos(Q-et)<br />
8C2 8COS(9-82)<br />
/* (march 3 1 8 1981) .gain uhy no bi88 09 0.0001 to 8 9or oc3 3<br />
c<br />
c<br />
c<br />
ac3 =acos(r3/r)<br />
ac4 = rcos(a2/(~+0.0001~) . I<br />
/* the same Punctionr that wet* used 8s integrands +or tl 8re<br />
/* used here. since C" is now centred et g and not at -g put g=-g<br />
/* before integrating and change g back to it's previous value by<br />
I C /* 9"-9<br />
g =-.- 9<br />
call aausr(gtlB acl, ac2, alt2)<br />
I call osuss(gt2. ac3, ac4~ a2t2)<br />
call qauss(gtli,aclJec2~alt2i)<br />
call gauss(gt2rl ac3, ac4, a2t2i 1<br />
9"'::<br />
t2 = (aft2 + i?Zt2)/amax<br />
t2i (rlt2i f a2t2i)/amax<br />
goto 10<br />
29 g=-g<br />
call oauss(gcJ, 0. J p i 2 t2) ~<br />
t2 = i2iamax<br />
call causs(gcli,O. ,pi28 t2i)<br />
t2i = t2ilamex<br />
g '-2<br />
10 fac=ai (J+1 )+con Jg (ai (k+I 1 )/2.<br />
tl =z +tit<br />
f-<br />
ta = ;..*ta<br />
tfi ~ 2 *tli .<br />
t2i = ?.+t2i<br />
ml= i+k<br />
m2=1-Y<br />
if !mL.eq.O) qoto 113<br />
tis:? K t 1<br />
C<br />
t2fl E t 2<br />
tli-? *tli<br />
tzi--:t *t:Ji<br />
1 3 spec(l+ml)==spec(l+ml)+fac*crnp x(,,, i)<br />
spec (I+m;l)=spec (X+m2)+fac*cmplx (t2, t2i)<br />
4 contivue<br />
retu: :?<br />
/* whst Follows is for a circular pupil with s>l<br />
41 do 2 .1=1,n<br />
f= J*P<br />
g =o.<br />
t =o.<br />
tid.<br />
C<br />
if(f. oe.2. IgDto 2<br />
/* integ~ate over C' int C"i C" centred at 0.<br />
acl =acos(f/2 1<br />
call gauss(gt1, 0. , ecl~ t)<br />
t=4. *t/pi<br />
call gaurs(gtlir0. # acl~ ti)<br />
ti=4. *ti/pi<br />
SpeC(~+J)fCOnJg(.i(i))+ri(J+1)~2.+Cmp1X(trti)<br />
2 continue<br />
do 14 J=l,n<br />
frJ*P<br />
do 14 k=lrJ<br />
a=k*p<br />
. .<br />
. . .~ -,,. . .<br />
. -. .<br />
_ ..._.
C<br />
C<br />
C<br />
C<br />
C<br />
C<br />
c ??<br />
11<br />
12<br />
13<br />
100<br />
--_ -_ -_ - -- __ . -<br />
-- -<br />
7* finding tl end t2<br />
tl =o.<br />
ti! -0.<br />
.It2 so.<br />
aZt2 -0.<br />
r3t2 so.<br />
tli e.<br />
t2i 4.<br />
d1tZi fO.<br />
a2tTi =O.<br />
a3t2i SO.<br />
if ((F+g).ge.2. 1 goto 11- - .- - - - _ -<br />
/* chccked to see if C' and C" intetsecti if not goto 11 and<br />
/U c~.?culate t2<br />
acl = acos((f+q)/2.)<br />
C a l l GaUSS(gt1, 0. , aC1~ t1)<br />
tl I'.*tl/pi<br />
tli :- 0.<br />
/* calculate t? here<br />
if((f-9). ge.2 )goto 100<br />
if(!q+l. 1. gt. slgoto 12<br />
/* 17tt C' C" is inside C<br />
acl=scos((f-q)/2. 1<br />
call aauss(ft2.0. , acl, t2)<br />
t2 = 2 . *t2/pi<br />
t2i = 0.<br />
goto 100<br />
/* Int C' C" is not all inside C<br />
a2 = (f49)/2.<br />
a3 = ((s*s-l. )/g +g)/2.<br />
if(a2 It. a3)ooto 13<br />
a2=I!s*s-l. )/P +f)/2.<br />
a3 2 22<br />
acl = dcootf-02)<br />
ac2 = acos(a2-g)<br />
(march 31, 1931) again why no bias <strong>of</strong> 0.0001 to s for ac3 ?<br />
ac3 =- acos(a3-9)<br />
ac4 = acos(a3/( o+O. 0001 1)<br />
call oauss(ft2.0. acl, alt2)<br />
call cia~ss(ft2~ ec3, ac2, a2t2)<br />
call oauss(ft3, 0. 8 ac4, a3t2)<br />
t2 c(alt2 + a2t2 + a3t2)/pi<br />
call gauss(ft2i.O. ,acl,alt2i)<br />
call gruss(ft2i. ac2, ac3, a2t2i)<br />
call aaurr(ft3i,O. ,acS,r3t2i)<br />
t2i =;(alt2i + a2t2i + ;r3t2i)/pi<br />
frc"ai(J+l)*coqjg(ai(&+~))/2.<br />
tl =2 *ti<br />
t2 = 2.+t2<br />
tli =Z.+tli<br />
tai = 2.*t21<br />
ml=J+k<br />
m2= J-- t<br />
iP(mn2 eq.0)goto 114<br />
t1-2. *tl<br />
t2e. *t2<br />
tli=2 +tli<br />
1 -<br />
t2i=2. *t2i<br />
- - - ----<br />
i+ ~ L- -<br />
I .u; .* . \,-. __? , A- . __ . , .
I<br />
t<br />
-<br />
114 ~pec~l+ml~=~pee~l+~l~+rlc+crplx~tl,~t~~~<br />
~pecil+cn2~=~pcc~l+~~+fac*c~plx~t2,t2i~<br />
14 continue<br />
return<br />
C /* the rest is ?or square pupils<br />
66 s2 9s<br />
if(?;. gt. 1. 1 s2 -1.<br />
amax= 4. +s2*~2<br />
do 82 J'1,n<br />
faJ*P<br />
t=O.<br />
if(f. 9.. 2. )goto 51<br />
C /+ set the limits 00 integration a1 8nd a2<br />
al=f -1.<br />
a2 L 52<br />
if((5. It. 1. ).and. (9. lt. (l.-S)))al=-s<br />
c /w if df is zero the integral for t is different.<br />
if (d9. eq. 0. )goto 50<br />
t = 2 *s2*,(sin(df+f*(o2-f/2.)) -sin(df*9*(ob-9/2. )))/(df+9+anrr)<br />
gOtQ 51<br />
50 t = 3 *s2+(a2-a 1) /amax<br />
51 spec(l+~)=ai(t)+ai( j+1)*2. +t<br />
8% continue<br />
do YS J"I,n<br />
f=J*P<br />
do 84 b=t, J<br />
g=k*p<br />
t /* calculate tl and t2<br />
tl = ?.<br />
if((f+g). ge.2 )goto 52<br />
C /* at 52 find t2<br />
81 = f-1.<br />
- a2 =:I- -9<br />
if (5 ge. 1. ) ooto 53<br />
if (f le. (1. --I) 1 al=-s<br />
if !a le. (l.-s)) a2= s<br />
53 if (df. ne. 0. 1 tl = 2. +s2+(rin(dQ+(f+g)~(2. *a2-f+g)/2. 1<br />
* -sin (d 9+ f+g )*(Z. +al-f +g 1 /2. 1 1 / ( df+( f+g )+ami x<br />
if (df. eq. 0. 1 tl = 2. fis2*(a2-al)/amax<br />
E /W calculate t2<br />
52 t24.<br />
if((f-0). ga.2. )goto 54<br />
a1 =f-1.<br />
iQ((f. It. (1. 1. rnd. (8. It. 1. )).l=-s<br />
=3+1.<br />
if(a2 gt. .)a2 = s<br />
if(s. It. 1. 1.2 s<br />
if((df. ne. 0. 1. and. (9. ne. g))t2=2. *s2*(sin(d~*(f-g)+(2. +a2-+-g)/2. 1<br />
-sintdP*(f-gl*(2.+al-f-g)/2. ))/(df*(P-g)*aa81)<br />
4.<br />
if((df. eq.0. 1. or. (f. ep. g))t2 = 1. *s2*(&-all/amax<br />
if((f+g). ge.2. )tl=O.<br />
54 fac=ai (J+l )+ai ( k+1)/4.<br />
mi= J+k<br />
&= J-k<br />
if(n2 eq.O)goto 143<br />
t1e *tl<br />
- ...a* ,-. .<br />
t2e *t2 - - --<br />
- i_- r , ._ __ - -<br />
L. .
I<br />
L<br />
I<br />
C P<br />
C<br />
c f<br />
C<br />
cf<br />
C<br />
CP<br />
C<br />
143 sp.c(i+mii-spec (1+n1)+~ac*2. +t1<br />
specil+m2)=rpec (l+m2)+Qec*2. +t2<br />
t14.<br />
t2 = c.<br />
84 continue<br />
retutn<br />
end<br />
function ft2(x)<br />
_ _<br />
. . . - . . . . -<br />
ft2 = 0. S*Xl. COS(^ *~))*~0~(df*(f-g)*(2. +cos(x)-$+~)/~.<br />
1<br />
return<br />
end<br />
funct:on ft34x)
C<br />
cf<br />
C<br />
gtli = 0. 5*(1. -cos(2. *x)l*sin(O. 5*df*(f+p)+(2. *cos(x)-f-g))<br />
return<br />
end<br />
function gt2i(x)<br />
comman /trans/s,n#pI df,ai(41),sprc(81)<br />
cornan /fig/f# g<br />
complex si(41)# spar(81) _- --- 1<br />
gt21 = 0. S+s*s*(l. -cos(2. *x))*rin(-O. S*df*(f+g)+(2. +r*cos(x)-f+g))<br />
return<br />
end