J17

Create successful ePaper yourself
Turn your PDF publications into a flip-book with our unique Google optimized e-Paper software.
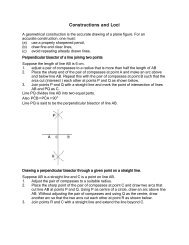
Range of values (Use graph of example 2.18)<br />
Example<br />
Find the range of values of x for which the function x 2 – 3x + 2<br />
(a) is negative,<br />
(b) is less than (x + 2),<br />
(c) is greater than 1.<br />
Solution<br />
(a) x 2 – 3x + 2 is negative (i.e. below the x-axis) for values of x from 1 to 2. The range<br />
is 1 < x < 2.<br />
(b) x 2 – 3x + 2 is less than x + 2 (i.e. below the line y = x + 2) fro x = 0 to<br />
x = 4, i.e. 0 < x < 4.<br />
(c) In the given domain -1 ≤ x ≤ 4, the function x 2 – 3x + 2 is greater than 1 in two<br />
ranges:<br />
From -1 to 0.4 and from 2.6 to 4,<br />
i.e. -1 < x < 0.4 and 2.6 < x < 4.<br />
Intersecting graphs<br />
Example<br />
Draw the graph of y = 1 + x – 2x 2 , taking values of x in the domain -3 ≤ x ≤ 3.<br />
Using the same scale and axes, draw the graph of y = 2x – 5.<br />
Use your graphs to answer the following questions:<br />
(a) What is the maximum value of the function 1 + x – 2x 2 ?<br />
(b) Write down the x-coordinates of the points of intersection of the functions y = 1<br />
+ x – 2x 2 and y = 2x – 5. Show that these values of x satisfy the equation 2x 2 + x<br />
– 6 = 0.<br />
Table of values for y = 1 + x – 2x 2<br />
x -3 -2 -1 0 1 2 3<br />
1 1 1 1 1 1 1 1<br />
x -3 -2 -1 0 1 2 3<br />
-2x 2 -18 -8 -2 0 -2 -8 -18<br />
y -20 -9 -2 1 0 -5 -14<br />
Table for y = 2x – 5<br />
x -3 0 3<br />
y -11 -5 1<br />
When plotted, a curve and a straight line as shown in the figure below are obtained.