J17

You also want an ePaper? Increase the reach of your titles
YUMPU automatically turns print PDFs into web optimized ePapers that Google loves.
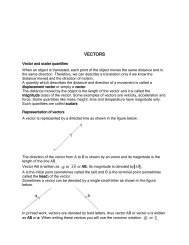
Graphical solution of equations<br />
(Use the graph of example 2.18)<br />
(a)<br />
The curve is the graph of function x 2 – 3x + 2. It crosses the x-axis at points where<br />
x = 1 and x = 2, i.e. these are the points on the curve for which y = 0.<br />
In short, y = 0 when x = 1 and x = 2.<br />
i.e. x 2 – 3x + 2 = 0 when x = 1 and also when x = 2.<br />
Therefore x = 1 and x = 2 are the solutions of the equation x 2 – 3x + 2 = 0.<br />
In general, if y = ax 2 + bx + c, the solutions of ax 2 + bx + c = 0 are the values of x at<br />
the points where the curve crosses the x-axis.<br />
(b) Use the above graph to solve x 2 – 3x + 1 = 0<br />
Equation to be solved is x 2 – 3x + 1 = 0<br />
i.e. x 2 – 3x = -1<br />
substituting x 2 – 3x = -1 in the equation of the curve y = x 2 – 3x + 2,<br />
we get y = x 2 – 3x + 2<br />
= -1 + 2<br />
= 1.<br />
We need the points on the curve when y = 1. Draw the line y = 1 on the same<br />
axes. The values of x at the points of intersection of the line and the curve are the<br />
solution of the equation.<br />
From the graph, values of x are 0.4 and 2.6.