J17

Create successful ePaper yourself
Turn your PDF publications into a flip-book with our unique Google optimized e-Paper software.
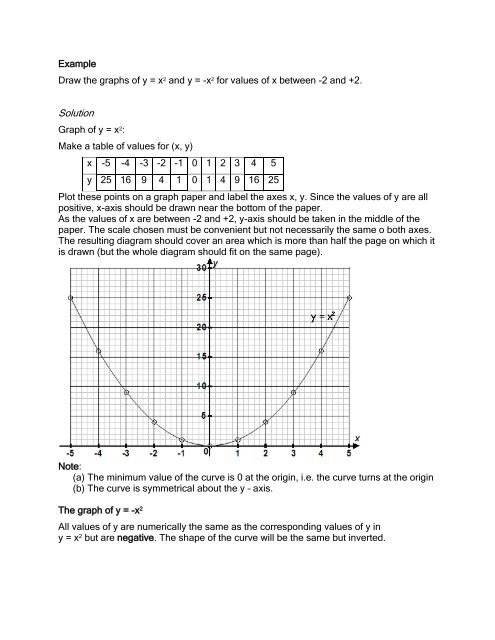
Example<br />
Draw the graphs of y = x 2 and y = -x 2 for values of x between -2 and +2.<br />
Solution<br />
Graph of y = x 2 :<br />
Make a table of values for (x, y)<br />
x -5 -4 -3 -2 -1 0 1 2 3 4 5<br />
y 25 16 9 4 1 0 1 4 9 16 25<br />
Plot these points on a graph paper and label the axes x, y. Since the values of y are all<br />
positive, x-axis should be drawn near the bottom of the paper.<br />
As the values of x are between -2 and +2, y-axis should be taken in the middle of the<br />
paper. The scale chosen must be convenient but not necessarily the same o both axes.<br />
The resulting diagram should cover an area which is more than half the page on which it<br />
is drawn (but the whole diagram should fit on the same page).<br />
Note:<br />
(a) The minimum value of the curve is 0 at the origin, i.e. the curve turns at the origin<br />
(b) The curve is symmetrical about the y – axis.<br />
The graph of y = -x 2<br />
All values of y are numerically the same as the corresponding values of y in<br />
y = x 2 but are negative. The shape of the curve will be the same but inverted.