J17

You also want an ePaper? Increase the reach of your titles
YUMPU automatically turns print PDFs into web optimized ePapers that Google loves.
0<br />
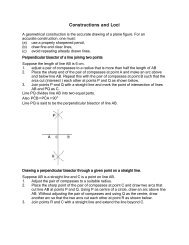
17. In a right angled triangle PQR, ∠ Q = 90 , QR = x cm, PQ = (2x – 2) cm and PR =<br />
30 cm. Find x.<br />
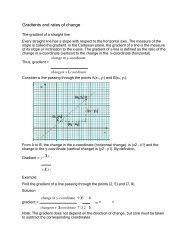
Table of values for a given quadratic relation<br />
To draw a curve y = x 2 – 2x – 6 for the values of x between -3 and 5, we prepare<br />
a table of values in the following way:<br />
x -3 -2 -1 0 1 2 3 4 5<br />
x 2 9 4 1 0 1 4 9 16 25<br />
-2x 6 4 2 0 -2 -4 -6 -8 -10<br />
-6 -6 -6 -6 -6 -6 -6 -6 -6 -6<br />
y= x 2 – 2x - 6 9 2 -3 -6 -7 -6 -3 2 9<br />
The points (-3, 9), (-2, 2), (-1, -3), (0, -6), …, (5, 9) are then plotted on a graph<br />
paper and joined by a smooth curve.<br />
Alternatively, to find the y-coordinates we can substitute the values of x in the<br />
equation y = x 2 – 2x – 6 in the following way:<br />
when x = -3, y = (-3) 2 – 2(-3) – 6 = 9 + 6 – 6 = 9,<br />
when x = -2, y = (-2) 2 – 2(-2) – 6 = 4 + 4 – 6 = 2<br />
when x = -1, y = (-1) 2 – 2(-1) – 6 = 1 + 2 – 6 = -3, e.t.c.<br />
Graphs of quadratic functions<br />
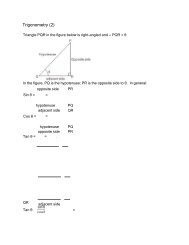
Quadratic function<br />
‘y is a function of x’, i.e. for every value assigned to x, there is always a<br />
corresponding value of y. Then these pairs of values of x and y can be plotted and a<br />
distinctive graph, a curve or a straight line, will be obtained. This is, in fact, the graph of<br />
the function.<br />
If the function is of the first degree, of which the general form is y = mx + c, then it is<br />
called a linear function and the graph is a straight line.<br />
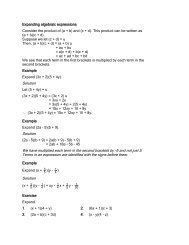
The expression ax 2 + bx + c, where a, b and c are constants, is called a quadratic<br />
function of x or a function of the second degree (highest power of x is 2). If such an<br />
expression is plotted against x, the resulting curve will have one of the shapes shown<br />
below.<br />
The coefficient of x 2 determines which way up the curve is.