file - Institut für Photogrammetrie und GeoInformation
file - Institut für Photogrammetrie und GeoInformation
file - Institut für Photogrammetrie und GeoInformation

You also want an ePaper? Increase the reach of your titles
YUMPU automatically turns print PDFs into web optimized ePapers that Google loves.
GENERATION AND ANALYSIS OF DIGITAL SURFACE MODELS (DSMS) IN URBAN<br />
AREAS BASED ON DMC-IMAGES<br />
A. Alobeid, K. Jacobsen<br />
<strong>Institut</strong>e of Photogrammetry and <strong>GeoInformation</strong> , Leibniz University Hannover<br />
Nienburger Str. 1, D-30167 Hannover, Germany<br />
[Alobeid, Jacobsen]@ipi.uni-hannover.de<br />
Commission IV, WG IV/9<br />
KEY WORDS: Digital, Matching, DEM/DTM, Aerial, Accuracy, Quality<br />
ABSTRACT:<br />
DSMs are a geometric description of the height of the visible terrain surface, including elements like buildings and trees. DSMs<br />
became an important source for scene analysis and for 3D feature detection and reconstruction. The digital metric camera (DMC)<br />
offers excellent image quality and can be used for automated DSM generation, with high accuracy. By using least squares matching<br />
as method to find corresponding points in two overlapping images for three dimensional reconstructions, the corresponding points<br />
potentially can be determined with sub-pixel accuracy. The investigation of the influence of different parameters on generating<br />
DSMs from DMC images is shown like the limitation of automatic DSM generation in urban areas.<br />
The aim of our investigation is, whether the selected parameters for image matching, optimized in few test areas, can be used for the<br />
whole study area. The generated DSM was checked against a reference DSM based on manual measurement. The comparison shows<br />
that the accuracy mainly depends on terrain slope and surface structure. Furthermore, satisfying DSMs strongly depend upon the<br />
quality of the DMC-images.<br />
A standard deviation of the DSM based on DMC-images in whole urban study area of 1.0 up to 1.3 GSD is possible, corresponding<br />
to 0.3 up to 0.4 GSD for the x-parallax.<br />
1. INTRODUCTION<br />
Automatic 3D city models and its update got an increasing<br />
interest in recent years, requiring the development of automatic<br />
methods for acquisition of DSMs. 3D information in urban and<br />
suburban areas are very useful for many applications, such as:<br />
- Change detection<br />
- GIS database updating<br />
- Urban planning<br />
- 3D feature extraction<br />
In principle stereo images are sufficient for 3D feature<br />
extraction for objects such as buildings. However due to the<br />
complexity of details, many problems were fo<strong>und</strong>. Grey values<br />
are influenced by the object geometry but also by many factors<br />
such as shadows, reflections, saturation, lack of texture, noise<br />
and others.<br />
It is very difficult to separate important information from<br />
irrelevant details in generating DSMs in build-up areas. In spite<br />
of high degree of automation in several commercial programs,<br />
used for DSM generation, a significant effort is still required for<br />
accuracy improvement, especially in the difficult urban and<br />
forest areas. The aim of our investigation was to investigate the<br />
influence of different parameters on generating DSMs based on<br />
Z/I Imaging DMC-images in urban areas. In addition the use of<br />
the selected parameters for other areas has been investigated.<br />
2. AVAILABLE DATA AND STUDY AREA<br />
The investigations have been made in the area of Frederikstad,<br />
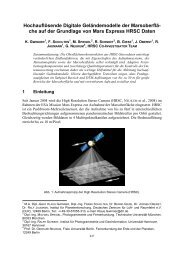
located close to Oslo, Norway. The Digital Metric Camera<br />
(DMC) images are composed of 4 slightly convergent high<br />
resolution panchromatic sub images, mosaicked together<br />
(see figure 1). The convergent camera arrangement guarantees a<br />
very uniform image quality up to the image corners, no lower<br />
resolution in the corners could be detected by edge analysis.<br />
This is different for digital cameras based on nadir view for all<br />
sub-cameras (Jacobsen 2008).<br />
Fig.1 Configuration of panchromatic DMC sub-cameras<br />
The images are available with a gro<strong>und</strong> sampling distance<br />
(GSD) of 9.4cm having 60% endlap and 75% side lap. The<br />
horizontal coordinate components of well defined object points<br />
have a standard deviation of approximately 2-3cm and the<br />
vertical component of approximately 7cm.
3. IMAGE MATCHING AND INVESTIGATION<br />
For the automatic image matching of the DMC-images the<br />
Hannover program DPCOR has been used, which is based on<br />
least squares matching. The approximate corresponding image<br />
positions are determined by region growing, published by<br />
(Heipke 1996). Object coordinates are computed by<br />
intersection.<br />
Input DMC-images<br />
Determination of seed points<br />
Image matching by least squares matching<br />
Transformation of pixel to photo coordinates<br />
Computation of gro<strong>und</strong> coordinates by intersection<br />
with tolerance limit for y-parallaxes<br />
No<br />
Errors in<br />
3D-view<br />
Final digital surface model<br />
Yes<br />
Analysis and error elimination<br />
Figure 2 workflow of matching procedure<br />
Figure 2 shows the work flow of the data handling. It mainly<br />
has following steps:<br />
• Manual measurement of few seed points if not enough<br />
control points already available; the number of required<br />
seed points depends on image similarity and decrease with<br />
smaller time difference of taking the both images of a<br />
stereo model.<br />
• Automatic matching in image space by least squares<br />
method.<br />
• Transformation of pixel to photo coordinates<br />
• Computation of gro<strong>und</strong> coordinates by intersection.<br />
• Generation of Digital Surface Models (DSMs), 3D view,<br />
contour lines, visual inspection.<br />
The point spacing of matching can be specified in the used<br />
program DPCOR. By default every third pixel in line and also<br />
column direction will be matched. A matching of every pixel<br />
leads to high correlation of neighboured points.<br />
Figure 3 shows an example of matched points in an urban area,<br />
which leads to a very dense DSM. The small separated building<br />
with some trees aro<strong>und</strong>, did not lead to a clear building shape.<br />
Dark parts, caused by shadows, may lead to gaps.<br />
Figure 3 overlay of matched points to DMC-image<br />
(Matched points = white<br />
dark parts or marked in red = matching failed)<br />
Following situations may cause problems of image matching:<br />
- Smooth and sleek surfaces<br />
- Poor or no texture<br />
- Occlusion<br />
- Moving objects<br />
- Surface discontinuities<br />
- Shadows<br />
- repetitive objects<br />
This may cause failed matching or reduced matching accuracy.<br />
Because of expected problems, the investigated area has been<br />
separated into two classes:<br />
• Open area – not disturbed by remarkable vegetation<br />
and buildings<br />
• Area with man-made objects and trees<br />
Forest areas were not included.<br />
Open area:<br />
The first investigation has been made with different settings –<br />
the tolerance limit for the correlation coefficient (R) has been<br />
varied between 0.7 and 0.9; the step width of matching mainly<br />
was 3 pixels in each direction, but also 1 pixel step width has<br />
been used; finally the window size of the sub-matrix for<br />
matching has been changed from 10 x 10 to 5 x 5 pixels.<br />
parameters<br />
matching success<br />
R= threshold for accepted correlation<br />
R = 0.70 , Step width = 3<br />
sub-matrix 10 ×10 pixels<br />
87%<br />
R = 0.80 , Step width = 3<br />
sub-matrix 10 ×10 pixels<br />
84%<br />
R = 0.90 , Step width = 3<br />
sub-matrix 10 ×10 pixels<br />
75%<br />
R = 0.80 , Step width = 1<br />
sub-matrix 10 ×10 pixels<br />
85%<br />
R = 0.80 , Step width = 3<br />
sub-matrix 5 ×5 pixels<br />
62%<br />
Table1: Matching completeness in open area depending upon<br />
chosen parameters<br />
In open areas with sufficient object texture, the image matching<br />
has no problems. However, some problems are caused by<br />
missing texture, isolated trees and sometimes repetitive objects.<br />
The unrealistic threshold of R=0.9 for the correlation<br />
coefficient of the least squares matching leads to a not
negligible loss of accepted points. On the other hand a small<br />
step width of just 1 pixel increases the percentage of accepted<br />
points very slightly, but requires a quite higher processing time.<br />
The study gave optimal results for the sub-matrix size for<br />
matching of 10 x 10 pixels.<br />
Area with man-made objects and trees:<br />
The area includes complex objects such as small and large<br />
buildings and trees close to roofs. Problems are caused by<br />
shadows, repetitive objects, occlusions and poor texture. Few or<br />
no points were extracted in shadow areas close to the base of<br />
buildings.<br />
The matching in dense urban area may not be sufficient to<br />
model discontinuities such as buildings. Buildings often<br />
occlude each other. Furthermore, man-made objects are usually<br />
made with homogenous materials causing large areas of poor<br />
texture. Figure 5 shows the frequency distribution of the<br />
correlation coefficient in a complex area.<br />
parameters<br />
R= threshold for accepted correlation<br />
R = 0.90 , Step width = 3<br />
sub-matrix 10 ×10 pixels<br />
R = 0.80 , Step width = 3<br />
sub-matrix 10 ×10 pixels<br />
R = 0.70 , Step width = 3<br />
sub-matrix 10 ×10 pixels<br />
R = 0.70 , Step width = 1<br />
sub-matrix 10 ×10 pixels<br />
matching success<br />
48%<br />
61%<br />
74%<br />
76%<br />
R = 0.70 , Step width = 3<br />
sub-matrix 7 ×7 pixels<br />
35%<br />
Table2: Matching completeness in area with man-made<br />
objects depending upon chosen parameters<br />
Optimal results have been achieved in the area with man-made<br />
objects with the threshold for the correlation coefficient R=0.70<br />
of the least squares matching, the sub-matrix of 10 x10 pixels<br />
and the step width of 3 pixels. A lower threshold for the<br />
correlation coefficient may lead to a lower accuracy, requiring a<br />
compromise between both.<br />
The template must have a sufficient size, but a larger size is<br />
corresponds to a low pass filtering, requiring also a<br />
compromise.<br />
The identification of points located on top of building may fail<br />
if too large templates are used and the objects may look like<br />
smooth hills and not like buildings. Beside this, noise is caused<br />
by trees close to buildings.<br />
Some “noise” of the DSMs has been eliminated by filtering<br />
with the Hannover program RASCOR (Passini et al 2002).<br />
Figure 4 shows the effect of filtering.<br />
Figure5: Frequency distribution of correlation coefficients of least squares matching in complex areas with small and<br />
large building and trees, sub-matrix for least squares matching 10x10 pixels; step width = 3 pixels<br />
4. Accuracy Analysis<br />
Figure 4: Effect of noise filtering on gro<strong>und</strong> and buildings<br />
(a) Before filtering - (b) after filtering
The accuracy analysis shall lead to the optimal matching<br />
procedure. As reference for the investigation manually<br />
measured, randomly spaced points in the stereo model have<br />
been used.<br />
The reference height model must be available in a grid mode.<br />
For this reason, the reference DSM has been interpolated by<br />
Delauny triangulation to a point raster with 20cm spacing.<br />
The generated DSM has been checked against the manually<br />
measured reference height model separately for the open area<br />
and the area with man-made objects and trees. For this the<br />
Hannover program for analysis of height models can use a<br />
layer with different point classes (Jacobsen 2007). Table 3<br />
shows the results of the comparison.<br />
Class<br />
man-made objects<br />
and trees<br />
open area<br />
Number of<br />
measured<br />
points<br />
1839<br />
1222<br />
RMSE<br />
cm<br />
13.4<br />
10.6<br />
Bias<br />
cm<br />
0,0<br />
0.4<br />
Table 3: RMS discrepancies against reference height model<br />
The root mean square errors (RMSE) of the differences have<br />
to be seen in relation to the 9.4cm GSD together with the<br />
height to base relation of the DMC, being 3.2 for the used<br />
60% endlap. The standard deviation of the x-parallax<br />
corresponds to the vertical root mean square error divided by<br />
the height to base relation. So a RMSE of 13.4cm for the<br />
height differences corresponds to 0.44 GSD standard<br />
deviation of the x-parallax and 10.6cm RMSE correspond to<br />
0.35GSD. The standard deviation of the height (Sz) can be<br />
estimated with:<br />
h<br />
Sz = • spx (1)<br />
b<br />
where h is the flying height above gro<strong>und</strong>, b is the base<br />
length and spx the standard deviation of the x-parallax.<br />
As expected, the root mean square error in open area is<br />
smaller than root mean square error for the area with<br />
buildings and trees, which is influenced by discontinuities.<br />
Figure 6: Frequency of distribution of the height differences<br />
[m] between the matched DSM and the reference DSM in the<br />
area with man-made objects and trees<br />
Figure 7: Frequency distribution of the height differences<br />
[m] between the matched DSM and the reference DSM in<br />
open areas<br />
The frequency distribution in open area (figure 7) is close to<br />
normal distribution, while the frequency distribution shown<br />
in figure 6 is a little asymmetric, caused by vegetation.<br />
As tolerance limit for analysis a maximal absolute value of<br />
the height difference of 0.5m has been used, larger height<br />
differences have been handled as bl<strong>und</strong>ers. Only very few<br />
points exceeded this limit.<br />
5. Comparison between matched and reference DSM<br />
The reference height model is not free of errors; this should<br />
be respected for the accuracy analysis. The accuracy of the<br />
manual pointing is estimated with a standard deviation of the<br />
x-parallax of 0.25 GSD, multiplied with the height to base<br />
relation of 3.2 it leads to a standard deviation of the height<br />
measurement of 0.8 GSD or 7.5cm. If this is respected for the<br />
values shown in table 3, the standard deviation of the DSM<br />
in the area with man-made objects and trees is 11.1cm,<br />
corresponding to a x-parallax accuracy of 0.37GSD, and for<br />
the open area 7.5cm, corresponding to a x-parallax accuracy<br />
of 0.25GSD. This means, for the open area the manual<br />
pointing and the automatic image matching are on the same<br />
accuracy level, while in the build up area the manual<br />
pointing is more precise, mainly because of problems at<br />
discontinuities.<br />
6. Visual inspection<br />
The visual comparison of the DSM generated by manual<br />
measurement and the matched DSM shows the following for<br />
the matched DSM:<br />
- The base of the buildings is wider than its original<br />
length, mainly caused by occlusions, but in most cases<br />
the roof is shown very well.<br />
- Sun shadows leads to matching failures.<br />
- The building footprints in most cases can be extracted<br />
from the generated DSM, but not in any case with<br />
satisfying details.<br />
Parts of buildings may be occluded by other buildings,<br />
influencing the achieved building shape or causing matching<br />
problems.
7. Conclusion<br />
Figure 7: Shaded visualization of matched DSM with some details, upper right = DMC-image<br />
Digital surface models in urban areas can be generated based on<br />
large scale DMC-images, but some difficulties have to be<br />
expected, such as caused by: radiometric problems, occlusions,<br />
shadows and vegetation.<br />
In the area including complex objects such as small and large<br />
buildings and trees close to roofs, the detection and definition<br />
of corner points in the building was poor, leading to the<br />
possibility of errors.<br />
But we can deduce the following results:<br />
- High accuracy of generated DSM based on DMC-images<br />
with a standard deviation of the height between 0.8 and 1.2<br />
GSD.<br />
- Generation of good DSM depends on the image quality<br />
and the object visibility.<br />
- The matching parameters should be optimized according to<br />
the characteristics of each area.<br />
8. Reference<br />
Gruen, A.W. and Baltsavias, E.P., 1987: High-precision image<br />
matching for digital terrain model generation, IAPRS, Vol 25,<br />
No 3/1: 284-296.<br />
Heipke, C., 1996: Overview of Image Matching Techniques -<br />
http://phot.epfl.ch/workshop/wks96/art_3_1.html(January 2008)<br />
Jacobsen, K., 2006: Digital surface Models of city Areas by<br />
very High Resolution Space Imagery. EARSeL Workshop on<br />
Urban Remote Sensing, Berlin March 2006, on CD<br />
Jacobsen, K., 2007: Manual of program system BLUH, <strong>Institut</strong>e<br />
of Photogrammetry and Geoinformation, Leibniz University<br />
Hannover, Germany<br />
Jacobsen, K., 2008: Tells the number of pixels the truth? –<br />
Effective Resolution of Large Size Digital Frame Cameras,<br />
ASPRS 2008 Annual Convention, Portland
Passini, R., Betzner, D., Jacobsen, K., 2002: Filtering of Digital<br />
Elevation Models, ASPRS annual convention, Washington<br />
2002<br />
Wiman ,H., 1998: Automatic Generation of Digital surface<br />
Models through Matching The Photogrammetric Record 16 (91)<br />
Figure 8: 3D visualization of matched DSM sub-area - 15 cm point spacing<br />
, 83–91 doi:10.1111/0031-868X.00115 , http://www.blackwellsynergy.com/doi/abs/10.1111/0031-868X.00115(February<br />
2008)