Kosovo Human Development Report 2010 - UNDP Kosovo - United ...
Kosovo Human Development Report 2010 - UNDP Kosovo - United ...
Kosovo Human Development Report 2010 - UNDP Kosovo - United ...

Create successful ePaper yourself
Turn your PDF publications into a flip-book with our unique Google optimized e-Paper software.
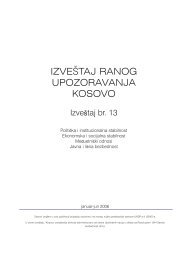
<strong>Human</strong> <strong>Development</strong> Index<br />
according to the Global <strong>Human</strong> <strong>Development</strong> <strong>Report</strong> <strong>2010</strong><br />
<strong>Human</strong> <strong>Development</strong><br />
Index (HDI)<br />
DIMENSIONS<br />
INDICATORS<br />
DIMENSION<br />
INDEX<br />
The <strong>Human</strong> <strong>Development</strong> Index (HDI)<br />
is a summary measure of human development.<br />
It measures the average<br />
achievements in a country in three<br />
basic dimensions of human development:<br />
a long and healthy life, access to<br />
knowledge and a decent standard of<br />
living. The HDI is the geometric mean<br />
of normalized indices measuring<br />
achievements in each dimension.<br />
Data sources<br />
• Life expectancy at birth: UNDESA<br />
(2009d)<br />
• Mean years of schooling: Barro and<br />
Lee (<strong>2010</strong>)<br />
• Expected years of schooling:<br />
UNESCO Institute for Statistics<br />
(<strong>2010</strong>a)<br />
• Gross national income (GNI) per<br />
capita: World Bank (<strong>2010</strong>g) and IMF<br />
(<strong>2010</strong>a)<br />
Creating the dimension indices<br />
The first step is to create subindices for<br />
each dimension. Minimum and maximum<br />
values (goalposts) need to be<br />
Long and healthy life<br />
Life expectancy at birth<br />
Life expectancy index<br />
ANNEX 2<br />
Technical Notes:<br />
Mean years of schooling Expected years of schooling GNI per capita (PPP USD)<br />
<strong>Human</strong> <strong>Development</strong> Index (HDI)<br />
set in order to transform the indicators<br />
into indices between 0 and 1. Because<br />
the geometric mean is used for aggregation,<br />
the maximum value does<br />
not affect the relative comparison<br />
(in percentage terms) between any<br />
two countries or periods of time. The<br />
maximum values are set to the actual<br />
observed maximum values of the indicators<br />
from the countries in the time<br />
series, that is, 1980–<strong>2010</strong>. The minimum<br />
values will affect comparisons,<br />
so values that can be appropriately<br />
conceived of as subsistence values<br />
or “natural” zeros are used. Progress is<br />
thus measured against minimum levels<br />
that a society needs to survive over<br />
time. The minimum values are set at 20<br />
years for life expectancy, at 0 years for<br />
both education variables and at USD<br />
163 for per capita gross national income<br />
(GNI). The life expectancy minimum<br />
is based on long-run historical<br />
evidence from Maddison (<strong>2010</strong>) and<br />
Riley (2005).Societies can subsist without<br />
formal education, justifying the<br />
education minimum. A basic level of<br />
Knowledge A decent standard of living<br />
Education index<br />
GNI index<br />
Technical Notes | 105