
You also want an ePaper? Increase the reach of your titles
YUMPU automatically turns print PDFs into web optimized ePapers that Google loves.
Saudi Banks Sector<br />
Banks –Finance<br />
Saudi Arabia<br />
6 April 2017<br />
January 18, 2010<br />
Key themes<br />
A 23% y-o-y increase in ageing financing (financing<br />
past due date, but not impaired) may indicate higher<br />
provisions y-o-y in Q1. Post recent fall in SAIBOR,<br />
asset yields may not rise as much as previously<br />
expected while cost of deposits are likely to be<br />
lower. Non-financing income could be lower on weak<br />
financing growth and TASI volumes.<br />
<strong>Banking</strong> <strong>sector</strong><br />
Earnings may remain weak<br />
Contrary to our earlier expectations, we now expect Q1 2017 banking <strong>sector</strong><br />
consolidated earnings to see some weakness compared to the same period last<br />
year, on the back of risk of higher provisions (y-o-y) as well as moderation of<br />
commission and fee incomes. We expect provisioning to remain elevated y-o-y,<br />
but lower on q-o-q basis because of a 23% y-o-y increase in ageing financing<br />
(due, but not impaired) at the end of 2016. NIMs may improve mildly while<br />
non-financing income may witness a moderate decline (y-o-y) due to weak<br />
credit growth along with a decline in Tadawul trading volumes. After posting<br />
record monthly profit in January, monthly profit for February declined c20%<br />
m-o-m and profit for the first two months was up only +3.5% y-o-y.<br />
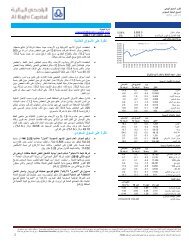
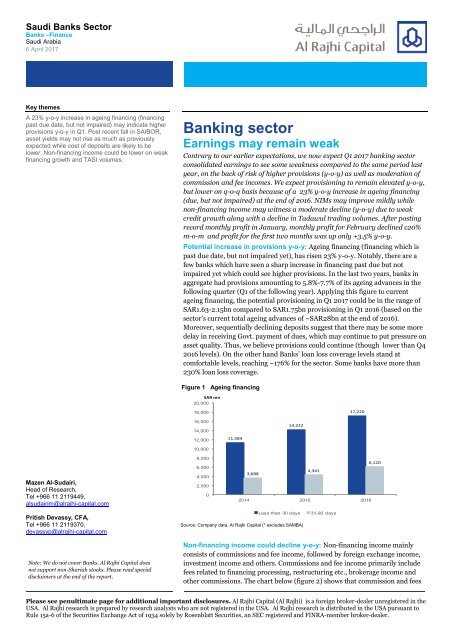
Potential increase in provisions y-o-y: Ageing financing (financing which is<br />
past due date, but not impaired yet), has risen 23% y-o-y. Notably, there are a<br />
few banks which have seen a sharp increase in financing past due but not<br />
impaired yet which could see higher provisions. In the last two years, banks in<br />
aggregate had provisions amounting to 5.8%-7.7% of its ageing advances in the<br />
following quarter (Q1 of the following year). Applying this figure to current<br />
ageing financing, the potential provisioning in Q1 2017 could be in the range of<br />
SAR1.63-2.15bn compared to SAR1.75bn provisioning in Q1 2016 (based on the<br />
<strong>sector</strong>’s current total ageing advances of ~SAR28bn at the end of 2016).<br />
Moreover, sequentially declining deposits suggest that there may be some more<br />
delay in receiving Govt. payment of dues, which may continue to put pressure on<br />
asset quality. Thus, we believe provisions could continue (though lower than Q4<br />
2016 levels). On the other hand Banks’ loan loss coverage levels stand at<br />
comfortable levels, reaching ~176% for the <strong>sector</strong>. Some banks have more than<br />
230% loan loss coverage.<br />
Figure 1 Ageing financing<br />
SAR mn<br />
20,000<br />
18,000<br />
17,220<br />
16,000<br />
14,000<br />
14,222<br />
12,000<br />
11,384<br />
Mazen Al-Sudairi,<br />
Head of Research,<br />
Tel +966 11 2119449,<br />
alsudairim@alrajhi-capital.com<br />
10,000<br />
8,000<br />
6,000<br />
4,000<br />
2,000<br />
0<br />
6,120<br />
3,688<br />
4,341<br />
2014 2015 2016<br />
Pritish Devassy, CFA,<br />
Tel +966 11 2119370,<br />
devassyp@alrajhi-capital.com<br />
Less than 30 days<br />
Source: Company data, Al Rajhi Capital (* excludes SAMBA)<br />
31-90 days<br />
Note: We do not cover Banks. Al Rajhi Capital does<br />
not support non-Shariah stocks. Please read special<br />
disclaimers at the end of the report.<br />
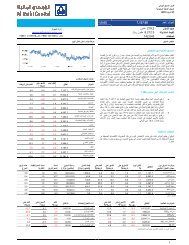
Non-financing income could decline y-o-y: Non-financing income mainly<br />
consists of commissions and fee income, followed by foreign exchange income,<br />
investment income and others. Commissions and fee income primarily include<br />
fees related to financing processing, restructuring etc., brokerage income and<br />
other commissions. The chart below (figure 2) shows that commission and fees<br />
Please see penultimate page for additional important disclosures. Al Rajhi Capital (Al Rajhi) is a foreign broker-dealer unregistered in the<br />
USA. Al Rajhi research is prepared by research analysts who are not registered in the USA. Al Rajhi research is distributed in the USA pursuant to<br />
Rule 15a-6 of the Securities Exchange Act of 1934 solely by Rosenblatt Securities, an SEC registered and FINRA-member broker-dealer.
Q1 2012<br />
Q2 2012<br />
Q3 2012<br />
Q4 2012<br />
Q1 2013<br />
Q2 2013<br />
Q3 2013<br />
Q4 2013<br />
Q1 2014<br />
Q2 2014<br />
Q3 2014<br />
Q4 2014<br />
Q1 2015<br />
Q2 2015<br />
Q3 2015<br />
Q4 2015<br />
Q1 2016<br />
Q2 2016<br />
Q3 2016<br />
Q4 2016<br />
Saudi Banks Sector<br />
Banks –Finance<br />
6 April 2017<br />
income generally have moved along with net financing growth. Given that total financing<br />
growth has slowed (YTD down marginally), and trading volume on the Tadawul has<br />
remained weak in Q1 2017, we believe total commission and fees income may come under<br />
pressure.<br />
Figure 2 Commission and fees depends mostly on financing given<br />
SAR mn<br />
5,000<br />
4,500<br />
4,000<br />
3,500<br />
3,000<br />
2,500<br />
2,000<br />
1,500<br />
1,000<br />
SAR mn<br />
50,000<br />
40,000<br />
30,000<br />
20,000<br />
10,000<br />
-<br />
(10,000)<br />
(20,000)<br />
(30,000)<br />
(40,000)<br />
Sequential change in loans (RHS)<br />
Commission and Fees<br />
Source: SAMA, Company data, Al Rajhi Capital<br />
Asset yields may not rise as much as expected: After rising sharply in H2 2016, we<br />
believe Q1 asset yields may not have risen as much as previously expected due to the fall in<br />
SAIBOR towards the end of the quarter. Assuming financing rates for corporates are reset<br />
every 6 months, total corporate book may re-price only after 6 months. Hence change in asset<br />
yields are likely to be more gradual as compared to change in SAIBOR. We note that average<br />
SAIBOR in Q1 (average of each day for the past 180 days) is slightly lower than in Q4 2016,<br />
which may lower asset yields on q-o-q basis contrary to estimates at the start of the quarter.<br />
Given different financing and deposit structure of banks, impact on banks are likely to vary<br />
with banks with higher corporate exposure likely to see re-pricing sooner as compared to<br />
banks with higher retail exposure.<br />
As a result, after healthy profits in 2 months, provisioning could weaken Q1 earnings<br />
further: As per SAMA’s monthly data, cumulative profit for months of January and February<br />
grew at a moderate pace of 3.5% y-o-y. We believe this may be attributable to an expansion in<br />
NIMs, helped by lower cost of deposits. However, as mentioned above, a potential increase in<br />
provisions could impact profitability for the quarter. In the past, banks have booked higher<br />
provisions in the third month of the quarter. We also observe that some banks have seen a<br />
sharp increase in past dues but not impaired financing.<br />
Liquidity squeeze is unlikely: SAMA has changed the calculation regulation for SAIBOR.<br />
The inter-bank exchange rate would now be calculated by Thomson Reuters, which our<br />
checks suggest is likely to reduce volatility. We believe there is unlikely to be a liquidity<br />
squeeze which could result in SAIBOR levels rising as we saw in 2H 2016.<br />
a) Financing growth, which remains correlated to gross capital spending is expected to<br />
remain moderate. As companies look to deleverage to save on financing costs, loan to deposit<br />
ratio may moderate. Moreover, if the government pays off its dues soon, it could further<br />
improve the liquidity situation.<br />
b) Additionally Saudi Arabia's government decided to suspend its monthly issue of domestic<br />
bonds in March (source: Maal). Even otherwise there is ample scope for SAMA to mitigate an<br />
unexpected liquidity squeeze. For example, even when Saudi Govt issued domestic bonds in<br />
the past, banks were able to purchase these bonds by selling SAMA bills held by them (See<br />
figure 18). So in-turn this resulted in shift from SAMA to Govt through two different<br />
instruments. Moreover, the liquidity with banks has improved over the last few quarters. The<br />
banking <strong>sector</strong>’s deposit with SAMA (including holding of SAMA bills) as a % of total deposits<br />
stood at c14%, up from a low of 11% in June 2016, while they are only required to hold 7% of<br />
Disclosures Please refer to the important disclosures at the back of this report. 2
Saudi Banks Sector<br />
Banks –Finance<br />
6 April 2017<br />
demand deposits and 4% of time deposits. Thus, even if the Saudi government issues<br />
domestic bonds, the banking system would have the ability to absorb it without squeezing<br />
liquidity.<br />
c) Moreover, Banks have sufficient liquid assets (in the form of investments) over and above<br />
the required 20% of deposits they are required to maintain.<br />
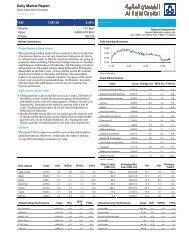
Valuation and risks: After moving up sharply in Q4 2016 on news of Govt payment of dues,<br />
the banking <strong>sector</strong> has thereafter declined in Q1 2017, (down 4.1% sequentially). In terms of<br />
valuations, the <strong>sector</strong> is currently trading at 1.2x FY2016 book value. However, if the<br />
government starts to pay its outstanding dues to companies, it could lead to repayment to<br />
banks, which may result in reversal of provisions and act as a catalyst for the banking <strong>sector</strong><br />
stocks.<br />
Figure 3 Performance of Bank <strong>sector</strong> vs. TASI<br />
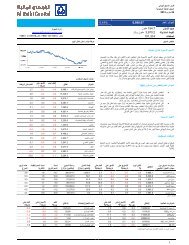
Figure 4 ROE (avg. last 4 quarters) vs. P/B (12m forward)<br />
110.0<br />
105.0<br />
100.0<br />
95.0<br />
18.0%<br />
16.0%<br />
Title:<br />
Source:<br />
NCB<br />
Al Rajhi<br />
Please fill in the values above to have them entered in your report<br />
90.0<br />
85.0<br />
80.0<br />
75.0<br />
14.0%<br />
12.0%<br />
SABB<br />
ANB BSF Samba<br />
Aljazira<br />
Albilad<br />
70.0<br />
65.0<br />
60.0<br />
10.0%<br />
8.0%<br />
SIB<br />
Riyad<br />
Alawwal<br />
Alinma<br />
Banks TASI<br />
6.0%<br />
0.4 0.6 0.8 1 1.2 1.4 1.6 1.8 2<br />
Source: Bloomberg, Al Rajhi Capital<br />
Source: Bloomberg, Company data, Al Rajhi Capital<br />
Disclosures Please refer to the important disclosures at the back of this report. 3
Q1 2012<br />
Q2 2012<br />
Q3 2012<br />
Q4 2012<br />
Q1 2013<br />
Q2 2013<br />
Q3 2013<br />
Q4 2013<br />
Q1 2014<br />
Q2 2014<br />
Q3 2014<br />
Q4 2014<br />
Q1 2015<br />
Q2 2015<br />
Q3 2015<br />
Q4 2015<br />
Q1 2016<br />
Q2 2016<br />
Q3 2016<br />
Q4 2016<br />
Q1 2012<br />
Q2 2012<br />
Q3 2012<br />
Q4 2012<br />
Q1 2013<br />
Q2 2013<br />
Q3 2013<br />
Q4 2013<br />
Q1 2014<br />
Q2 2014<br />
Q3 2014<br />
Q4 2014<br />
Q1 2015<br />
Q2 2015<br />
Q3 2015<br />
Q4 2015<br />
Q1 2016<br />
Q2 2016<br />
Q3 2016<br />
Q4 2016<br />
Saudi Banks Sector<br />
Banks –Finance<br />
6 April 2017<br />
Figure 5 Movement of asset yield, cost of deposit, net interest margin and interest rates<br />
5.0%<br />
4.5%<br />
4.0%<br />
3.5%<br />
3.0%<br />
2.5%<br />
2.0%<br />
1.5%<br />
1.0%<br />
4.0% 4.3%<br />
3.6% 3.5% 3.6% 3.6% 3.5% 3.4% 3.4%3.5% 3.4% 3.3% 3.3% 3.2% 3.3% 3.5% 3.7% 3.2% 3.2% 3.2%<br />
3.1%<br />
3.2% 3.1% 3.1% 3.1% 3.0% 3.0%<br />
3.1%<br />
2.9%<br />
2.9% 2.9% 2.8% 2.9% 2.8% 2.8% 2.8% 2.8% 2.8% 2.9% 3.1%<br />
1.7% 2.1% 2.3% 2.2%<br />
0.8% 0.9% 1.0% 1.0% 1.0% 1.0% 1.0% 0.9% 1.0% 1.0% 1.1%<br />
0.9% 0.9% 0.8% 0.8% 0.8%<br />
0.5%<br />
0.0%<br />
Q1<br />
2012<br />
Q2<br />
2012<br />
Q3<br />
2012<br />
Q4<br />
2012<br />
Q1<br />
2013<br />
Q2<br />
2013<br />
Q3<br />
2013<br />
Q4<br />
2013<br />
Q1<br />
2014<br />
Q2<br />
2014<br />
Q3<br />
2014<br />
Q4<br />
2014<br />
Q1<br />
2015<br />
Q2<br />
2015<br />
Q3<br />
2015<br />
Q4<br />
2015<br />
Q1<br />
2016<br />
Q2<br />
2016<br />
Q3<br />
2016<br />
Q4<br />
2016<br />
Asset yield Cost of deposits NIM 3m SAIBOR 3m LIBOR<br />
Source: Company data, Al Rajhi Capital (* NIM is calculated as Non-interest income divided by interest earning assets)<br />
Figure 6 Non-performing loan ratio vs. coverage ratio<br />
190%<br />
180%<br />
170%<br />
160%<br />
150%<br />
140%<br />
130%<br />
120%<br />
2.4%<br />
2.2%<br />
2.0%<br />
1.8%<br />
1.6%<br />
1.4%<br />
1.2%<br />
1.0%<br />
Figure 7 Net interest income for the <strong>sector</strong><br />
SAR mn<br />
16,000<br />
14,000<br />
12,000<br />
10,000<br />
8,000<br />
6,000<br />
4,000<br />
2,000<br />
0<br />
Title:<br />
Source:<br />
16%<br />
14%<br />
12%<br />
Please fill in the values above to have them entered in your report<br />
10%<br />
8%<br />
6%<br />
4%<br />
2%<br />
0%<br />
-2%<br />
-4%<br />
-6%<br />
coverage ratio<br />
Source: Company data, Al Rajhi Capital<br />
Non-performing loan to gross loans (RHS)<br />
Source: Company data, Al Rajhi Capital<br />
Net interest income y-o-y (RHS) q-o-q (RHS)<br />
Disclosures Please refer to the important disclosures at the back of this report. 4
Q1 2012<br />
Q1 2012<br />
Q1 2012<br />
Q2 2012<br />
Q2 2012<br />
Q2 2012<br />
Q3 2012<br />
Q3 2012<br />
Q3 2012<br />
Q4 2012<br />
Q4 2012<br />
Q4 2012<br />
Q1 2013<br />
Q1 2013<br />
Q1 2013<br />
Q2 2013<br />
Q2 2013<br />
Q2 2013<br />
Q3 2013<br />
Q3 2013<br />
Q3 2013<br />
Q4 2013<br />
Q4 2013<br />
Q4 2013<br />
Q1 2014<br />
Q1 2014<br />
Q1 2014<br />
Q2 2014<br />
Q2 2014<br />
Q3 2014<br />
Q2 2014<br />
Q3 2014<br />
Q4 2014<br />
Q3 2014<br />
Q4 2014<br />
Q1 2015<br />
Q4 2014<br />
Q1 2015<br />
Q2 2015<br />
Q1 2015<br />
Q2 2015<br />
Q3 2015<br />
Q3 2015<br />
Q2 2015<br />
Q4 2015<br />
Q4 2015<br />
Q3 2015<br />
Q1 2016<br />
Q1 2016<br />
Q2 2016<br />
Q4 2015<br />
Q2 2016<br />
Q3 2016<br />
Q1 2016<br />
Q3 2016<br />
Q4 2016<br />
Q2 2016<br />
Q4 2016<br />
Q3 2016<br />
Q4 2016<br />
Q1 2012<br />
Q1 2012<br />
Q1 2012<br />
Q2 2012<br />
Q2 2012<br />
Q2 2012<br />
Q3 2012<br />
Q3 2012<br />
Q3 2012<br />
Q4 2012<br />
Q4 2012<br />
Q4 2012<br />
Q1 2013<br />
Q1 2013<br />
Q1 2013<br />
Q2 2013<br />
Q2 2013<br />
Q2 2013<br />
Q3 2013<br />
Q3 2013<br />
Q3 2013<br />
Q4 2013<br />
Q4 2013<br />
Q4 2013<br />
Q1 2014<br />
Q1 2014<br />
Q1 2014<br />
Q2 2014<br />
Q2 2014<br />
Q2 2014<br />
Q3 2014<br />
Q3 2014<br />
Q3 2014<br />
Q4 2014<br />
Q4 2014<br />
Q4 2014<br />
Q1 2015<br />
Q1 2015<br />
Q1 2015<br />
Q2 2015<br />
Q2 2015<br />
Q2 2015<br />
Q3 2015<br />
Q3 2015<br />
Q3 2015<br />
Q4 2015<br />
Q4 2015<br />
Q4 2015<br />
Q1 2016<br />
Q1 2016<br />
Q1 2016<br />
Q2 2016<br />
Q2 2016<br />
Q2 2016<br />
Q3 2016<br />
Q3 2016<br />
Q3 2016<br />
Q4 2016<br />
Q4 2016<br />
Q4 2016<br />
Saudi Banks Sector<br />
Banks –Finance<br />
6 April 2017<br />
Figure 8 <strong>Banking</strong> <strong>sector</strong> provisions trend<br />
SAR mn<br />
4,500<br />
4,000<br />
3,500<br />
3,000<br />
2,500<br />
2,000<br />
1,500<br />
1,000<br />
500<br />
0<br />
100.0%<br />
80.0%<br />
60.0%<br />
40.0%<br />
20.0%<br />
0.0%<br />
-20.0%<br />
-40.0%<br />
-60.0%<br />
Figure 9 <strong>Banking</strong> <strong>sector</strong> non-interest income<br />
SAR mn<br />
8,000<br />
7,000<br />
6,000<br />
5,000<br />
4,000<br />
3,000<br />
2,000<br />
1,000<br />
-<br />
Title:<br />
40%<br />
Source:<br />
30%<br />
Please fill in the values above to have them entered in your report<br />
20%<br />
10%<br />
0%<br />
-10%<br />
-20%<br />
-30%<br />
Source: Company data, Al Rajhi Capital<br />
Provisions y-o-y q-o-q<br />
Non-interest income (SARmn) y-o-y (RHS) q-o-q (RHS)<br />
Source: Company data, Al Rajhi Capital<br />
Figure 10 <strong>Banking</strong> <strong>sector</strong> operating income trend<br />
SAR mn<br />
25,000<br />
20,000<br />
15%<br />
10%<br />
Figure 11 <strong>Banking</strong> <strong>sector</strong> net profit<br />
SAR mn<br />
14,000<br />
12,000<br />
10,000<br />
Title:<br />
40%<br />
Source:<br />
30%<br />
Please fill in the values above to have them entered in your report<br />
20%<br />
15,000<br />
5%<br />
8,000<br />
10%<br />
10,000<br />
0%<br />
6,000<br />
0%<br />
4,000<br />
-10%<br />
5,000<br />
-5%<br />
2,000<br />
-20%<br />
0<br />
-10%<br />
0<br />
-30%<br />
Operating income y-o-y (RHS) q-o-q (RHS)<br />
Source: Company data, Al Rajhi Capital<br />
Source: Company data, Al Rajhi Capital<br />
net income y-o-y (RHS) q-o-q (RHS)<br />
Figure 12 <strong>Banking</strong> <strong>sector</strong> cost to income ratio (cost excluding<br />
provisions/income)<br />
Figure 13 Loan-to-deposit ratio vs. y-o-y change in loans and<br />
deposits<br />
42%<br />
40%<br />
38%<br />
36%<br />
34%<br />
32%<br />
30%<br />
92.0%<br />
90.0%<br />
88.0%<br />
86.0%<br />
84.0%<br />
82.0%<br />
80.0%<br />
78.0%<br />
76.0%<br />
74.0%<br />
72.0%<br />
Title:<br />
Source:<br />
20%<br />
15%<br />
Please fill in the values above to have them entered in your report<br />
10%<br />
5%<br />
0%<br />
-5%<br />
-10%<br />
LDR Loans (RHS) deposits (RHS)<br />
Source: Company data, Al Rajhi Capital<br />
Source: SAMA, Al Rajhi Capital<br />
Disclosures Please refer to the important disclosures at the back of this report. 5
Q1 2012<br />
Q1 2012<br />
Q1 2012<br />
Q2 2012<br />
Q2 2012<br />
Q2 2012<br />
Q3 2012<br />
Q3 2012<br />
Q3 2012<br />
Q4 2012<br />
Q4 2012<br />
Q4 2012<br />
Q1 2013<br />
Q1 2013<br />
Q1 2013<br />
Q2 2013<br />
Q2 2013<br />
Q2 2013<br />
Q3 2013<br />
Q3 2013<br />
Q3 2013<br />
Q4 2013<br />
Q4 2013<br />
Q4 2013<br />
Q1 2014<br />
Q1 2014<br />
Q1 2014<br />
Q2 2014<br />
Q2 2014<br />
Q2 2014<br />
Q3 2014<br />
Q3 2014<br />
Q4 2014<br />
Q3 2014<br />
Q1 2015<br />
Q4 2014<br />
Q4 2014<br />
Q2 2015<br />
Q1 2015<br />
Q1 2015<br />
Q3 2015<br />
Q2 2015<br />
Q2 2015<br />
Q4 2015<br />
Q3 2015<br />
Q3 2015<br />
Q1 2016<br />
Q4 2015<br />
Q4 2015<br />
Q2 2016<br />
Q1 2016<br />
Q1 2016<br />
Q3 2016<br />
Q4 2016<br />
Q2 2016<br />
Q2 2016<br />
Q3 2016<br />
Q3 2016<br />
Q4 2016<br />
Q4 2016<br />
Q1 2012<br />
Q1 2012<br />
Q2 2012<br />
Q2 2012<br />
Q3 2012<br />
Q3 2012<br />
Q4 2012<br />
Q4 2012<br />
Q1 2013<br />
Q1 2013<br />
Q2 2013<br />
Q2 2013<br />
Q3 2013<br />
Q3 2013<br />
Q4 2013<br />
Q4 2013<br />
Q1 2014<br />
Q1 2014<br />
Q2 2014<br />
Q2 2014<br />
Q3 2014<br />
Q3 2014<br />
Q4 2014<br />
Q4 2014<br />
Q1 2015<br />
Q1 2015<br />
Q2 2015<br />
Q2 2015<br />
Q3 2015<br />
Q3 2015<br />
Q4 2015<br />
Q4 2015<br />
Q1 2016<br />
Q1 2016<br />
Q2 2016<br />
Q2 2016<br />
Q3 2016<br />
Q3 2016<br />
Q4 2016<br />
Q4 2016<br />
Saudi Banks Sector<br />
Banks –Finance<br />
6 April 2017<br />
Figure 14 Real Estate and Consumer Loans<br />
deposit % SAR bn<br />
400<br />
350<br />
300<br />
250<br />
200<br />
150<br />
100<br />
50<br />
0<br />
45%<br />
40%<br />
35%<br />
30%<br />
25%<br />
20%<br />
15%<br />
10%<br />
5%<br />
0%<br />
Figure 15 Loans breakup by economic activity<br />
100%<br />
90% 17.7% 18.9% 20.4% 18.0% 17.7%<br />
80% 4.6% 4.3% 3.8% 3.5%<br />
4.2%<br />
6.7% 5.5% 4.6%<br />
5.9% 5.8%<br />
70%<br />
60%<br />
29.5% 30.4% 30.8% 31.2% 32.3%<br />
50%<br />
40%<br />
30%<br />
14.0% 13.7% 13.2% 13.1% 13.1%<br />
20%<br />
18.9% 18.9% 17.8% 18.7% 18.3%<br />
10%<br />
0%<br />
8.5% 8.3% 9.0% 9.4% 9.3%<br />
2012 2013 2014 2015 2016<br />
Real Estate loans<br />
y-o-y change in real estate (RHS)<br />
Source: SAMA, Al Rajhi Capital<br />
Consumer loans<br />
y-o-y change in consumer (RHS)<br />
Construction & Building Commerce Industrial/manufact.<br />
Personal Services Transport. and comm.<br />
Others<br />
Source: Company data, Al Rajhi Capital<br />
Figure 16 Demand deposits % of total deposits Figure 17 Loans breakup by maturity (%)<br />
66.00<br />
65.00<br />
64.00<br />
63.00<br />
62.00<br />
61.00<br />
60.00<br />
59.00<br />
58.00<br />
100%<br />
90%<br />
80%<br />
70%<br />
60%<br />
50%<br />
40%<br />
30%<br />
20%<br />
10%<br />
0%<br />
25% 25%<br />
Title:<br />
Source:<br />
28% 29% 30% 32% 30% 31% 28% 29%<br />
24%<br />
26% 29%<br />
31%<br />
Please fill 27% in the values 28% above 31% to have 31% them 32% entered 29% in your report<br />
17% 18%<br />
19%<br />
18%<br />
18% 18%<br />
20% 19% 19%<br />
19% 18% 19% 17%<br />
20%<br />
19%<br />
17%<br />
19%<br />
19%<br />
18% 20%<br />
58%<br />
53%<br />
53%<br />
52%<br />
52%<br />
58% 57% 53% 53% 52% 50% 52% 52% 52% 52%50%<br />
54%<br />
54%<br />
50%<br />
50%<br />
Short Term Medium Term Long Term<br />
Source: SAMA, Al Rajhi Capital<br />
Source: SAMA, Al Rajhi Capital<br />
Figure 18 Consolidated assets of commercial bank assets<br />
Figure 19 Consolidated liabilities of commercial banks<br />
100%<br />
90%<br />
80%<br />
70%<br />
60%<br />
50%<br />
40%<br />
30%<br />
20%<br />
10%<br />
58% 58% 60% 59% 60% 59% 60% 62% 64% 62%<br />
56% 59% 58% 60% 59% 61% 59% 60% 64%<br />
64%<br />
100%<br />
90%<br />
80%<br />
70%<br />
60%<br />
50%<br />
40%<br />
30%<br />
20%<br />
10%<br />
0%<br />
Title:<br />
Source:<br />
Please fill in the values above to have them entered in your report<br />
19% 18% 18%<br />
19% 19% 18% 18% 17% 19% 18% 18% 19% 21%<br />
18% 18% 19% 17% 20%<br />
22%<br />
20%<br />
42% 42% 45% 45% 46% 45% 48% 48% 44% 42%<br />
42% 43% 46% 45% 46% 46% 49% 44% 43% 43%<br />
0%<br />
Bank reserves<br />
SAMA Bills<br />
Foreign Assets<br />
Claims on Private Sector<br />
Claims on Govt.& Quasi-govt. Other<br />
Source: SAMA, Al Rajhi Capital<br />
Demand deposit Time & savings deposit Other deposits<br />
Foreign Liabilities Capital account (total) Inter-bank Liabilities<br />
Other Liabilities<br />
Source: SAMA, Al Rajhi Capital<br />
Disclosures Please refer to the important disclosures at the back of this report. 6
Q1 2012<br />
Al Rajhi<br />
Q2 2012<br />
Q3 2012<br />
Samba<br />
Q4 2012<br />
Riyad<br />
Q1 2013<br />
Q2 2013<br />
BSF<br />
Q3 2013<br />
Q4 2013<br />
SABB<br />
Q1 2014<br />
ANB<br />
Q2 2014<br />
Q3 2014<br />
Al Awwal<br />
Q4 2014<br />
Q1 2015<br />
SIB<br />
Q2 2015<br />
Alinma<br />
Q3 2015<br />
Q4 2015<br />
AlJazira<br />
Q1 2016<br />
Q2 2016<br />
Albilad<br />
Q3 2016<br />
NCB<br />
Q4 2016<br />
Q1 2012<br />
Q1 2012<br />
Q2 2012<br />
Q2 2012<br />
Q3 2012<br />
Q3 2012<br />
Q4 2012<br />
Q4 2012<br />
Q1 2013<br />
Q1 2013<br />
Q2 2013<br />
Q2 2013<br />
Q3 2013<br />
Q3 2013<br />
Q4 2013<br />
Q4 2013<br />
Q1 2014<br />
Q1 2014<br />
Q2 2014<br />
Q2 2014<br />
Q3 2014<br />
Q3 2014<br />
Q4 2014<br />
Q4 2014<br />
Q1 2015<br />
Q1 2015<br />
Q2 2015<br />
Q2 2015<br />
Q3 2015<br />
Q3 2015<br />
Q4 2015<br />
Q4 2015<br />
Q1 2016<br />
Q1 2016<br />
Q2 2016<br />
Q2 2016<br />
Q3 2016<br />
Q3 2016<br />
Q4 2016<br />
Q4 2016<br />
Saudi Banks Sector<br />
Banks –Finance<br />
6 April 2017<br />
Figure 20 Breakup of banks’ aggregate assets<br />
Figure 21 Breakup of bank's aggregate liabilities<br />
100%<br />
90%<br />
80%<br />
70%<br />
60%<br />
50%<br />
40%<br />
30%<br />
20%<br />
10%<br />
0%<br />
57% 60% 60% 61% 59% 61% 60% 61% 65%<br />
59% 59% 61% 60% 61% 60% 61% 63% 65% 65% 63%<br />
24% 23% 21% 23% 23% 25% 24% 23% 21%<br />
21% 23% 22% 24% 24% 24% 21% 19%<br />
18%18% 18%<br />
100%<br />
90%<br />
80%<br />
70%<br />
60%<br />
50%<br />
40%<br />
30%<br />
20%<br />
10%<br />
0%<br />
Title:<br />
Source:<br />
36% 37% 35% Please 36% fill in the 28% values 28% above 25% to have 26% them entered 28% in 30% your report<br />
37% 37% 35% 35%<br />
27% 28% 24% 29% 29% 29%<br />
40%<br />
39%<br />
39%<br />
40%<br />
42%<br />
43%<br />
42%<br />
43%<br />
50%<br />
50%<br />
50%<br />
50%<br />
53%<br />
54%<br />
52%<br />
48%<br />
48%<br />
46%<br />
45%<br />
47%<br />
Cash with SAMA<br />
Investments<br />
Property & Equipment<br />
Due from other financial institutions<br />
Net financing<br />
Other assets<br />
Due to banks & other fin. institutions<br />
Other deposits<br />
Shareholder's equity<br />
Demand deposits<br />
Other Liabilities<br />
Source: Company data, Al Rajhi Capital<br />
Source: Company data, Al Rajhi Capital<br />
Figure 22 Bank wise breakdown of loans by economic activity<br />
Figure 23 Government deposits as a % of total liabilities<br />
100%<br />
90%<br />
80%<br />
70%<br />
60%<br />
50%<br />
40%<br />
30%<br />
20%<br />
10%<br />
0%<br />
1%<br />
7%<br />
17%<br />
16%<br />
23%<br />
21% 16% 15% 19%<br />
36% 4% 34%<br />
32%<br />
40% 5%<br />
3% 6%<br />
5%<br />
7%<br />
7%<br />
27%<br />
27% 3%<br />
2%<br />
10% 22%<br />
20%<br />
70%<br />
3%<br />
42% 35%<br />
15%<br />
35%<br />
9%<br />
27%<br />
15% 18% 17% 18% 22% 17% 14%<br />
12%<br />
10% 13%<br />
12%<br />
16%<br />
12%<br />
22%<br />
12%<br />
18% 24%<br />
5%<br />
21% 23% 19%<br />
15%<br />
23% 19%<br />
12%<br />
22% 21%<br />
13% 10% 10%<br />
4%<br />
9%<br />
14% 7% 10%<br />
4%<br />
7%<br />
17.0%<br />
16.5%<br />
16.0%<br />
15.5%<br />
15.0%<br />
14.5%<br />
14.0%<br />
13.5%<br />
13.0%<br />
Construction + Building Commercial Industrial/manufact.<br />
Personal Services Others<br />
Source: Company data, Al Rajhi Capital<br />
Source: SAMA, Al Rajhi Capital<br />
Disclosures Please refer to the important disclosures at the back of this report. 7
Saudi Banks Sector<br />
Banks –Finance<br />
6 April 2017<br />
Company-wise information<br />
Figure 24 Net special Income<br />
Market share<br />
Bank Q4 2015 Q3 2016 Q4 2016 y-o-y q-o-q Q4 2015 Q4 2016<br />
Al Rajhi 2,487 2,913 2,921 17.5% 0.3% 18.4% 19.8%<br />
Samba 1,189 1,466 1,325 11.5% -9.6% 8.8% 9.0%<br />
Riyad 1,341 1,321 1,363 1.6% 3.2% 9.9% 9.2%<br />
BSF 1,032 1,136 1,017 -1.5% -10.4% 7.6% 6.9%<br />
SABB 1,076 1,222 1,236 14.8% 1.1% 8.0% 8.4%<br />
ANB 901 1,067 1,031 14.4% -3.4% 6.7% 7.0%<br />
Al Awwal 593 664 638 7.6% -4.0% 4.4% 4.3%<br />
SIB 428 461 378 -11.7% -18.0% 3.2% 2.6%<br />
Alinma 571 665 706 23.7% 6.2% 4.2% 4.8%<br />
AlJazira 390 407 405 3.7% -0.6% 2.9% 2.7%<br />
Albilad 310 370 365 17.6% -1.5% 2.3% 2.5%<br />
NCB 3,211 3,470 3,365 4.8% -3.0% 23.7% 22.8%<br />
Market 13,529 15,162 14,749 9.0% -2.7% 100.0% 100.0%<br />
Source: Company data, Al Rajhi Capital<br />
Figure 25 Fees and Commission<br />
Market share<br />
Bank Q4 2015 Q3 2016 Q4 2016 y-o-y q-o-q Q4 2015 Q4 2016<br />
Al Rajhi 849 693 580 -31.7% -16.3% 19.7% 15.1%<br />
Samba 359 354 400 11.3% 13.1% 8.3% 10.4%<br />
Riyad 438 320 356 -18.9% 11.3% 10.2% 9.2%<br />
BSF 278 313 324 16.6% 3.6% 6.5% 8.4%<br />
SABB 339 303 283 -16.3% -6.4% 7.9% 7.4%<br />
ANB 252 251 219 -13.2% -12.9% 5.9% 5.7%<br />
Al Awwal 209 186 177 -15.4% -4.9% 4.8% 4.6%<br />
SIB 119 96 103 -12.7% 8.2% 2.8% 2.7%<br />
Alinma 182 142 169 -6.9% 19.2% 4.2% 4.4%<br />
AlJazira 251 141 261 4.0% 84.8% 5.8% 6.8%<br />
Albilad 192 199 201 4.7% 0.8% 4.5% 5.2%<br />
NCB 839 754 779 -7.1% 3.4% 19.5% 20.2%<br />
Total 4,307 3,751 3,852 -10.6% 2.7% 100.0% 100.0%<br />
Source: Company data, Al Rajhi Capital<br />
Figure 26 Total operating income<br />
Market share<br />
Bank Q4 2015 Q3 2016 Q4 2016 y-o-y q-o-q Q4 2015 Q4 2016<br />
Al Rajhi 3,594 3,877 3,812 6.1% -1.7% 18.3% 18.7%<br />
Samba 1,843 2,019 1,848 0.3% -8.5% 9.4% 9.1%<br />
Riyad 1,884 1,855 1,843 -2.2% -0.6% 9.6% 9.1%<br />
BSF 1,534 1,616 1,554 1.3% -3.8% 7.8% 7.6%<br />
SABB 1,549 1,687 1,664 7.4% -1.4% 7.9% 8.2%<br />
ANB 1,349 1,510 1,322 -2.0% -12.4% 6.9% 6.5%<br />
Al Awwal 865 911 910 5.1% -0.2% 4.4% 4.5%<br />
SIB 615 633 570 -7.4% -10.0% 3.1% 2.8%<br />
Alinma 780 829 957 22.7% 15.5% 4.0% 4.7%<br />
AlJazira 581 575 590 1.6% 2.6% 3.0% 2.9%<br />
Albilad 588 647 683 16.1% 5.6% 3.0% 3.4%<br />
NCB 4,444 4,725 4,600 3.5% -2.6% 22.6% 22.6%<br />
Total: 19,626 20,884 20,354 3.7% -2.5% 100.0% 100.0%<br />
Source: Company data, Al Rajhi Capital<br />
Figure 27 All operating costs<br />
Market share<br />
Bank Q4 2015 Q3 2016 Q4 2016 y-o-y q-o-q Q4 2015 Q4 2016<br />
Al Rajhi 1,653 1,867 1,765 6.8% -5.5% 17.0% 14.4%<br />
Samba 610 678 758 24.3% 11.9% 6.3% 6.2%<br />
Riyad 1,033 1,125 1,550 50.0% 37.7% 10.6% 12.6%<br />
BSF 584 605 1,180 102.0% 95.0% 6.0% 9.6%<br />
SABB 611 692 1,058 73.3% 52.8% 6.3% 8.6%<br />
ANB 763 789 761 -0.3% -3.5% 7.9% 6.2%<br />
Al Awwal 414 648 1,159 180.1% 78.8% 4.3% 9.4%<br />
SIB 543 414 268 -50.8% -35.3% 5.6% 2.2%<br />
Alinma 389 517 567 45.7% 9.6% 4.0% 4.6%<br />
AlJazira 425 415 438 2.9% 5.6% 4.4% 3.6%<br />
Albilad 371 419 460 24.2% 9.8% 3.8% 3.7%<br />
NCB 2,317 2,763 2,314 -0.1% -16.3% 23.9% 18.8%<br />
Total 9,714 10,933 12,277 26.4% 12.3% 100.0% 100.0%<br />
Source: Company data, Al Rajhi Capital<br />
Figure 28 NIM (as a % of interest earning assets)<br />
Change (bps)<br />
Bank Q4 2015 Q1 2016 Q2 2016 Q3 2016 Q4 2016 y-o-y q-o-q<br />
Al Rajhi 3.6% 3.7% 3.9% 4.1% 4.2% 59.5 0.9<br />
Samba 2.3% 2.4% 2.6% 2.9% 2.8% 50.7 (14.4)<br />
Riyad 2.7% 2.5% 2.6% 2.6% 2.8% 0.8 17.5<br />
BSF 2.5% 2.5% 2.4% 2.5% 2.3% (20.8) (26.4)<br />
SABB 2.4% 2.6% 2.7% 2.9% 3.1% 61.3 17.1<br />
ANB 2.4% 2.6% 2.9% 2.9% 2.8% 40.4 (6.1)<br />
Al Awwal 2.5% 2.4% 2.4% 2.7% 2.6% 17.3 (4.0)<br />
SIB 2.1% 1.9% 1.9% 2.1% 1.8% (27.0) (34.8)<br />
Alinma 3.0% 2.9% 2.8% 2.9% 3.0% 6.0 7.7<br />
AlJazira 2.7% 2.5% 2.5% 2.6% 2.7% 1.9 4.0<br />
Albilad 2.8% 2.8% 2.8% 3.0% 3.1% 29.0 1.0<br />
NCB 3.2% 3.3% 3.3% 3.5% 3.5% 31.2 (1.9)<br />
Total: 2.8% 2.8% 2.9% 3.1% 3.1% 27.4 (2.3)<br />
Source: Company data, Al Rajhi Capital<br />
Figure 29 Brokerage net income<br />
Market share<br />
Bank Q4 2015 Q3 2016 Q4 2016 y-o-y q-o-q Q4 2015 Q4 2016<br />
Al Rajhi 1,333 2,070 2,233 67.5% 7.9% 13.9% 23.4%<br />
Samba 174 107 90 -48.5% -16.2% 1.8% 0.9%<br />
Riyad 98 86 82 -15.8% -3.8% 1.0% 0.9%<br />
BSF 1,587 1,172 1,077 -32.1% -8.1% 16.6% 11.3%<br />
SABB 693 616 642 -7.3% 4.3% 7.2% 6.7%<br />
ANB 1,704 1,729 1,720 1.0% -0.5% 17.8% 18.0%<br />
Al Awwal 543 548 554 2.1% 1.2% 5.7% 5.8%<br />
SIB 397 394 341 -14.2% -13.6% 4.1% 3.6%<br />
Alinma 324 418 449 38.5% 7.2% 3.4% 4.7%<br />
AlJazira 441 496 815 84.9% 64.2% 4.6% 8.5%<br />
Albilad 431 241 227 -47.2% -5.6% 4.5% 2.4%<br />
NCB 1,858 1,568 1,314 -29.3% -16.2% 19.4% 13.8%<br />
Total 9,582 9,444 9,544 -0.4% 1.1% 100.0% 100.0%<br />
Source: Company data, Al Rajhi Capital<br />
Disclosures Please refer to the important disclosures at the back of this report. 8
Saudi Banks Sector<br />
Banks –Finance<br />
6 April 2017<br />
Figure 30 NIM (as a % of interest earning assets)<br />
Change (bps)<br />
Bank Q4 2015 Q1 2016 Q2 2016 Q3 2016 Q4 2016 y-o-y q-o-q<br />
Al Rajhi 3.6% 3.7% 3.9% 4.1% 4.2% 59.5 0.9<br />
Samba 2.3% 2.4% 2.6% 2.9% 2.8% 50.7 (14.4)<br />
Riyad 2.7% 2.5% 2.6% 2.6% 2.8% 0.8 17.5<br />
BSF 2.5% 2.5% 2.4% 2.5% 2.3% (20.8) (26.4)<br />
SABB 2.4% 2.6% 2.7% 2.9% 3.1% 61.3 17.1<br />
ANB 2.4% 2.6% 2.9% 2.9% 2.8% 40.4 (6.1)<br />
Alawwal 2.5% 2.4% 2.4% 2.7% 2.6% 17.3 (4.0)<br />
SIB 2.1% 1.9% 1.9% 2.1% 1.8% (27.0) (34.8)<br />
Alinma 3.0% 2.9% 2.8% 2.9% 3.0% 6.0 7.7<br />
AlJazira 2.7% 2.5% 2.5% 2.6% 2.7% 1.9 4.0<br />
Albilad 2.8% 2.8% 2.8% 3.0% 3.1% 29.0 1.0<br />
NCB 3.2% 3.3% 3.3% 3.5% 3.5% 31.2 (1.9)<br />
Total: 2.8% 2.8% 2.9% 3.1% 3.1% 27.4 (2.3)<br />
Source: Company data, Al Rajhi Capital<br />
Figure 31 Net income<br />
Market share<br />
Bank Q4 2015 Q3 2016 Q4 2016 y-o-y q-o-q Q4 2015 Q4 2016<br />
Al Rajhi 1,941 2,009 2,047 5.5% 1.9% 19.6% 25.3%<br />
Samba 1,232 1,341 1,090 -11.6% -18.8% 12.4% 13.5%<br />
Riyad 851 729 293 -65.5% -59.8% 8.6% 3.6%<br />
BSF 950 1,010 374 -60.6% -63.0% 9.6% 4.6%<br />
SABB 939 995 606 -35.5% -39.1% 9.5% 7.5%<br />
ANB 586 722 562 -4.1% -22.2% 5.9% 7.0%<br />
Al Awwal 451 263 (249) -155.2% -194.9% 4.6% -3.1%<br />
SIB 72 219 302 321.1% 37.7% 0.7% 3.7%<br />
Alinma 391 312 390 -0.2% 25.2% 3.9% 4.8%<br />
AlJazira 155 161 152 -1.9% -5.1% 1.6% 1.9%<br />
Albilad 217 228 223 2.5% -2.2% 2.2% 2.8%<br />
NCB 2,127 1,962 2,287 7.5% 16.6% 21.5% 28.3%<br />
Total 9,912 9,951 8,077 -18.5% -18.8% 100.0% 100.0%<br />
Source: Company data, Al Rajhi Capital<br />
Figure 32 Net loans (SAR bn)<br />
Market share<br />
Bank Q4 2015 Q3 2016 Q4 2016 y-o-y q-o-q Q4 2015 Q4 2016<br />
Al Rajhi 210.2 225.9 225.0 7.0% -0.4% 15.3% 16.1%<br />
Samba 130.0 129.8 125.2 -3.7% -3.5% 9.4% 9.0%<br />
Riyad 145.1 152.6 142.9 -1.5% -6.4% 10.5% 10.2%<br />
BSF 123.8 133.9 129.5 4.6% -3.3% 9.0% 9.3%<br />
SABB 125.9 125.9 121.0 -4.0% -3.9% 9.1% 8.7%<br />
ANB 115.7 115.6 115.5 -0.1% -0.1% 8.4% 8.3%<br />
Al Awwal 76.4 77.3 72.7 -4.8% -5.9% 5.5% 5.2%<br />
SIB 60.3 61.3 60.2 0.0% -1.7% 4.4% 4.3%<br />
Alinma 57.0 69.3 70.3 23.3% 1.5% 4.1% 5.0%<br />
AlJazira 42.2 43.2 42.1 -0.2% -2.5% 3.1% 3.0%<br />
Albilad 34.3 36.2 36.2 5.6% -0.2% 2.5% 2.6%<br />
NCB 256.6 259.9 257.5 0.3% -0.9% 18.6% 18.4%<br />
Total 1,377.4 1,430.9 1,398.2 1.5% -2.3% 100% 100%<br />
Source: Company data, Al Rajhi Capital<br />
Figure 33 Interest earning assets (SAR bn)<br />
Market share<br />
Bank Q4 2015 Q3 2016 Q4 2016 y-o-y q-o-q Q4 2015 Q4 2016<br />
Al Rajhi 277.0 276.5 285.6 3.1% 3.3% 14.1% 14.9%<br />
Samba 214.4 195.3 186.2 -13.1% -4.6% 10.9% 9.7%<br />
Riyad 199.1 203.2 192.6 -3.2% -5.2% 10.1% 10.1%<br />
BSF 168.5 182.0 178.9 6.2% -1.7% 8.6% 9.4%<br />
SABB 172.9 165.7 158.5 -8.4% -4.4% 8.8% 8.3%<br />
ANB 154.5 148.9 145.1 -6.1% -2.6% 7.9% 7.6%<br />
Al Awwal 98.4 98.9 95.0 -3.4% -3.9% 5.0% 5.0%<br />
SIB 85.7 85.5 84.0 -1.9% -1.7% 4.4% 4.4%<br />
Alinma 80.6 92.7 94.1 16.8% 1.5% 4.1% 4.9%<br />
AlJazira 58.3 60.7 59.9 2.7% -1.4% 3.0% 3.1%<br />
Albilad 45.6 48.3 47.2 3.6% -2.3% 2.3% 2.5%<br />
NCB 407.9 390.2 384.3 -5.8% -1.5% 20.8% 20.1%<br />
Total 1,962.9 1,947.7 1,911.4 -2.6% -1.9% 100% 100%<br />
Source: Company data, Al Rajhi Capital<br />
Figure 34 Provisions<br />
Market share<br />
Banks Q4 2015 Q3 2016 Q4 2016 y-o-y q-o-q Q4 2015 Q4 2016<br />
Al Rajhi 950 571 508 -46.5% -11.0% 39.1% 12.3%<br />
Samba 33 62 55 65.3% -11.9% 1.4% 1.3%<br />
Riyad 241 385 761 215.2% 97.6% 9.9% 18.4%<br />
BSF 51 54 636 1158.2% 1069.0% 2.1% 15.4%<br />
SABB 113 190 557 392.4% 193.8% 4.7% 13.5%<br />
ANB 216 241 192 -10.9% -20.3% 8.9% 4.6%<br />
Al Awwal 123 340 745 507.3% 119.3% 5.1% 18.0%<br />
SIB 169 195 40 -76.3% -79.5% 7.0% 1.0%<br />
Alinma 38 150 121 222.6% -19.4% 1.5% 2.9%<br />
AlJazira (12) 29 38 NM 33.4% -0.5% 0.9%<br />
Albilad 8 51 44 470.3% -13.1% 0.3% 1.1%<br />
NCB 499 956 439 -12.0% -54.1% 20.6% 10.6%<br />
Total 2,428 3,224 4,137 70.4% 28.3% 100.0% 100.0%<br />
Source: Company data, Al Rajhi Capital<br />
Figure 35 Asset yield<br />
Change (bps)<br />
Bank Q4 2015 Q1 2016 Q2 2016 Q3 2016 Q4 2016 y-o-y q-o-q<br />
Al Rajhi 3.7% 3.8% 4.1% 4.4% 4.4% 71.9 1.2<br />
Samba 2.6% 2.8% 3.1% 3.6% 3.8% 117.0 21.5<br />
Riyad 3.3% 3.3% 3.5% 3.7% 3.9% 67.8 24.5<br />
BSF 3.0% 3.2% 3.3% 3.5% 3.5% 49.6 6.0<br />
SABB 2.8% 3.2% 3.5% 3.8% 3.9% 109.3 18.1<br />
ANB 3.0% 3.4% 3.9% 4.0% 4.2% 118.1 19.4<br />
Al Awwal 3.3% 3.6% 3.9% 4.4% 4.6% 132.6 21.9<br />
SIB 3.1% 3.3% 3.5% 4.0% 4.0% 90.9 2.9<br />
Alinma 3.4% 3.5% 3.7% 4.0% 4.2% 82.8 29.1<br />
AlJazira 4.9% 3.5% 3.8% 4.0% 6.2% 138.3 219.2<br />
Albilad 3.1% 3.3% 3.5% 3.8% 4.0% 93.1 14.1<br />
NCB 4.1% 4.1% 4.2% 4.4% 4.9% 86.4 54.1<br />
Market 3.4% 3.5% 3.7% 4.0% 4.3% 90.9 29.2<br />
Source: Company data, Al Rajhi Capital<br />
Disclosures Please refer to the important disclosures at the back of this report. 9
Saudi Banks Sector<br />
Banks –Finance<br />
6 April 2017<br />
Figure 36 Gross NPAs<br />
Change (bps)<br />
Bank Q4 2015 Q1 2016 Q2 2016 Q3 2016 Q4 2016 y-o-y q-o-q<br />
Al Rajhi 1.5% 1.6% 1.4% 1.4% 1.2% (27.4) (14.1)<br />
Samba 0.8% 0.8% 0.9% 0.8% 0.8% 0.3 1.8<br />
Riyad 0.9% 0.9% 0.9% 0.8% 0.8% (12.9) (3.7)<br />
BSF 0.9% 0.9% 0.8% 0.8% 1.3% 39.3 48.6<br />
SABB 1.2% 1.1% 1.2% 1.3% 1.3% 15.5 1.4<br />
ANB 1.1% 1.1% 0.8% 0.9% 0.9% (21.4) (1.9)<br />
Al Awwal 1.1% 1.1% 1.1% 1.2% 2.2% 115.1 98.4<br />
SIB 0.7% 0.7% 0.8% 0.8% 1.7% 101.4 93.2<br />
Alinma 0.7% 0.7% 0.7% 0.7% 0.8% 2.7 8.3<br />
AlJazira 0.8% 0.9% 0.8% 1.1% 1.1% 29.9 1.0<br />
Albilad 1.5% 1.4% 1.4% 1.5% 1.4% (10.2) (10.8)<br />
NCB 1.4% 1.5% 1.4% 1.6% 1.5% 8.6 (7.8)<br />
Source: Company data, Al Rajhi Capital<br />
Figure 37 NPL coverage ratio<br />
Change (bps)<br />
Bank Q4 2015 Q1 2016 Q2 2016 Q3 2016 Q4 2016 y-o-y q-o-q<br />
Al Rajhi 177% 163% 195% 201% 231% 5,457 3,014<br />
Samba 181% 183% 165% 170% 174% (724) 384<br />
Riyad 140% 144% 152% 170% 223% 8,284 5,213<br />
BSF 207% 213% 216% 220% 176% (3,100) (4,383)<br />
SABB 164% 167% 166% 158% 175% 1,067 1,609<br />
ANB 225% 234% 288% 259% 270% 4,533 1,106<br />
Al Awwal 167% 167% 168% 156% 130% (3,683) (2,636)<br />
SIB 187% 211% 212% 196% 93% (9,437) (10,297)<br />
Alinma 175% 178% 175% 172% 105% (6,989) (6,722)<br />
AlJazira 173% 173% 168% 151% 156% (1,665) 485<br />
Albilad 168% 176% 187% 185% 198% 3,042 1,368<br />
NCB 151% 146% 145% 147% 151% (8) 419<br />
Source: Company data, Al Rajhi Capital<br />
Figure 38 Investments (SAR bn)<br />
Market share<br />
Bank Q4 2015 Q3 2016 Q4 2016 y-o-y q-o-q Q4 2015 Q4 2016<br />
Al Rajhi 39.9 33.8 34.0 -14.7% 0.8% 8.9% 8.7%<br />
Samba 70.0 53.7 51.4 -26.5% -4.3% 15.6% 13.2%<br />
Riyad 44.8 44.0 45.2 0.9% 2.6% 10.0% 11.6%<br />
BSF 28.4 24.9 24.1 -15.3% -3.5% 6.4% 6.2%<br />
SABB 35.5 29.0 29.3 -17.6% 0.8% 7.9% 7.5%<br />
ANB 33.3 25.7 25.5 -23.3% -0.5% 7.4% 6.6%<br />
Al Awwal 21.3 20.9 21.3 0.0% 1.9% 4.8% 5.5%<br />
SIB 19.0 20.5 21.4 13.0% 4.4% 4.2% 5.5%<br />
Alinma 6.5 6.3 6.2 -4.9% -2.7% 1.4% 1.6%<br />
AlJazira 11.4 16.5 16.4 44.0% -0.3% 2.6% 4.2%<br />
Albilad 2.9 3.0 3.1 4.5% 1.3% 0.7% 0.8%<br />
NCB 134.1 111.5 111.5 -16.8% 0.0% 30.0% 28.6%<br />
Total 447.0 389.9 389.4 -12.9% -0.1% 100% 100%<br />
Source: Company data, Al Rajhi Capital<br />
Figure 39 Total assets (SAR bn)<br />
Market share<br />
Bank Q4 2015 Q3 2016 Q4 2016 y-o-y q-o-q Q4 2015 Q4 2016<br />
Al Rajhi 315.6 330.5 339.7 7.6% 2.8% 14.5% 15.3%<br />
Samba 235.2 238.3 231.5 -1.6% -2.9% 10.8% 10.5%<br />
Riyad 223.3 223.5 217.6 -2.6% -2.6% 10.3% 9.8%<br />
BSF 183.7 195.7 203.4 10.7% 3.9% 8.5% 9.2%<br />
SABB 187.8 185.9 186.1 -0.9% 0.1% 8.7% 8.4%<br />
ANB 170.4 167.3 170.0 -0.2% 1.6% 7.9% 7.7%<br />
Al Awwal 108.1 106.9 105.1 -2.8% -1.7% 5.0% 4.7%<br />
SIB 93.6 96.3 94.4 0.8% -2.0% 4.3% 4.3%<br />
Alinma 88.7 102.9 104.7 18.0% 1.7% 4.1% 4.7%<br />
AlJazira 63.3 66.0 66.3 4.8% 0.4% 2.9% 3.0%<br />
Albilad 51.2 55.7 53.9 5.2% -3.3% 2.4% 2.4%<br />
NCB 448.6 438.8 441.5 -1.6% 0.6% 20.7% 19.9%<br />
Total 2,170 2,208 2,214 2.1% 0.3% 100% 100%<br />
Source: Company data, Al Rajhi Capital<br />
Figure 40 Total deposits (SAR bn)<br />
Market share<br />
Bank Q4 2015 Q3 2016 Q4 2016 y-o-y q-o-q Q4 2015 Q4 2016<br />
Al Rajhi 257.8 272.6 272.6 5.7% 0.0% 15.5% 16.3%<br />
Samba 171.8 174.0 172.1 0.2% -1.1% 10.3% 10.3%<br />
Riyad 167.9 160.8 156.7 -6.7% -2.6% 10.1% 9.4%<br />
BSF 141.9 147.3 158.5 11.7% 7.6% 8.5% 9.5%<br />
SABB 148.9 144.1 140.6 -5.5% -2.4% 8.9% 8.4%<br />
ANB 135.8 128.2 135.9 0.1% 6.0% 8.2% 8.1%<br />
Al Awwal 89.1 84.2 85.4 -4.2% 1.4% 5.4% 5.1%<br />
SIB 70.5 66.4 65.6 -6.9% -1.2% 4.2% 3.9%<br />
Alinma 65.7 77.3 80.6 22.7% 4.3% 3.9% 4.8%<br />
AlJazira 49.8 50.3 51.6 3.7% 2.5% 3.0% 3.1%<br />
Albilad 42.2 41.2 40.2 -4.6% -2.4% 2.5% 2.4%<br />
NCB 323.9 311.2 315.6 -2.5% 1.4% 19.5% 18.8%<br />
Total 1,665.1 1,657.8 1,675.4 0.6% 1.1% 100% 100%<br />
Source: Company data, Al Rajhi Capital<br />
Figure 41 Demand deposit % of total deposits<br />
Change (bps)<br />
Bank Q4 2015 Q1 2016 Q2 2016 Q3 2016 Q4 2016 y-o-y q-o-q<br />
Al Rajhi 93% 93% 92% 90% 90% (333) 44<br />
Samba 64% 63% 61% 59% 60% (414) 129<br />
Riyad 43% 44% 44% 43% 50% 671 645<br />
BSF 63% 65% 62% 56% 56% (695) (51)<br />
SABB 59% 56% 55% 55% 59% (7) 396<br />
ANB 49% 52% 51% 50% 48% (91) (235)<br />
Al Awwal 60% 58% 58% 58% 60% (35) 170<br />
SIB 30% 31% 32% 32% 36% 689 424<br />
Alinma 54% 55% 53% 51% 54% (41) 254<br />
AlJazira 50% 51% 49% 47% 49% (67) 239<br />
Albilad 68% 64% 63% 65% 67% (53) 169<br />
NCB 71% 71% 70% 70% 71% 17 126<br />
Total: 64% 64% 63% 62% 63% (46) 160<br />
Source: Company data, Al Rajhi Capital<br />
Disclosures Please refer to the important disclosures at the back of this report. 10
Saudi Banks Sector<br />
Banks –Finance<br />
6 April 2017<br />
Figure 42 Cost of deposits<br />
Change (bps)<br />
Bank Q4 2015 Q1 2016 Q2 2016 Q3 2016 Q4 2016 y-o-y q-o-q<br />
Al Rajhi 0.12% 0.19% 0.20% 0.24% 0.24% 12 0<br />
Samba 0.39% 0.55% 0.64% 0.73% 1.09% 70 36<br />
Riyad 0.61% 1.00% 1.07% 1.40% 1.47% 86 7<br />
BSF 0.69% 0.90% 1.08% 1.22% 1.52% 83 30<br />
SABB 0.47% 0.67% 0.88% 1.01% 1.01% 54 (0)<br />
ANB 0.69% 0.95% 1.04% 1.31% 1.55% 86 23<br />
Al Awwal 0.92% 1.36% 1.74% 2.00% 2.25% 134 26<br />
SIB 1.28% 1.72% 2.03% 2.38% 2.86% 158 48<br />
Alinma 0.56% 0.72% 1.11% 1.21% 1.45% 89 24<br />
AlJazira 2.43% 1.16% 1.52% 1.71% 4.20% 178 250<br />
Albilad 0.31% 0.58% 0.86% 0.93% 1.09% 78 16<br />
NCB 1.08% 0.99% 1.05% 1.16% 1.82% 73 66<br />
Total 0.70% 0.82% 0.95% 1.10% 1.43% 74 34<br />
Source: Company data, Al Rajhi Capital<br />
Figure 43 Loan to deposit ratio<br />
Change (bps)<br />
Bank Q4 2015 Q1 2016 Q2 2016 Q3 2016 Q4 2016 y-o-y q-o-q<br />
Al Rajhi 81.5% 81.7% 82.9% 82.9% 82.5% 100 (32)<br />
Samba 75.7% 74.2% 76.0% 74.6% 72.8% (289) (184)<br />
Riyad 86.4% 92.4% 94.3% 94.9% 91.2% 478 (370)<br />
BSF 87.3% 88.1% 93.4% 90.9% 81.7% (555) (924)<br />
SABB 84.6% 85.8% 87.2% 87.4% 86.0% 142 (135)<br />
ANB 85.2% 87.9% 91.3% 90.2% 85.0% (20) (517)<br />
Al Awwal 85.8% 91.6% 90.1% 91.8% 85.2% (55) (654)<br />
SIB 85.5% 87.2% 90.0% 92.2% 91.8% 632 (45)<br />
Alinma 86.8% 87.6% 89.6% 89.6% 87.2% 45 (237)<br />
AlJazira 84.7% 83.3% 86.6% 85.8% 81.6% (316) (423)<br />
Albilad 81.2% 85.0% 87.7% 87.9% 89.9% 871 204<br />
NCB 79.2% 81.4% 84.1% 83.5% 81.6% 235 (192)<br />
Total: 83.7% 85.5% 87.8% 87.6% 84.7% 106 (292)<br />
Source: Company data, Al Rajhi Capital<br />
Disclosures Please refer to the important disclosures at the back of this report. 11
Saudi Banks Sector<br />
Banks –Finance<br />
6 April 2017<br />
Segmental breakup<br />
Figure 44 Net income breakup<br />
Bank Retail Corporate Treasury<br />
Investment<br />
services &<br />
brokerage<br />
Others<br />
Al Rajhi 52% 17% 26% 5% 0%<br />
Samba 28% 41% 28% 2% 0%<br />
Riyad 72% -25% 67% 10% -24%<br />
BSF 11% -5% 86% 8% 0%<br />
SABB 15% 38% 44% 0% 4%<br />
ANB 52% 37% -4% 4% 12%<br />
Al Awwal -15% 115% 2% -2% 0%<br />
SIB -2% 78% 35% 3% -13%<br />
Alinma 12% 45% 33% 9% 0%<br />
AlJazira 15% 17% 78% 9% -18%<br />
Albilad 10% 38% 23% 7% 22%<br />
NCB 29% 23% 41% 3% 5%<br />
Source: Company data, Al Rajhi Capital<br />
Figure 45 Total assets breakup<br />
Bank Retail Corporate Treasury<br />
Investment<br />
services &<br />
brokerage<br />
Others<br />
Al Rajhi 52% 18% 29% 0.7% 0%<br />
Samba 16% 46% 39% 0.0% 0%<br />
Riyad 18% 48% 33% 0.0% 1.5%<br />
BSF 8% 57% 34% 0.5% 0%<br />
SABB 17% 50% 33% 0.0% 0%<br />
ANB 23% 48% 27% 1.0% 1.3%<br />
Al Awwal 20% 49% 30% 0.5% 0%<br />
SIB 30% 38% 28% 0.4% 3%<br />
Alinma 17% 55% 28% 0.4% 0%<br />
AlJazira 30% 34% 34% 1.2% 0.2%<br />
Albilad 34% 42% 21% 0.4% 2.4%<br />
NCB 24% 32% 34% 0.3% 9.2%<br />
Source: Company data, Al Rajhi Capital<br />
Figure 46 Retail operating income<br />
Market share<br />
Bank Q4 2015 Q3 2016 Q4 2016 y-o-y q-o-q Q4 2015 Q4 2016<br />
Al Rajhi 3,089 2,821 2,594 -16.0% -8.0% 34.1% 29.6%<br />
Samba 565 965 811 43.6% -15.9% 6.2% 9.2%<br />
Riyad 816 539 495 -39.3% -8.2% 9.0% 5.6%<br />
BSF 378 370 356 -5.8% -3.7% 4.2% 4.1%<br />
SABB 571 612 588 3.0% -4.0% 6.3% 6.7%<br />
ANB 493 497 746 51.4% 50.0% 5.4% 8.5%<br />
Al Awwal 302 371 384 27.1% 3.5% 3.3% 4.4%<br />
SIB 240 275 184 -23.5% -33.3% 2.7% 2.1%<br />
Alinma 263 297 288 9.5% -3.0% 2.9% 3.3%<br />
AlJazira 249 230 238 -4.3% 3.3% 2.7% 2.7%<br />
Albilad 321 330 324 1.1% -1.8% 3.5% 3.7%<br />
NCB 1,768 1,914 1,770 0.1% -7.5% 19.5% 20.2%<br />
Total 9,054 9,222 8,778 -3.0% -4.8% 100.0% 100.0%<br />
Source: Company data, Al Rajhi Capital<br />
Figure 47 Retail net operating income<br />
Market share<br />
Bank Q4 2015 Q3 2016 Q4 2016 y-o-y q-o-q Q4 2015 Q4 2016<br />
Al Rajhi 1906 1330 1073 -43.7% -19.3% 47.3% 38.1%<br />
Samba 168 307 309 83.9% 0.9% 4.2% 11.0%<br />
Riyad 373 226 213 -43.0% -6.1% 9.3% 7.5%<br />
BSF 125 73 43 -66.1% -41.8% 3.1% 1.5%<br />
SABB 184 226 88 -52.3% -61.0% 4.6% 3.1%<br />
ANB 126 24 295 133.2% 1124.3% 3.1% 10.5%<br />
Al Awwal 109 110 37 -65.8% -66.0% 2.7% 1.3%<br />
SIB 104 99 -7 -106.3% -106.6% 2.6% -0.2%<br />
Alinma 68 69 48 -28.5% -29.9% 1.7% 1.7%<br />
AlJazira 32 20 22 -31.0% 13.4% 0.8% 0.8%<br />
Albilad 40 35 23 -42.7% -35.5% 1.0% 0.8%<br />
NCB 792 601 670 -15.3% 11.5% 19.7% 23.8%<br />
Total 4,028 3,120 2,815 -30.1% -9.8% 100.0% 100.0%<br />
Source: Company data, Al Rajhi Capital<br />
Figure 48 Total retail segment assets<br />
Market share<br />
Bank Q4 2015 Q3 2016 Q4 2016 y-o-y q-o-q Q4 2015 Q4 2016<br />
Al Rajhi 169,972 178,424 177,178 4.2% -0.7% 32.0% 32.2%<br />
Samba 38,886 38,410 35,982 -7.5% -6.3% 7.3% 6.5%<br />
Riyad 39,686 39,102 39,437 -0.6% 0.9% 7.5% 7.2%<br />
BSF 15,978 17,040 16,500 3.3% -3.2% 3.0% 3.0%<br />
SABB 33,000 33,456 31,751 -3.8% -5.1% 6.2% 5.8%<br />
ANB 39,173 40,324 38,646 -1.3% -4.2% 7.4% 7.0%<br />
Al Awwal 17,343 21,195 21,469 23.8% 1.3% 3.3% 3.9%<br />
SIB 26,218 26,789 28,418 8.4% 6.1% 4.9% 5.2%<br />
Alinma 15,466 17,699 17,590 13.7% -0.6% 2.9% 3.2%<br />
AlJazira 19,624 20,201 20,167 2.8% -0.2% 3.7% 3.7%<br />
Albilad 15,818 18,078 18,343 16.0% 1.5% 3.0% 3.3%<br />
NCB 99,916 107,786 104,491 4.6% -3.1% 18.8% 19.0%<br />
Total 531,081 558,504 549,974 3.6% -1.5% 100.0% 100.0%<br />
Source: Company data, Al Rajhi Capital<br />
Figure 49 Retail segment yield (operating income/assets)<br />
Change bps<br />
Bank Q4 2015 Q1 2016 Q2 2016 Q3 2016 Q4 2016 y-o-y q-o-q<br />
Al Rajhi 7.3% 6.3% 6.6% 6.4% 5.8% (142.0) (51.5)<br />
Samba 5.8% 6.1% 4.3% 10.0% 8.7% 296.0 (125.8)<br />
Riyad 8.1% 6.4% 6.4% 5.5% 5.0% (303.4) (47.9)<br />
BSF 9.3% 9.6% 9.0% 8.6% 8.5% (84.9) (14.9)<br />
SABB 6.7% 6.8% 7.0% 7.2% 7.2% 54.3 (1.1)<br />
ANB 5.0% 5.4% 5.3% 4.9% 7.6% 251.0 269.2<br />
Al Awwal 7.2% 7.4% 7.2% 7.0% 7.2% (0.4) 15.9<br />
SIB 3.8% 3.5% 4.4% 4.0% 2.7% (114.7) (131.8)<br />
Alinma 6.8% 6.8% 6.5% 6.6% 6.5% (25.0) (10.0)<br />
AlJazira 5.1% 5.0% 4.7% 4.5% 4.7% (37.3) 20.1<br />
Albilad 8.7% 7.9% 7.4% 7.3% 7.1% (152.7) (21.1)<br />
NCB 7.1% 7.6% 7.3% 7.1% 6.7% (46.2) (41.1)<br />
Total 6.8% 6.5% 6.4% 6.6% 6.3% (49.3) (24.6)<br />
Source: Company data, Al Rajhi Capital<br />
Disclosures Please refer to the important disclosures at the back of this report. 12
Saudi Banks Sector<br />
Banks –Finance<br />
6 April 2017<br />
Figure 50 Corporate operating income<br />
Market share<br />
Bank Q4 2015 Q3 2016 Q4 2016 y-o-y q-o-q Q4 2015 Q4 2016<br />
Al Rajhi (13) 608 552 NM -9.2% -0.2% 8.5%<br />
Samba 812 728 636 -21.7% -12.6% 14.5% 9.8%<br />
Riyad 723 730 774 7.0% 5.9% 12.9% 11.9%<br />
BSF 734 787 749 2.1% -4.8% 13.1% 11.5%<br />
SABB 693 773 769 11.0% -0.5% 12.4% 11.9%<br />
ANB 501 506 451 -10.1% -10.9% 9.0% 6.9%<br />
Al Awwal 263 484 464 76.1% -4.2% 4.7% 7.1%<br />
SIB 172 315 302 75.2% -4.0% 3.1% 4.7%<br />
Alinma 395 369 397 0.6% 7.5% 7.1% 6.1%<br />
AlJazira 106 124 129 21.9% 3.8% 1.9% 2.0%<br />
Albilad 196 223 204 4.1% -8.5% 3.5% 3.1%<br />
NCB 1,002 1,274 1,063 6.1% -16.6% 17.9% 16.4%<br />
Total 5,584 6,920 6,489 16.2% -6.2% 100.0% 100.0%<br />
Source: Company data, Al Rajhi Capital<br />
Figure 51 Corporate net operating income<br />
Market share<br />
Bank Q4 2015 Q3 2016 Q4 2016 y-o-y q-o-q Q4 2015 Q4 2016<br />
Al Rajhi (460) 337 341 0.0% 1.2% -12.9% 7.8%<br />
Samba 684 583 449 -34.4% -23.1% 19.2% 13.5%<br />
Riyad 562 376 (74) 0.0% 0.0% 15.7% 8.7%<br />
BSF 518 611 (18) 0.0% 0.0% 14.5% 14.1%<br />
SABB 482 489 228 -52.7% -53.4% 13.5% 11.3%<br />
ANB 210 282 208 -0.9% -26.1% 5.9% 6.5%<br />
Al Awwal 327 234 (286) 0.0% 0.0% 9.1% 5.4%<br />
SIB 101 242 235 132.6% -3.0% 2.8% 5.6%<br />
Alinma 280 253 175 -37.3% -30.6% 7.8% 5.8%<br />
AlJazira (3) 33 26 -934.3% -21.0% -0.1% 0.8%<br />
Albilad 133 111 84 -36.4% -24.2% 3.7% 2.6%<br />
NCB 738 767 532 -27.9% -30.6% 20.7% 17.8%<br />
Total 3,572 4,319 1,901 -46.8% -56.0% 100.0% 100.0%<br />
Source: Company data, Al Rajhi Capital<br />
Figure 52 Total corporate segment assets<br />
Market share<br />
Bank Q4 2015 Q3 2016 Q4 2016 y-o-y q-o-q Q4 2015 Q4 2016<br />
Al Rajhi 54,520 63,778 61,797 13.3% -3.1% 6.1% 6.9%<br />
Samba 106,307 107,875 105,514 -0.7% -2.2% 12.0% 11.8%<br />
Riyad 105,783 114,016 103,814 -1.9% -8.9% 11.9% 11.6%<br />
BSF 110,466 121,578 116,505 5.5% -4.2% 12.4% 13.0%<br />
SABB 96,850 96,859 93,094 -3.9% -3.9% 10.9% 10.4%<br />
ANB 81,991 80,678 81,689 -0.4% 1.3% 9.2% 9.1%<br />
Al Awwal 59,069 56,069 51,274 -13.2% -8.6% 6.7% 5.7%<br />
SIB 38,262 38,803 36,013 -5.9% -7.2% 4.3% 4.0%<br />
Alinma 45,380 56,329 57,567 26.9% 2.2% 5.1% 6.4%<br />
AlJazira 23,028 23,359 22,682 -1.5% -2.9% 2.6% 2.5%<br />
Albilad 22,793 23,197 22,537 -1.1% -2.8% 2.6% 2.5%<br />
NCB 143,147 150,314 142,830 -0.2% -5.0% 16.1% 16.0%<br />
Total 887,596 932,856 895,315 0.9% -4.0% 100.0% 100.0%<br />
Source: Company data, Al Rajhi Capital<br />
Figure 53 Corporate segment yield (operating income/assets)<br />
Change (bps)<br />
Bank Q4 2015 Q1 2016 Q2 2016 Q3 2016 Q4 2016 y-o-y q-o-q<br />
Al Rajhi -0.1% 2.8% 2.7% 3.8% 3.5% 360.6 (27.7)<br />
Samba 3.1% 2.6% 2.7% 2.7% 2.4% (70.7) (31.4)<br />
Riyad 2.8% 2.9% 2.7% 2.5% 2.8% (0.3) 29.7<br />
BSF 2.7% 2.8% 2.7% 2.6% 2.5% (14.3) (12.6)<br />
SABB 2.8% 3.3% 3.2% 3.1% 3.2% 40.1 12.2<br />
ANB 2.5% 2.5% 2.7% 2.5% 2.2% (24.9) (26.5)<br />
Al Awwal 1.8% 3.9% 3.4% 3.4% 3.5% 164.6 2.8<br />
SIB 1.8% 1.6% 3.1% 3.3% 3.2% 142.1 (7.5)<br />
Alinma 3.6% 2.7% 2.8% 2.7% 2.8% (84.1) 10.7<br />
AlJazira 1.8% 2.1% 1.9% 2.1% 2.2% 41.4 15.4<br />
Albilad 3.8% 3.4% 2.8% 3.8% 3.6% (24.3) (26.5)<br />
NCB 2.8% 3.0% 3.0% 3.4% 2.9% 5.2 (47.3)<br />
Total 2.5% 2.8% 2.8% 3.0% 2.8% 29.5 (12.3)<br />
Source: Company data, Al Rajhi Capital<br />
Figure 54 Treasury operating income<br />
Market share<br />
Bank Q4 2015 Q3 2016 Q4 2016 y-o-y q-o-q Q4 2015 Q4 2016<br />
Al Rajhi 324 322 552 NM NM 10.5% 15.6%<br />
Samba 353 171 342 -3.0% 99.7% 11.4% 9.7%<br />
Riyad 179 294 209 16.7% -29.1% 5.8% 5.9%<br />
BSF 363 402 380 4.7% -5.4% 11.7% 10.7%<br />
SABB 285 302 307 7.8% 1.9% 9.2% 8.7%<br />
ANB 200 387 1 -99.5% -99.8% 6.5% 0.0%<br />
Al Awwal (46) 45 45 -199.9% 0.1% -1.5% 1.3%<br />
SIB 260 141 130 -49.9% -7.3% 8.4% 3.7%<br />
Alinma 87 134 199 128.6% 48.8% 2.8% 5.6%<br />
AlJazira 192 203 196 2.4% -3.3% 6.2% 5.6%<br />
Albilad 38 62 67 78.5% 8.1% 1.2% 1.9%<br />
NCB 857 820 1,107 29.2% 35.0% 27.7% 31.3%<br />
Total 3,092 3,283 3,537 14.4% 7.7% 100.0% 100.0%<br />
Source: Company data, Al Rajhi Capital<br />
Figure 55 Treasury net operating income<br />
Market share<br />
Bank Q4 2015 Q3 2016 Q4 2016 y-o-y q-o-q Q4 2015 Q4 2016<br />
Al Rajhi 360 260 540 49.9% 107.4% 15.4% 18.3%<br />
Samba 321 340 308 -4.0% -9.4% 13.7% 10.4%<br />
Riyad 161 233 196 22.2% -15.5% 6.9% 6.7%<br />
BSF 295 308 321 9.0% 4.1% 12.6% 10.9%<br />
SABB 247 264 264 6.8% 0.1% 10.6% 9.0%<br />
ANB 178 335 (25) -114.1% -107.5% 7.6% -0.9%<br />
Al Awwal 13 (81) (5) NM NM 0.5% -0.2%<br />
SIB 100 (48) 106 NM NM 4.3% 3.6%<br />
Alinma 22 (33) 130 NM NM 0.9% 4.4%<br />
AlJazira 142 131 118 -16.7% -9.7% 6.1% 4.0%<br />
Albilad 25 49 52 109.6% 4.9% 1.1% 1.8%<br />
NCB 476 535 944 98.5% 76.4% 20.3% 32.0%<br />
Total 2,340 2,293 2,950 26.1% 28.6% 100.0% 100.0%<br />
Source: Company data, Al Rajhi Capital<br />
Disclosures Please refer to the important disclosures at the back of this report. 13
Saudi Banks Sector<br />
Banks –Finance<br />
6 April 2017<br />
Figure 56 Treasury total assets<br />
Market share<br />
Bank Q4 2015 Q3 2016 Q4 2016 y-o-y q-o-q Q4 2015 Q4 2016<br />
Al Rajhi 89,794 86,244 98,504 NM NM 13.2% 13.9%<br />
Samba 89,876 91,922 89,903 0.0% -2.2% 13.2% 12.7%<br />
Riyad 74,488 67,210 71,022 -4.7% 5.7% 10.9% 10.0%<br />
BSF 55,694 55,947 69,346 24.5% 23.9% 8.2% 9.8%<br />
SABB 57,207 54,973 60,568 5.9% 10.2% 8.4% 8.5%<br />
ANB 44,489 42,458 45,777 2.9% 7.8% 6.5% 6.5%<br />
Al Awwal 31,115 29,115 31,773 2.1% 9.1% 4.6% 4.5%<br />
SIB 26,287 28,258 26,788 1.9% -5.2% 3.9% 3.8%<br />
Alinma 27,554 28,490 29,125 5.7% 2.2% 4.0% 4.1%<br />
AlJazira 20,032 21,841 22,521 12.4% 3.1% 2.9% 3.2%<br />
Albilad 10,582 12,939 11,481 8.5% -11.3% 1.6% 1.6%<br />
NCB 154,322 133,707 152,048 -1.5% 13.7% 22.6% 21.4%<br />
Total 681,440 653,104 708,856 4.0% 8.5% 100.0% 100.0%<br />
Source: Company data, Al Rajhi Capital<br />
Figure 57 Treasury segment yield (Net operating income/assets)<br />
Change (bps)<br />
Bank Q4 2015 Q1 2016 Q2 2016 Q3 2016 Q4 2016 y-o-y q-o-q<br />
Al Rajhi 1.6% 1.9% 1.8% 1.2% 2.3% 75.2 113.7<br />
Samba 1.4% 1.9% 2.0% 1.6% 1.4% (7.0) (23.6)<br />
Riyad 0.9% 0.9% 1.6% 1.4% 1.1% 27.7 (22.3)<br />
BSF 2.1% 2.5% 2.2% 2.1% 2.1% (4.5) (9.8)<br />
SABB 1.7% 2.7% 2.2% 1.9% 1.8% 17.7 (8.4)<br />
ANB 1.6% 2.4% 3.2% 3.3% -0.2% (187.6) (350.6)<br />
Al Awwal 0.2% -0.5% 0.6% -1.1% -0.1% (25.3) 103.2<br />
SIB 1.5% 2.4% 0.7% -0.7% 1.5% 4.6 222.5<br />
Alinma 0.3% 0.9% 1.2% -0.5% 1.8% 147.3 229.2<br />
AlJazira 2.5% 2.4% 2.3% 2.3% 2.1% (39.8) (21.2)<br />
Albilad 1.0% 1.7% 1.7% 1.6% 1.7% 74.0 8.7<br />
NCB 1.1% 2.4% 2.0% 1.6% 2.6% 154.4 108.0<br />
Total 1.3% 1.9% 1.9% 1.4% 1.7% 39.8 32.2<br />
Source: Company data, Al Rajhi Capital<br />
Figure 58 Brokerage operating income<br />
Market share<br />
Bank Q4 2015 Q3 2016 Q4 2016 y-o-y q-o-q Q4 2015 Q4 2016<br />
Al Rajhi 193 126 114 -41.0% -9.4% 21.2% 16.2%<br />
Samba 113 127 58 -48.2% -53.9% 12.4% 8.3%<br />
Riyad 93 61 67 -27.8% 10.5% 10.2% 9.5%<br />
BSF 60 57 69 15.1% 20.9% 6.6% 9.8%<br />
SABB 0 0 0 NA NA NA NA<br />
ANB 41 55 47 15.5% -15.0% 4.5% 6.7%<br />
Al Awwal 13 11 17 31.7% 56.0% 1.4% 2.4%<br />
SIB 23 19 26 16.5% 41.2% 2.5% 3.7%<br />
Alinma 35 41 61 74.0% 49.5% 3.8% 8.6%<br />
AlJazira 53 37 51 -3.9% 38.1% 5.9% 7.3%<br />
Albilad 20 20 35 76.2% 74.4% 2.2% 5.0%<br />
NCB 270 114 160 -40.8% 39.7% 29.5% 22.6%<br />
Total 913 667 706 -22.7% 5.7% 100.0% 100.0%<br />
Source: Company data, Al Rajhi Capital<br />
Figure 59 Brokerage net income<br />
Market share<br />
Bank Q4 2015 Q3 2016 Q4 2016 y-o-y q-o-q Q4 2015 Q4 2016<br />
Al Rajhi 1,333 2,070 2,233 67.5% 7.9% 13.9% 23.4%<br />
Samba 174 107 90 -48.5% -16.2% 1.8% 0.9%<br />
Riyad 98 86 82 -15.8% -3.8% 1.0% 0.9%<br />
BSF 1,587 1,172 1,077 -32.1% -8.1% 16.6% 11.3%<br />
SABB 693 616 642 -7.3% 4.3% 7.2% 6.7%<br />
ANB 1,704 1,729 1,720 1.0% -0.5% 17.8% 18.0%<br />
Al Awwal 543 548 554 2.1% 1.2% 5.7% 5.8%<br />
SIB 397 394 341 -14.2% -13.6% 4.1% 3.6%<br />
Alinma 324 418 449 38.5% 7.2% 3.4% 4.7%<br />
AlJazira 441 496 815 84.9% 64.2% 4.6% 8.5%<br />
Albilad 431 241 227 -47.2% -5.6% 4.5% 2.4%<br />
NCB 1,858 1,568 1,314 -29.3% -16.2% 19.4% 13.8%<br />
Total 9,582 9,444 9,544 -0.4% 1.1% 100.0% 100.0%<br />
Source: Company data, Al Rajhi Capital<br />
Figure 60 Efficiency ratio (costs excluding provisions/total<br />
operating income)<br />
Figure 61 Capital adequacy (tier I + tier II)<br />
90%<br />
80%<br />
70%<br />
60%<br />
50%<br />
40%<br />
30%<br />
20%<br />
10%<br />
0%<br />
25.00%<br />
20.00%<br />
15.00%<br />
10.00%<br />
5.00%<br />
0.00%<br />
Title:<br />
Source:<br />
Please fill in the values above to have them entered in your report<br />
Source: Company data, Al Rajhi Capital<br />
Q4 2015 Q3 2016 Q4 2016<br />
Source: Company data, Al Rajhi Capital<br />
Q4 2015 Q3 2016 Q4 2016<br />
Disclosures Please refer to the important disclosures at the back of this report. 14
Saudi Banks Sector<br />
Banks –Finance<br />
6 April 2017<br />
Disclosures Please refer to the important disclosures at the back of this report. 15
Saudi Banks Sector<br />
Banks –Finance<br />
6 April 2017<br />
IMPORTANT DISCLOSURES FOR U.S. PERSONS<br />
This research report was prepared by Al Rajhi Capital (Al Rajhi), a company authorized to engage in securities activities in Saudi Arabia. Al<br />
Rajhi is not a registered broker-dealer in the United States and, therefore, is not subject to U.S. rules regarding the preparation of research<br />
reports and the independence of research analysts. This research report is provided for distribution to “major U.S. institutional investors” in<br />
reliance on the exemption from registration provided by Rule 15a-6 of the U.S. Securities Exchange Act of 1934, as amended (the<br />
“Exchange Act”).<br />
Any U.S. recipient of this research report wishing to effect any transaction to buy or sell securities or related financial instruments based on<br />
the information provided in this research report should do so only through Rosenblatt Securities Inc, 40 Wall Street 59th Floor, New York<br />
NY 10005, a registered broker dealer in the United States. Under no circumstances should any recipient of this research report effect any<br />
transaction to buy or sell securities or related financial instruments through Al Rajhi. Rosenblatt Securities Inc. accepts responsibility for the<br />
contents of this research report, subject to the terms set out below, to the extent that it is delivered to a U.S. person other than a major U.S.<br />
institutional investor.<br />
The analyst whose name appears in this research report is not registered or qualified as a research analyst with the Financial Industry<br />
Regulatory Authority (“FINRA”) and may not be an associated person of Rosenblatt Securities Inc. and, therefore, may not be subject to<br />
applicable restrictions under FINRA Rules on communications with a subject company, public appearances and trading securities held by a<br />
research analyst account.<br />
Ownership and Material Conflicts of Interest<br />
Rosenblatt Securities Inc. or its affiliates does not ‘beneficially own,’ as determined in accordance with Section 13(d) of the Exchange Act,<br />
1% or more of any of the equity securities mentioned in the report. Rosenblatt Securities Inc, its affiliates and/or their respective officers,<br />
directors or employees may have interests, or long or short positions, and may at any time make purchases or sales as a principal or agent<br />
of the securities referred to herein. Rosenblatt Securities Inc. is not aware of any material conflict of interest as of the date of this<br />
publication.<br />
Compensation and Investment <strong>Banking</strong> Activities<br />
Rosenblatt Securities Inc. or any affiliate has not managed or co-managed a public offering of securities for the subject company in the past<br />
12 months, nor received compensation for investment banking services from the subject company in the past 12 months, neither does it or<br />
any affiliate expect to receive, or intends to seek compensation for investment banking services from the subject company in the next 3<br />
months.<br />
Additional Disclosures<br />
This research report is for distribution only under such circumstances as may be permitted by applicable law. This research report has no<br />
regard to the specific investment objectives, financial situation or particular needs of any specific recipient, even if sent only to a single<br />
recipient. This research report is not guaranteed to be a complete statement or summary of any securities, markets, reports or<br />
developments referred to in this research report. Neither Al Rajhi nor any of its directors, officers, employees or agents shall have any<br />
liability, however arising, for any error, inaccuracy or incompleteness of fact or opinion in this research report or lack of care in this research<br />
report’s preparation or publication, or any losses or damages which may arise from the use of this research report.<br />
Al Rajhi may rely on information barriers, such as “Chinese Walls” to control the flow of information within the areas, units, divisions, groups,<br />
or affiliates of Al Rajhi.<br />
Investing in any non-U.S. securities or related financial instruments (including ADRs) discussed in this research report may present certain<br />
risks. The securities of non-U.S. issuers may not be registered with, or be subject to the regulations of, the U.S. Securities and Exchange<br />
Commission. Information on such non-U.S. securities or related financial instruments may be limited. Foreign companies may not be<br />
subject to audit and reporting standards and regulatory requirements comparable to those in effect within the United States.<br />
The value of any investment or income from any securities or related financial instruments discussed in this research report denominated in<br />
a currency other than U.S. dollars is subject to exchange rate fluctuations that may have a positive or adverse effect on the value of or<br />
income from such securities or related financial instruments.<br />
Past performance is not necessarily a guide to future performance and no representation or warranty, express or implied, is made by Al<br />
Rajhi with respect to future performance. Income from investments may fluctuate. The price or value of the investments to which this<br />
research report relates, either directly or indirectly, may fall or rise against the interest of investors. Any recommendation or opinion<br />
contained in this research report may become outdated as a consequence of changes in the environment in which the issuer of the<br />
securities under analysis operates, in addition to changes in the estimates and forecasts, assumptions and valuation methodology used<br />
herein.<br />
No part of the content of this research report may be copied, forwarded or duplicated in any form or by any means without the prior consent<br />
of Al Rajhi and Al Rajhi accepts no liability whatsoever for the actions of third parties in this respect. This research document has been<br />
prepared by Al Rajhi Capital Company (“Al Rajhi Capital”) of Riyadh, Saudi Arabia. It has been prepared for the general use of Al Rajhi<br />
Capital’s clients and may not be redistributed, retransmitted or disclosed, in whole or in part, or in any form or manner, without the express<br />
written consent of Al Rajhi Capital. Receipt and review of this research document constitute your agreement not to redistribute, retransmit,<br />
or disclose to others the contents, opinions, conclusion, or information contained in this document prior to public disclosure of such<br />
information by Al Rajhi Capital. The information contained was obtained from various public sources believed to be reliable but we do not<br />
guarantee its accuracy. Al Rajhi Capital makes no representations or warranties (express or implied) regarding the data and information<br />
provided and Al Rajhi Capital does not represent that the information content of this document is complete, or free from any error, not<br />
misleading, or fit for any particular purpose. This research document provides general information only. Neither the information nor any<br />
opinion expressed constitutes an offer or an invitation to make an offer, to buy or sell any securities or other investment products related to<br />
such securities or investments. It is not intended to provide personal investment advice and it does not take into account the specific<br />
investment objectives, financial situation and the particular needs of any specific person who may receive this document.<br />
Investors should seek financial, legal or tax advice regarding the appropriateness of investing in any securities, other investment or<br />
investment strategies discussed or recommended in this document and should understand that statements regarding future prospects may<br />
not be realized. Investors should note that income from such securities or other investments, if any, may fluctuate and that the price or value<br />
of such securities and investments may rise or fall. Fluctuations in exchange rates could have adverse effects on the value of or price of, or<br />
income derived from, certain investments. Accordingly, investors may receive back less than originally invested. Al Rajhi Capital or its<br />
officers or one or more of its affiliates (including research analysts) may have a financial interest in securities of the issuer(s) or related<br />
investments, including long or short positions in securities, warrants, futures, options, derivatives, or other financial instruments. Al Rajhi<br />
Capital or its affiliates may from time to time perform investment banking or other services for, solicit investment banking or other business<br />
from, any company mentioned in this research document. Al Rajhi Capital, together with its affiliates and employees, shall not be liable for<br />
any direct, indirect or consequential loss or damages that may arise, directly or indirectly, from any use of the information contained in this<br />
research document.<br />
This research document and any recommendations contained are subject to change without prior notice. Al Rajhi Capital assumes no<br />
responsibility to update the information in this research document. Neither the whole nor any part of this research document may be altered,<br />
duplicated, transmitted or distributed in any form or by any means. This research document is not directed to, or intended for distribution to<br />
or use by, any person or entity who is a citizen or resident of or located in any locality, state, country or other jurisdiction where such<br />
distribution, publication, availability or use would be contrary to law or which would subject Al Rajhi Capital or any of its affiliates to any<br />
registration or licensing requirement within such jurisdiction.<br />
Disclosures Please refer to the important disclosures at the back of this report. 16
Saudi Banks Sector<br />
Banks –Finance<br />
6 April 2017<br />
Disclaimer and additional disclosures for Equity Research<br />
Disclaimer<br />
This research document has been prepared by Al Rajhi Capital Company (“Al Rajhi Capital”) of Riyadh, Saudi Arabia. It has been prepared<br />
for the general use of Al Rajhi Capital’s clients and may not be redistributed, retransmitted or disclosed, in whole or in part, or in any form or<br />
manner, without the express written consent of Al Rajhi Capital. Receipt and review of this research document constitute your agreement<br />
not to redistribute, retransmit, or disclose to others the contents, opinions, conclusion, or information contained in this document prior to<br />
public disclosure of such information by Al Rajhi Capital. The information contained was obtained from various public sources believed to be<br />
reliable but we do not guarantee its accuracy. Al Rajhi Capital makes no representations or warranties (express or implied) regarding the<br />
data and information provided and Al Rajhi Capital does not represent that the information content of this document is complete, or free<br />
from any error, not misleading, or fit for any particular purpose. This research document provides general information only. Neither the<br />
information nor any opinion expressed constitutes an offer or an invitation to make an offer, to buy or sell any securities or other investment<br />
products related to such securities or investments. It is not intended to provide personal investment advice and it does not take into account<br />
the specific investment objectives, financial situation and the particular needs of any specific person who may receive this document.<br />
Investors should seek financial, legal or tax advice regarding the appropriateness of investing in any securities, other investment or<br />
investment strategies discussed or recommended in this document and should understand that statements regarding future prospects may<br />
not be realized. Investors should note that income from such securities or other investments, if any, may fluctuate and that the price or value<br />
of such securities and investments may rise or fall. Fluctuations in exchange rates could have adverse effects on the value of or price of, or<br />
income derived from, certain investments. Accordingly, investors may receive back less than originally invested. Al Rajhi Capital or its<br />
officers or one or more of its affiliates (including research analysts) may have a financial interest in securities of the issuer(s) or related<br />
investments, including long or short positions in securities, warrants, futures, options, derivatives, or other financial instruments. Al Rajhi<br />
Capital or its affiliates may from time to time perform investment banking or other services for, solicit investment banking or other business<br />
from, any company mentioned in this research document. Al Rajhi Capital, together with its affiliates and employees, shall not be liable for<br />
any direct, indirect or consequential loss or damages that may arise, directly or indirectly, from any use of the information contained in this<br />
research document.<br />
This research document and any recommendations contained are subject to change without prior notice. Al Rajhi Capital assumes no<br />
responsibility to update the information in this research document. Neither the whole nor any part of this research document may be altered,<br />
duplicated, transmitted or distributed in any form or by any means. This research document is not directed to, or intended for distribution to<br />
or use by, any person or entity who is a citizen or resident of or located in any locality, state, country or other jurisdiction where such<br />
distribution, publication, availability or use would be contrary to law or which would subject Al Rajhi Capital or any of its affiliates to any<br />
registration or licensing requirement within such jurisdiction.<br />
Special disclaimers for this report: We do not support investing in non-Shariah stocks. This report should not be considered as an<br />
investment recommendation report. Out of the12 listed banks in the Saudi banking <strong>sector</strong>– only 4 are Islamic (Al Rajhi, Al Jazira, Al Inma<br />
and Al Bilad) while the remaining 8 are non-Islamic.<br />
Explanation of Al Rajhi Capital’s rating system<br />
Al Rajhi Capital uses a three-tier rating system based on absolute upside or downside potential for all stocks under its coverage except<br />
financial stocks and those few other companies not compliant with Islamic Shariah law:<br />
"Overweight": Our target price is more than 10% above the current share price, and we expect the share price to reach the target on a 12<br />
month time horizon.<br />
"Neutral": We expect the share price to settle at a level between 10% below the current share price and 10% above the current share price<br />
on a 12 month time horizon.<br />
"Underweight": Our target price is more than 10% below the current share price, and we expect the share price to reach the target on a 12<br />
month time horizon.<br />
"Target price": We estimate target value per share for every stock we cover. This is normally based on widely accepted methods<br />
appropriate to the stock or <strong>sector</strong> under consideration, e.g. DCF (discounted cash flow) or SoTP (sum of the parts) analysis.<br />
Please note that the achievement of any price target may be impeded by general market and economic trends and other external factors, or<br />
if a company’s profits or operating performance exceed or fall short of our expectations.<br />
Contact us<br />
Mazen Al-Sudairi,<br />
Head of Research<br />
Tel : +966 1 211 9449<br />
Email: alsudairim@alrajhi-capital.com<br />
Al Rajhi Capital<br />
Research Department<br />
Head Office, King Fahad Road<br />
P.O. Box 5561, Riyadh 11432<br />
Kingdom of Saudi Arabia<br />
Email: research@alrajhi-capital.com<br />
Al Rajhi Capital is licensed by the Saudi Arabian Capital Market Authority, License No. 37/07068.<br />
Disclosures Please refer to the important disclosures at the back of this report. 17