- Page 1 and 2:
CLIMATE CHANGE IN THE LA PLATA BASI
- Page 3 and 4:
INDEX FOREWORD . . . . . . . . . .
- Page 5 and 6:
7.3. Methodology . . . . . . . . .
- Page 7 and 8:
13.3. Regional validation of GCM fo
- Page 9 and 10:
1.1. Dropping the hypothesis of sta
- Page 11 and 12:
Introduction as they pour water ove
- Page 13 and 14:
A better understanding of the obser
- Page 15 and 16:
References Introduction Barros, V.
- Page 17 and 18: ABSTRACT The hydrologic cycle of th
- Page 19 and 20: La Plata basin climatology Within t
- Page 21 and 22: in this last description, although
- Page 23 and 24: warm season (October-April), in the
- Page 25 and 26: La Plata basin climatology b. Upper
- Page 27 and 28: La Plata basin climatology 2.3.3. R
- Page 29 and 30: La Plata basin climatology Fig. 2.8
- Page 31 and 32: 2.3.7. West and South borders La Pl
- Page 33 and 34: References La Plata basin climatolo
- Page 35 and 36: La Plata basin climatology Robertso
- Page 37 and 38: 3.1. Introduction Interannual low f
- Page 39 and 40: Interannual low frequency variabili
- Page 41 and 42: 1989). This signal varies along eac
- Page 43 and 44: Interannual low frequency variabili
- Page 45 and 46: The main physiographic and hydrolog
- Page 47 and 48: SUB-BASIN COUNTRY Argentina Bolivia
- Page 49 and 50: the most important stretches of the
- Page 51 and 52: Physiography and Hydrology The Para
- Page 53 and 54: Physiography and Hydrology The Pant
- Page 55 and 56: Physiography and Hydrology forcings
- Page 57 and 58: Physiography and Hydrology It is no
- Page 59 and 60: Physiography and Hydrology tion of
- Page 61 and 62: Physiography and Hydrology INTERNAV
- Page 63 and 64: 5.1. Introduction Precipitation and
- Page 65 and 66: From 1956 to 1991, in most of the A
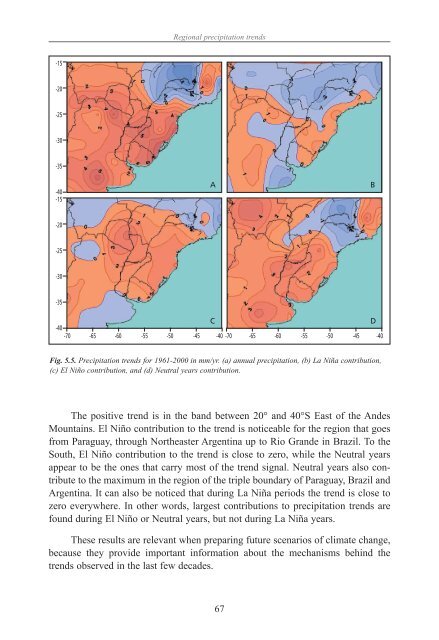
- Page 67: -15 -20 -25 -30 -35 -40 -15 -20 -25
- Page 71 and 72: Regional precipitation trends and L
- Page 73 and 74: trast, other regions suffer floodin
- Page 75 and 76: ABSTRACT The main hydrological tren
- Page 77 and 78: Following are the observed changes:
- Page 79 and 80: In the case of the Paraná River th
- Page 81 and 82: Hydrological trends In order to com
- Page 83 and 84: Hydrological trends In table 6.1 it
- Page 85 and 86: Hydrological trends On the other ha
- Page 87 and 88: the central area of the high basin
- Page 89 and 90: 7.1. Introduction Several authors,
- Page 91 and 92: Real evaporation trends a) PET > Pi
- Page 93 and 94: a) b) c) Mean Temperature Real evap
- Page 95 and 96: a) b) c) Mean Temperature Real evap
- Page 97 and 98: The positive trends of the mean tem
- Page 99 and 100: d) e) f) Mean Temperature Real evap
- Page 101 and 102: a) b) c) Mean Temperature Real evap
- Page 103 and 104: 7.5. Discussion and final comments
- Page 105 and 106: ABSTRACT The water, as resource, is
- Page 107 and 108: puts in risk large number of person
- Page 109 and 110: The main services and problems of w
- Page 111 and 112: There are similar problems in diffe
- Page 113 and 114: 8.3.3. Energy a. Hydroelectric depe
- Page 115 and 116: (chapters 12 and 13), because of th
- Page 117 and 118: The main services and problems of w
- Page 119 and 120:
9.1. Introduction The emissions of
- Page 121 and 122:
9.4. Greenhouse effect The atmosphe
- Page 123 and 124:
Temperature anomalies (°C) 0.8 0.6
- Page 125 and 126:
Global climatic change at a global
- Page 127 and 128:
In view of the unavoidability of th
- Page 129 and 130:
Background on other regional aspect
- Page 131 and 132:
Background on other regional aspect
- Page 133 and 134:
Background on other regional aspect
- Page 135 and 136:
Considering the non-linear interact
- Page 137 and 138:
SST anomalies also have influence o
- Page 139 and 140:
Background on other regional aspect
- Page 141 and 142:
ABSTRACT The purpose of this chapte
- Page 143 and 144:
Global climate models Mid-1970’s
- Page 145 and 146:
Global climate models Table 11.1. B
- Page 147 and 148:
Global climate models Table 11.2. M
- Page 149 and 150:
Although changes in weather and cli
- Page 151 and 152:
Socio-economic variables and also s
- Page 153 and 154:
Applicability in impact assessments
- Page 155 and 156:
of the global climate system to the
- Page 157 and 158:
Climate scenarios B2: Assumes a wor
- Page 159 and 160:
Climate scenarios The reliability o
- Page 161 and 162:
Climate scenarios From Table 12.2 i
- Page 163 and 164:
Climate scenarios Fig. 12.5. The mu
- Page 165 and 166:
Climate scenarios this would be rel
- Page 167 and 168:
Results of global circulation model
- Page 169 and 170:
13.2.3. Statistical downscaling The
- Page 171 and 172:
La Plata basin are also considerabl
- Page 173 and 174:
10 N EQ 10 S 20 S 30 S 40 S 50 S 10
- Page 175 and 176:
Regional climatic scenarios Fig. 13
- Page 177 and 178:
a. Pre-industrial experiment: Initi
- Page 179 and 180:
Regional climatic scenarios Fig. 13
- Page 181 and 182:
Regional climatic scenarios Fig. 13
- Page 183 and 184:
Regional climatic scenarios Kalnay,
- Page 185 and 186:
Low-frequency variability 14.1. Bac
- Page 187 and 188:
egime occurred during the periods o
- Page 189 and 190:
Fig. 14.2. As Fig. 14.1, except for
- Page 191 and 192:
14.4. SST composites Low-frequency
- Page 193 and 194:
Low-frequency variability during th
- Page 195 and 196:
Fig. 14.10. As Fig. 14.9, except fo
- Page 197 and 198:
Low-frequency variability In genera
- Page 199 and 200:
Low-frequency variability Mantua, N
- Page 201 and 202:
15.1. Introduction Statistical anal
- Page 203 and 204:
Statistical analysis of extreme eve
- Page 205 and 206:
Statistical analysis of extreme eve
- Page 207 and 208:
Statistical analysis of extreme eve
- Page 209 and 210:
Statistical analysis of extreme eve
- Page 211 and 212:
Statistical analysis of extreme eve
- Page 213 and 214:
Statistical analysis of extreme eve
- Page 215 and 216:
Statistical analysis of extreme eve
- Page 217 and 218:
CURRÍCULA OF THE AUTHORS Vicente B
- Page 219 and 220:
Curricula of the autors Rubén Mari
- Page 221:
Proyect: SGP II 057: “Trends in t