Analysis of Fat-Soluble Vitamins and Antioxidants in ... - Dionex
Analysis of Fat-Soluble Vitamins and Antioxidants in ... - Dionex
Analysis of Fat-Soluble Vitamins and Antioxidants in ... - Dionex

You also want an ePaper? Increase the reach of your titles
YUMPU automatically turns print PDFs into web optimized ePapers that Google loves.
ExpErImEntAl<br />
Charged Aerosol Detection Parameters<br />
Gas: 35.0 psi (nitrogen generator)<br />
Filter: High<br />
Nebulizer Heater: 30 °C<br />
HPLC Parameters<br />
Mobile Phase A: Methanol/water/acetic acid (750:250:4)<br />
Mobile Phase B: Acetonitrile/methanol/tetrahydr<strong>of</strong>uran/acetic<br />
acid (500:375:125:4)<br />
Gradient: Time %A %B<br />
0.00 70.0 30.0<br />
1.00 50.0 50.0<br />
5.00 40.0 60.0<br />
10.00 35.0 65.0<br />
12.00 10.0 90.0<br />
17.00 0.0 100.0<br />
17.10 70.0 30.0<br />
20.00 70.0 30.0<br />
Flow Rate: 1.5 mL/m<strong>in</strong><br />
Run Time: 20 m<strong>in</strong><br />
HPLC Column: Halo ® C8, 150 × 4.6 mm, 2.7 µm<br />
Column Temp.: 40 °C<br />
Sample Temp.: 10 °C<br />
Injection Volume: 10 µL<br />
Sample Preparation<br />
St<strong>and</strong>ards were dissolved <strong>in</strong> ethanol/butylated hydroxyanisole (10 mg/L;<br />
BHA) to the appropriate concentrations. The solid products (CoQ10 <strong>and</strong><br />
Solgar VM-75 ® ) were crushed <strong>and</strong> extracted <strong>in</strong> methanol/chlor<strong>of</strong>orm<br />
(3:5) <strong>in</strong> a sonicator. The supernatant was centrifuged to remove<br />
particulates <strong>and</strong> then diluted appropriately <strong>in</strong> the EtOH/BHA solution.<br />
The natural vitam<strong>in</strong> E product conta<strong>in</strong><strong>in</strong>g 400 IU (268 mg) <strong>of</strong><br />
naturally based a-tocopherol (gelcap form) was dissolved <strong>in</strong> warm<br />
water, extracted <strong>in</strong> diethyl ether, <strong>and</strong> diluted with EtOH/BHA solution.<br />
cAlIbrAtIon plots<br />
2 Optimization <strong>Analysis</strong> <strong>of</strong> <strong>Fat</strong>-<strong>Soluble</strong> <strong>of</strong> the Separation <strong>Vitam<strong>in</strong>s</strong> Power <strong>and</strong> <strong>Antioxidants</strong> <strong>of</strong> 1-D Nano LC <strong>in</strong> Supplements <strong>Analysis</strong> <strong>of</strong> Proteomics by RP-HPLC Samples<br />
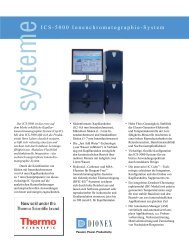
Calibration plots are presented here, rang<strong>in</strong>g from 5–333 ng on column<br />
(Figure 1) <strong>and</strong> from 4.8–323 ng on column (Figure 2). All RSDs were<br />
< 5% for all concentrations > 20 ng on column (with an exception <strong>of</strong><br />
lycopene which exhibited front<strong>in</strong>g, thereby reduc<strong>in</strong>g its response relative<br />
to other FSVs).<br />
As seen <strong>in</strong> Table 1, LOD values (2–4 ng on column) were lower than<br />
those for tocopherols by HPLC-UV (10–20 ng on column). 1<br />
The range <strong>of</strong> relative response factors for tocopherols varied from 1.00<br />
to 1.43 at 333 ng on column. This is 60% lower than for variance found<br />
us<strong>in</strong>g fluorescence detection, 2 <strong>in</strong>dicat<strong>in</strong>g that the charged aerosol<br />
detector responses are more uniform across this range <strong>of</strong> compounds.<br />
Table 1. LOD <strong>and</strong> LOQ Values<br />
FSV or Carotenoid LOD (ng) LOQ (ng)<br />
trans-Ret<strong>in</strong>ol 2 7<br />
Ret<strong>in</strong>yl acetate 7 23<br />
Lute<strong>in</strong> 4 15<br />
d-Tocopherol 2 6<br />
a-Tocopherol succ<strong>in</strong>ate 2 6<br />
g-Tocopherol 2 5<br />
Phylloqu<strong>in</strong>one 3 8<br />
a-Tocopherol 4 12<br />
Lycopene 12 40<br />
Ret<strong>in</strong>yl palmitate 3 9<br />
CoQ10 4 13<br />
Peak Area<br />
300<br />
0<br />
trans-Ret<strong>in</strong>ol δ-Toc. γ-Toc. α-Toc.<br />
Lycopene Ret<strong>in</strong>yl palmitate α-Toc. succ.<br />
0 50<br />
100 150 200 250 300 350<br />
Amount on Column (ng)<br />
Figure 1. Calibration curves for seven FSVs by RP-HPLC (5 to 333 ng on column).<br />
26945