Create successful ePaper yourself
Turn your PDF publications into a flip-book with our unique Google optimized e-Paper software.
<strong>INOX</strong> <strong>LEISURE</strong> <strong>LIMITED</strong><br />
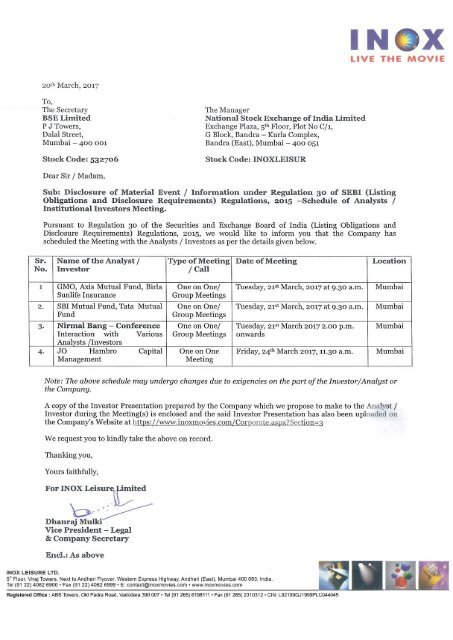
INVESTOR PRESENTATION<br />
MARCH 2017<br />
1
DISCLAIMER<br />
This presentation and the following discussion may contain “forward looking statements” by Inox Leisure Limited (“ILL” or “the<br />
Company”) that are not historical in nature. These forward looking statements, which may include statements relating to<br />
future state of affairs, results of operations, financial condition, business prospects, plans and objectives, are based on the<br />
current beliefs, assumptions, expectations, estimates, and projections of the management of ILL about the business, industry<br />
and markets in which ILL operates.<br />
These statements are not guarantees of future performance, and are subject to known and unknown risks, uncertainties, and<br />
other factors, some of which are beyond ILL’s control and difficult to predict, that could cause actual results, performance or<br />
achievements to differ materially from those in the forward looking statements.<br />
Such statements are not, and should not be construed, as a representation as to future performance or achievements of ILL. In<br />
particular, such statements should not be regarded as a projection of future performance of ILL. It should be noted that the<br />
actual performance or achievements of ILL may vary significantly from such statements.<br />
2
DISCUSSION SUMMARY<br />
<br />
INDUSTRY OVERVIEW<br />
<br />
COMPANY OVERVIEW<br />
<br />
COMPETITIVE ADVANTAGE AND OUTLOOK<br />
<br />
Q3 & 9M FY17 RESULTS UPDATE<br />
<br />
PER SCREEN ECONOMICS<br />
<br />
SHAREHOLDING STRUCTURE<br />
<br />
ANNEXURE<br />
- DETAILED FINANCIALS<br />
3
INDUSTRY OVERVIEW<br />
4
INDIAN FILM EXHIBITION INDUSTRY<br />
STRONG FUNDAMENTALS, LARGELY UNDER-SCREENED, HUGE GROWTH POTENTIAL<br />
2 nd HIGHEST NUMBER OF THEATRE FOOTFALLS IN THE WORLD<br />
2,178<br />
Footfalls in Million<br />
1,930<br />
1,602<br />
HIGHEST NUMBER OF FILM RELEASES IN THE WORLD<br />
1,364<br />
208 197 176 171 169 156 146<br />
745<br />
554<br />
476<br />
279 324<br />
241 204 182 166<br />
China India US France Mexico UK Japan S. Korea Germany Russia<br />
India China Japan US France UK Germany S. Korea Spain Italy<br />
HOWEVER, INDIA’S SCREEN DENSITY IS ONE OF THE LOWEST<br />
125<br />
Screens / Million population<br />
95<br />
80<br />
60 57<br />
40<br />
26 25<br />
16 12 10 8<br />
US France Spain UK Germany South Korea Japan Taiwan China Thailand Brazil India<br />
Source: CRISIL Report, FICCI Whitepaper on Screen Density in India<br />
5
INDIAN FILM EXHIBITION INDUSTRY<br />
STEADY PERFORMANCE AND RESILIENCE<br />
INDIAN FILM INDUSTRY DISPLAYS STEADY PERFORMANCE TRENDS<br />
250<br />
200<br />
150<br />
100<br />
50<br />
0<br />
In Rs Billion<br />
92.9<br />
68.8<br />
112.4<br />
CAGR 10.4%<br />
125.3 126.4<br />
138.2<br />
85.1 93.4 93.5 101.4 115.8 125.7 136.1 147.6 159.9<br />
2011 2012 2013 2014 2015 2016E 2017E 2018E 2019E 2020E<br />
Domestic Theatrical Overseas Theatrical Home Video Cable & Satellite Rights Ancilliary Revenue Streams<br />
158.7<br />
174.1<br />
CAGR 10.5%<br />
190.0<br />
207.8<br />
227.3<br />
DOMESTIC THEATRICALS CONTINUE TO REMAIN THE MAJOR REVENUE CONTRIBUTOR<br />
74.1% 75.7% 74.5% 74.0% 73.4% 73.0% 72.2% 71.6% 71.0% 70.3%<br />
2011 2012 2013 2014 2015 2016E 2017E 2018E 2019E 2020E<br />
Source: FICCI-KPMG 2016 Report<br />
% Share of Domestic Theatricals in Total Film Industry Revenues<br />
6
INDIAN FILM EXHIBITION INDUSTRY<br />
MULTIPLEXES WITNESSING RAPID GROWTH<br />
9,308 9,121<br />
NUMBER OF SCREENS<br />
8,685 8,451<br />
8,002<br />
6,000 6,000<br />
FACTORS DRIVING GROWTH IN MULTIPLEXES:<br />
• Superior location, destination and parking<br />
facilities.<br />
1,075 1,225 1,350<br />
1,500 1,630<br />
2,134 2,225<br />
• State of art equipment (high quality video<br />
and audio), superior interiors, ambience<br />
and service.<br />
2010 2011 2012 2013 2014 2015 Oct-16<br />
Single Screens<br />
Multiplexes<br />
Multiplexes currently account for<br />
~ 27% market share of the screens,<br />
however account for<br />
more than 40% of box office collections<br />
• Multiple screens in one location offer a<br />
wider variety of content to the patrons.<br />
Further, different screen sizes provide<br />
programming flexibility. This results in<br />
higher occupancy ratios.<br />
• Strong demographics, rising disposable<br />
incomes and discretionary spends.<br />
Source: CRISIL Report, FICCI-KMPG Report 2016, Industry Sources<br />
7
INDIAN FILM EXHIBITION INDUSTRY<br />
MULTIPLEX INDUSTRY IS IN CONSOLIDATION PHASE<br />
The Indian multiplex industry has undergone significant consolidation over last decade.<br />
Industry leaders have grown not only through organic screen additions, but also through acquisition of smaller regional<br />
multiplex chains and single screen players.<br />
As a result of this consolidation, the top four players account for ~ 70% of multiplex screens.<br />
569<br />
460 *<br />
NUMBER OF SCREENS<br />
239<br />
325<br />
244<br />
142<br />
* As on 10 th March 2017<br />
3 4<br />
PVR <strong>INOX</strong> Carnival Cinepolis<br />
FY11 Dec-16<br />
8
INDIAN FILM EXHIBITION INDUSTRY<br />
INCREASING NUMBER OF INR 1 BN + MOVIES<br />
WIDER SCREEN RELEASES<br />
5,200<br />
4,500<br />
5,300<br />
1,000<br />
3 Idiots<br />
(2009)<br />
1<br />
Source: Industry<br />
1,598<br />
Dabaang<br />
(2010)<br />
1<br />
2,065 2,101<br />
Bodyguard<br />
(2011)<br />
2<br />
Ek Tha<br />
Tiger<br />
(2012)<br />
2,638<br />
Dabaang 2<br />
(2012)<br />
5<br />
3,014<br />
Chennai<br />
Express<br />
(2013)<br />
9<br />
3,446 3,359<br />
Dhoom 3<br />
(2013)<br />
2<br />
Kick<br />
(2014)<br />
HIGHER NUMBER OF INR 1 BN + MOVIES<br />
2<br />
6 7<br />
P.K<br />
(2014)<br />
Bajrangi<br />
Bhaijaan<br />
(2015)<br />
2<br />
5 6<br />
2008 2009 2010 2011 2012 2013 2014 2015 2016<br />
INR 1 BN + INR 2 BN +<br />
Dangal<br />
(2016)<br />
2<br />
INCREASING NUMBER OF<br />
MOVIES ARE GENERATING<br />
MORE THAN RS 1 BN IN<br />
NET BOX OFFICE COLLECTIONS<br />
DRIVEN BY<br />
WIDER SCREEN RELEASES<br />
AND<br />
IMPROVING CONTENT QUALITY<br />
9
COMPANY OVERVIEW<br />
10
COMPANY OVERVIEW<br />
TRACK RECORD OF AGGRESSIVE EXPANSION<br />
96<br />
107<br />
420<br />
116<br />
460<br />
63<br />
239<br />
68<br />
257<br />
72<br />
279<br />
79<br />
310<br />
372<br />
2 3<br />
8 12<br />
6<br />
25<br />
9<br />
35<br />
14<br />
51<br />
22<br />
76<br />
26<br />
91<br />
32<br />
119<br />
FY03 FY04 FY05 FY06 FY07 FY08 FY09 FY10 FY11 FY12 FY13 FY14 FY15 FY16 10th Mar<br />
Screens<br />
Properties<br />
2017<br />
ON AN AVERAGE ADDITION OF 3 SCREENS EVERY MONTH OVER THE LAST DECADE<br />
Note: Includes Acquisition of 1. 89 Cinemas in FY08, 2. Fame India in FY11, 3. Satyam Cineplexes in FY15<br />
11
COMPANY OVERVIEW<br />
PAN INDIA PRESENCE<br />
ONE OF THE LARGEST MULTIPLEX CHAIN OPERATOR IN INDIA<br />
PUNJAB | 1 Property | 6 Screens<br />
DELHI | 4 Properties | 13 Screens<br />
HARYANA | 5 Properties | 16 Screens<br />
RAJASTHAN | 13 Properties | 43 Screens<br />
MADHYA PRADESH | 4 Properties | 16 Screens<br />
GUJARAT | 14 Properties | 59 Screens<br />
MAHARASHTRA | 24 Properties | 105 Screens<br />
GOA | 4 Property | 14 Screens<br />
KARNATAKA |11 Properties | 41 Screens<br />
KERALA |1 Property | 6 Screens<br />
UTTAR PRADESH | 4 Properties | 16 Screens<br />
JHARKHAND | 1 Property | 4 Screens<br />
Assam | 1 Properties | 2 Screens<br />
WEST BENGAL | 14 Properties | 55 Screens<br />
ODISHA | 1 Property | 3 Screens<br />
CHHATTISGARH | 2 Properties | 8 Screens<br />
TELANGANA | 2 Properties | 11 Screens<br />
ANDHRA PRADESH | 7 Properties | 28 Screens<br />
TAMIL NADU | 3 Properties | 14 Screens<br />
19<br />
States<br />
58<br />
Cities<br />
116<br />
Properties<br />
460<br />
Screens<br />
116,732<br />
Seats<br />
Includes 7 management properties with 23 screens and 5,763 seats<br />
12
COMPANY OVERVIEW<br />
OUR MARQUEE PROPERTIES<br />
Kolkatta<br />
Quest<br />
Bengaluru<br />
Magrath<br />
Road<br />
Hyderabad<br />
GVK<br />
Mumbai<br />
Malad<br />
13
COMPANY OVERVIEW<br />
OUR MARQUEE PROPERTIES<br />
<strong>INOX</strong> INSIGNIA at <strong>INOX</strong> Laserplex, Nariman Point<br />
‘INDIA’S FIRST 7-STAR LUXURY MOVIE VIEWING EXPERIENCE’<br />
SUPERIOR TECHNOLOGY:<br />
• Laser Projection: India’s first laser projection system - 300%<br />
enhanced picture quality<br />
• Dolby Atmos Sound: Explosive cinema surround sound experience<br />
• Volfoni 3D screen: Smart Crystal Diamond solution with the<br />
brightest 3D screens<br />
LUXURY MOVIE VIEWING EXPERIENCE:<br />
• Plush Ergonomic Recliners: Micro-adjustable premium Italian<br />
leather sofas with a USB charging port<br />
• Exclusive menu by Master Chef Vicky Ratnani<br />
• Stylish staff uniforms crafted by celebrity designer Arjun Khanna<br />
• Butler on call providing personalised service<br />
14
COMPANY OVERVIEW<br />
OUR MARQUEE PROPERTIES<br />
<strong>INOX</strong> INSIGNIA at R City Mall, Ghatkopar<br />
‘<strong>INOX</strong> LAUNCHES ITS FIRST IMAX SCREEN’<br />
15
COMPANY OVERVIEW<br />
LAST 5 YEARS – FINANCIAL SUMMARY<br />
CAGR: 20%<br />
644.9<br />
765.3<br />
REVENUES EBITDA & EBITDA MARGIN PAT & PAT MARGIN<br />
868.8<br />
1,016.8<br />
1,332.7<br />
11.3% 12.8% 14.0% 12.1% 14.2%<br />
0.7%<br />
189.9<br />
CAGR: 27% CAGR: 107%<br />
122.0 122.8<br />
98.0<br />
72.9<br />
18.5<br />
4.2<br />
Financial Summary is as per IGAAP<br />
2.4%<br />
4.3%<br />
36.9<br />
2.0%<br />
20.0<br />
5.8%<br />
77.5<br />
FY12 FY13 FY14 FY15 FY16<br />
FY12 FY13 FY14 FY15 FY16<br />
EBITDA EBITDA Margin %<br />
FY12 FY13 FY14 FY15 FY16<br />
PAT PAT Margin %<br />
REVENUES - SEGMENT BREAKUP LEVERAGE ANALYSIS RETURN METRICS<br />
5% 4% 7% 7% 5%<br />
5% 4% 6% 8% 7%<br />
18% 19% 19% 19% 20%<br />
0.8 0.9<br />
0.6<br />
0.4 0.5<br />
9.4%<br />
11.5%<br />
10.3%<br />
12.4%<br />
12.2%<br />
73% 73% 69% 66% 68%<br />
320.3 324.6 390.9<br />
676.2 590.8<br />
244.0 281.0 242.2 241.2 267.0<br />
6.0%<br />
1.3%<br />
5.7%<br />
6.1%<br />
3.8%<br />
FY12 FY13 FY14 FY15 FY16<br />
FY12 FY13 FY14 FY15 FY16<br />
GBOC F & B Adv Others<br />
Debt Equity Debt to Equity<br />
ROE: PAT/Avg. Equity, ROCE: EBIT/Avg. Capital Employed [(Capital Employed = Equity + Total Debt)<br />
FY12 FY13 FY14 FY15 FY16<br />
ROCE % ROE %<br />
In Rs Crore<br />
16
COMPANY OVERVIEW<br />
LAST 5 YEARS – OPERATIONAL SUMMARY<br />
FOOTFALLS & OCCUPANCY RATE<br />
25% 28% 28% 25% 29%<br />
534.4<br />
306.8<br />
353.3 386.0 410.7<br />
F & B - SPEND PER HEAD (SPH) (Rs)<br />
44 47 49<br />
55 58<br />
ADV REV PER OPERATING SCREEN (Rs Lakhs)<br />
25.1 24.6<br />
18.5<br />
12.9 13.7<br />
FY12 FY13 FY14 FY15 FY16<br />
Footfalls (Lakhs) Occupancy (%)<br />
FY12 FY13 FY14 FY15 FY16<br />
FY12 FY13 FY14 FY15 FY16<br />
AVERAGE TICKET PRICE (ATP) (Rs)<br />
F & B – NET CONTRIBUTION (%)<br />
OTHER REV PER OPERATING SCREEN (Rs Lakhs)<br />
156<br />
160<br />
156<br />
164<br />
170<br />
69.4% 70.0% 71.3%<br />
74.1% 75.0%<br />
13.2 13.7<br />
22.5 21.9<br />
19.2<br />
FY12 FY13 FY14 FY15 FY16<br />
FY12 FY13 FY14 FY15 FY16<br />
FY12 FY13 FY14 FY15 FY16<br />
Note: All the above charts exclude managed properties.<br />
17
COMPANY OVERVIEW<br />
LAST 5 YEARS – OPERATIONAL SUMMARY<br />
ENTERTAINMENT TAX (%) FILM DISTRIBUTOR SHARE (%)<br />
Operational Summary is as per IGAAP<br />
21.4% 22.3% 21.6% 22.0%<br />
23.8%<br />
17.6% 18.3% 17.8% 18.0% 19.2%<br />
43.7% 44.3% 44.3% 43.8% 43.1%<br />
36.0% 36.2% 36.4% 35.9% 34.8%<br />
FY12 FY13 FY14 FY15 FY16<br />
Entertainment Tax - % on NBOC<br />
Entertainment Tax - % on GBOC<br />
FY12 FY13 FY14 FY15 FY16<br />
Distributor Share on NBOC<br />
Distributor Share on GBOC<br />
OTHER OVERHEADS PER OPERATING SCREEN (Rs Lakhs)<br />
NBOC (Net Box Office Collections)<br />
GBOC (Gross Box Office Collections)<br />
120.6<br />
36.0<br />
156.2<br />
138.3 145.8<br />
132.5<br />
39.8 40.4 43.4<br />
47.6<br />
31.5 35.4 39.2 40.8 45.5<br />
35.7 39.3 40.2 41.3 42.9<br />
17.4 18.1 18.5 20.3 20.2<br />
FY12 FY13 FY14 FY15 FY16<br />
Employee Benefits<br />
Property Rent & Conducting Fees<br />
CAM, Power & Fuel, R&M<br />
Other Overheads<br />
18
COMPETITIVE<br />
ADVANTAGE<br />
AND<br />
OUTLOOK<br />
19
COMPETITIVE ADVANTAGES<br />
Strong Promoter Group<br />
Under-leveraged Balance Sheet With Further Scope For Dilution<br />
Well Diversified Presence Across India<br />
Strong New Screens Pipeline<br />
State Of The Art Technology, Unmatched Service And Ambience<br />
Strong Brand Partnerships<br />
20
COMPETITIVE ADVANTAGE<br />
STRONG PEDIGREE<br />
• 90 year track record of ethical business growth.<br />
• USD $3Bn Inox Group is diversified across industrial gases, engineering plastics, refrigerants, chemicals, cryogenic engineering, renewable energy and entertainment.<br />
• More than 9,000 employees at more than 150 business units across India.<br />
• Distribution network spread across more than 50 countries around the world.<br />
Listed Companies<br />
Other Key Companies<br />
Gujarat Fluorochemicals<br />
Limited<br />
Inox Wind Limited<br />
Inox Leisure<br />
Limited<br />
Inox FMCG<br />
Private Limited<br />
Inox Air Products<br />
Private Limited<br />
Inox India Private<br />
Limited<br />
Inox Renewables<br />
Limited<br />
• Largest producer of<br />
chloromethanes, refrigerants<br />
and Polytetrafluoroethylene<br />
in India<br />
• Pioneer of carbon credits in<br />
India<br />
• Fully integrated player in<br />
the wind energy market<br />
• State-of-the-art<br />
manufacturing plants near<br />
Ahmedabad (Gujarat) and<br />
at Una (Himachal Pradesh)<br />
and new facility in Madhya<br />
Pradesh. Madhya Pradesh<br />
facility one of the largest in<br />
Asia<br />
• Ability to provide end-toend<br />
turnkey solutions for<br />
wind farms<br />
• One of the largest<br />
multiplex chain in India<br />
• In the business of setting<br />
up, operating and<br />
managing a national chain<br />
of multiplexes under the<br />
brand name ‘<strong>INOX</strong>’<br />
• Present in 58 cities with<br />
116 multiplexes and 460<br />
screens<br />
• Launched in January 2016,<br />
it is focussed on FMCG<br />
business encompassing<br />
F&B and non-F&B<br />
categories.<br />
• <strong>INOX</strong> FMCG products<br />
branded as “Inox Muchos”<br />
are retailed through<br />
Modern Trade, General<br />
Trade and HORECCA<br />
Institutions.<br />
• 50:50 joint venture with<br />
Air Products Inc., USA<br />
• Largest producer of<br />
industrial gases in India<br />
• 40 plants spread<br />
throughout the country<br />
• Largest producer of<br />
cryogenic liquid storage<br />
and transport tanks in<br />
India<br />
• Offers comprehensive<br />
solutions in cryogenic<br />
storage, vaporization and<br />
distribution engineering<br />
• Has operations in India,<br />
USA, Canada,<br />
Netherlands and Brazil<br />
• Engaged in the business<br />
of setting up and<br />
operating of wind farms<br />
• Existing operating<br />
capacity of ~ 260 MW in<br />
states of Rajasthan,<br />
Maharashtra, Tamil Nadu<br />
and Madhya Pradesh<br />
STRONG SPONSORSHIP OF <strong>INOX</strong> GROUP - RECOGNIZED AND TRUSTED CORPORATE GROUP<br />
21
COMPETITIVE ADVANTAGE<br />
UNDER-LEVERAGED BALANCE SHEET WITH FURTHER SCOPE FOR DILUTION<br />
Particulars (Rs Cr)<br />
SEPTEMBER-16<br />
Share Capital 96.2<br />
Reserves & Surplus 486.4<br />
Interest in Inox Benefit Trust, at cost -32.7<br />
Total Shareholder funds 549.9<br />
Non-Controlling Interest -0.0<br />
Total Equity 549.9<br />
Total Debt 229.4<br />
Other Non-Current Liabilities 108.5<br />
Total Sources of Funds 887.9<br />
Strong Balance Sheet<br />
Treasury Stock in<br />
Inox Benefit Trust<br />
Low Leverage<br />
Net D/E: 0.4x<br />
Rs 109 cr at<br />
Current Market<br />
Price #<br />
Fixed Assets 714.2<br />
Other Non-Current Assets 266.4<br />
Current Assets 104.6<br />
Less: Current Liabilities 197.4<br />
Net Current Assets -92.8<br />
Total Assets 887.9<br />
Promoters Stake 48.7%<br />
Key Balance sheet Ratios<br />
SEPTEMBER-16<br />
Net Debt : Equity 0.4<br />
Return on Equity (ROE) 11.9% *<br />
Return on Capital Employed (ROCE) 10.3% *<br />
Potential To Grow Aggressively Without Any<br />
Significant Stress On Balance Sheet<br />
* Calculated on Trailing 12 Months Basis,<br />
ROE: PAT/Avg. Equity, ROCE: EBIT/Avg. Capital Employed [(Capital Employed = Equity + Total Debt)<br />
# As on 17 th March 2017<br />
22
COMPETITIVE ADVANTAGE<br />
WELL-DIVERSIFIED PRESENCE ACROSS INDIA<br />
Well Diversified<br />
Distribution of<br />
Multiplexes<br />
across India<br />
Access to<br />
Wide Variety of<br />
Regional Content<br />
58 Cities 116 Properties<br />
East, 9<br />
North, 27<br />
North, 17<br />
South, 24<br />
West, 20<br />
South, 12<br />
East, 19<br />
West, 46<br />
Lower Dependency<br />
on Hindi and English<br />
Content<br />
460 Screens 116,732 Seats<br />
East, 72<br />
North, 94<br />
South, 100<br />
West, 194<br />
North,<br />
23,950<br />
South,<br />
23,837<br />
East, 18,805<br />
West,<br />
50,140<br />
Includes 7 management properties with 23 screens and 5,763 seats<br />
23
COMPETITIVE ADVANTAGE<br />
NEW SCREENS PIPELINE<br />
Properties Screens<br />
Seats<br />
FY17 – PIPELINE<br />
Properties Screens Seats<br />
Bharuch 3 800<br />
Gandhinagar 5 728<br />
Total – 2 New Properties 8 1,528<br />
FY16 107 420 1,08,931<br />
Additions - 1 st Apr-16 to<br />
10 th Mar-17<br />
Remaining Additions in<br />
Mar-17<br />
9 40 8,692<br />
2 8 1,528<br />
FY17 118 468 118,260*<br />
Additions post FY17 80 432 80,627<br />
LEADING TO 200 900 198,887*<br />
* 1) 142 seats reduced due to increase in seat tier width at Bharuch Shree Rang and<br />
addition of recliners in Goa Osia<br />
2) 383 seats reduced at Nariman Point due to renovation<br />
3) 366 seats will be reduced at R City Ghatkopar due to renovation<br />
STRONG VISIBILITY FROM NEW SCREENS PIPELINE BACKED BY SIGNED AGREEMENTS<br />
24
COMPETITIVE ADVANTAGE<br />
STATE OF THE ART TECHNOLOGY, UNMATCHED SERVICE AND AMBIENCE<br />
FOCUS ON STRONG TECHNOLOGY, UNMATCHED SERVICE AND AMBIENCE<br />
Focus on technology:<br />
• ILL is the first multiplex chain to implement SAP HANA with all integrated functions<br />
• Focus on ensuring transparency with regulatory agencies and distributors through daily performance analysis reports<br />
• The Network Operations Centre (NOC) in Mumbai enables continuous monitoring, control and reporting of information on all digital systems<br />
across the country. Advertisers can track their advertisement screening at various multiplexes on real-time basis leading to improved transparency<br />
and higher advertising revenues for ILL<br />
• ILL have signed the single largest deal with IMAX in India to provide truly encaptivating and completely immersive viewing experience<br />
Focus on high quality video and audio:<br />
• ILL owns the high quality DCI Compliant 2K & 4K Digital Projection Systems across all the screens in India<br />
• High-definition picture quality, strong 3D capabilities and high frame rate (HFR) (can go up to 60 fps)<br />
• ILL has been one of the early adopters of Dolby ATMOS sound technology. Excellent acoustic systems and distortion free sound<br />
Focus on service and ambience:<br />
• Focus on providing world class ambience.<br />
• ILL with its in-app F&B ordering and Qbuster service, is able to considerably reduce its queue size and transaction time<br />
• Emphasis on safety, comfort and convenience<br />
25
COMPETITIVE ADVANTAGE<br />
STRONG BRAND PARTNERSHIPS<br />
BFSI FMCG CONSUMER<br />
DURABLES<br />
AUTOMOBILES<br />
GEC<br />
ECOMMERCE<br />
&TELECOMM.<br />
OTHERS<br />
26
OUTLOOK<br />
CONTENT PIPELINE<br />
Passengers<br />
Release Date: 6 th January 2017<br />
Cast: Jennifer Lawrence, Chris Pratt,<br />
Michael Sheen<br />
Director: Morten Tyldum<br />
Banner: Columbia Pictures, LStar<br />
Capital, Village Roadshow Pictures,<br />
Start Motion Pictures<br />
Allied<br />
Release Date: 6 th January 2017<br />
Cast: Brad Pitt, Lizzy Kalpan, Marion<br />
Cotillard<br />
Director: Robert Zemekcis<br />
Banner: GK Films, ImageMovers<br />
Ok Janu<br />
Release Date: 13 th January 2017<br />
Cast: Aditya Roy Kapoor, Shraddha<br />
Kapoor<br />
Director: Shaad Ali<br />
Banner: Dharma Productions<br />
Madras Talkies<br />
XXX: The Return of Xander Cage<br />
Release Date: 13 th January 2017<br />
Cast: Vin Diesel, Deepika Padukone,<br />
Samuel J Jackson, Nina Dobrev, Tony<br />
Colete<br />
Director: DJ Caruso<br />
Banner: Maple Cage Productions,<br />
One Race Films, Revolution Studios,<br />
Rox Productions<br />
Raees<br />
Release Date: 25 th January 2017<br />
Cast: Shahrukh Khan, Farhan Akhtar,<br />
Nawazuddin Siddhiqui<br />
Director: Rahul Dholakia<br />
Banner: Red Chillies Entertainment,<br />
Excel Entertainment<br />
Kaabil<br />
Release Date: 25 th January 2017<br />
Cast: Hrithik Roshan, Yami Gautam<br />
Director: Sanjay Gupta<br />
Banner: Filmkraft Productions Pvt.<br />
Ltd<br />
27
OUTLOOK<br />
CONTENT PIPELINE<br />
The Great Wall (3D)<br />
Release Date: 3 rd February 2017<br />
Cast: Matt Damon, Williem Dafoe<br />
Director: Yimou Zhang<br />
Banner: Legendary East, Le Vision<br />
Pictures, Atlas Entertainment, China<br />
Film Group<br />
Resident Evil: The Final Chapter (3D)<br />
Release Date: 3 rd February 2017<br />
Cast: Milla Jovovich, Ali Larter,<br />
Shawn Roberts<br />
Director: Paul Anderson<br />
Banner: Capcom Entertainment,<br />
Constantin Film Production, Don<br />
Carmody Productions<br />
Kung Fu Yoga<br />
Release Date: 3 rd February 2017<br />
Cast: Jackie Chan, Sonu Sood, Disha<br />
Patni<br />
Director: Stanley Tong<br />
Banner: Taihe Entertainment,<br />
Shinework Pictures<br />
Jolly LLB 2<br />
Release Date: 10 th February 2017<br />
Cast: Akshay Kumar, Annu Kapoor,<br />
Saurabh Shukla, Huma Qureshi<br />
Director: Subhash Kapoor<br />
Banner: Fox Star Studios<br />
The Gazi Attack<br />
Release Date: 17 th February 2017<br />
Cast: Rana Dugabatti, Tapsee Pannu<br />
Director: Sankalp<br />
Banner: PVP cinema<br />
Matinee Entertainment<br />
Rangoon<br />
Release Date: 24 th February 2017<br />
Cast: Saif Ali Khan, Shahid Kapoor,<br />
Kangana Ranaut<br />
Director: Vishal Bhardwaj<br />
Banner: Nadiadwala Grandson<br />
Entertainment, VB Pictures,<br />
Viacom 18 Motion Pictures<br />
28
OUTLOOK<br />
CONTENT PIPELINE<br />
Commando 2<br />
Release Date: 3 rd March 2017<br />
Cast: Vidhyut Jamwal, Adah Sharma,<br />
Esha Gupta, Adil Hussian<br />
Director: Deven Bhojani<br />
Banner: Reliance Entertainment<br />
Wolverine 2 (3D IMAX)<br />
Release Date: 3 rd March 2017<br />
Cast: Hugh Jackman, Patrick Stewer<br />
Director: James Mangold<br />
Banner: Fox Star Studios<br />
Badrinath Ki Dulhania<br />
Release Date: 10 th March 2017<br />
Cast: Varun Dhawan, Alia Bhatt<br />
Director: Shashank Khaitaan<br />
Banner: Dharma Productions<br />
Kong: Skull Island (3D IMAX)<br />
Release Date: 10 th March 2017<br />
Cast: Tom Hiddlestone, Samuel L<br />
Jackson, John Goodman<br />
Director: Jordan Wogh Roberts<br />
Banner: Legendary Entertainment,<br />
Tencent Pictures<br />
Sarkaar 3<br />
Release Date: 17 th March 2017<br />
Cast: Amitabh Bachchan, Manoj<br />
Bajpayee, Yami Gautam, Amit Sadh,<br />
Jackie Shroff<br />
Director: Ram Gopal Varma<br />
Banner: Alumbra Entertainment<br />
Wave Cinemas<br />
Phillauri<br />
Release Date: 24 th March 2017<br />
Cast: Anushka Sharma, Daljit<br />
Dosanjh, Suraj Sharma<br />
Director: Anshai Lala<br />
Banner: Fox Star Studios, Clean Slate<br />
Films<br />
29
OUTLOOK<br />
CONTENT PIPELINE<br />
Jagga Jasoos<br />
Release Date: 7 th April 2017<br />
Cast: Ranbir Kapoor, Katrina Kaif<br />
Director: Anurag Basu<br />
Banner: Picture Shuru<br />
Entertainments, Ishana Movies<br />
Going in Style<br />
Release Date: 7 th April 2017<br />
Cast: Joey King, Morgan Freeman,<br />
Michael Caine, Matt Dillon<br />
Director: Zach Braff<br />
Banner: New Line Cinema, De Line<br />
Pictures<br />
Smurfs: The Lost Village (3D)<br />
Release Date: 14 th April 2017<br />
Cast: Joe Manganiello, Demi Lovato,<br />
Jack Mc Bryer<br />
Director: Kelly Asbury<br />
Banner: Sony Pictures Animation<br />
Fast & Furious 8 (3D IMAX)<br />
Release Date: 14 th April 2017<br />
Cast: Vin Diesel, Jason Statham,<br />
Dwyne Johnson, Charlize Theron,<br />
Eva Mendes<br />
Director: F Gary Gary<br />
Banner: One Race Films, Original<br />
Film, Perfect World Pictures<br />
Noor<br />
Release Date: 21 st April 2017<br />
Cast: Sonakshi Sinha, Kannan Gill<br />
Director: Sunhil Sippy<br />
Banner: Abundantia Entertainment<br />
Baahubali – The Conclusion<br />
Release Date: 28 th April 2017<br />
Cast: Prabhas, Rana Dugabatti,<br />
Tamannah Bhatia<br />
Director: S S Rajamauli<br />
Banner: Arka Media Works<br />
30
Q3 & 9M FY17<br />
RESULTS UPDATE<br />
31
Q3 & 9M FY17 – RESULT HIGHLIGHTS<br />
Q3 FY17 YoY ANALYSIS<br />
In Rs. Crore<br />
REVENUES * EBITDA ** and EBITDA MARGIN PAT and PAT MARGIN<br />
297.9 298.0<br />
17.9%<br />
53.4<br />
10.6%<br />
5.7%<br />
1.3%<br />
41 %<br />
31.7<br />
17.0<br />
78 %<br />
3.8<br />
Q3 FY16<br />
Q3 FY17<br />
Q3 FY16<br />
Q3 FY17<br />
Q3 FY16<br />
Q3 FY17<br />
EBIDTA EBIDTA %<br />
PAT PAT %<br />
9M FY17 YoY ANALYSIS<br />
REVENUES * EBITDA ** and EBITDA MARGIN PAT and PAT MARGIN<br />
908.2 932.2<br />
3 %<br />
19.2%<br />
174.4<br />
31 %<br />
13.0%<br />
121.0<br />
7.0%<br />
63.6<br />
52 %<br />
3.2%<br />
30.3<br />
9M FY16<br />
9M FY17<br />
Note: * Net Revenue from Operations, ** EBIDTA excluding Other Income<br />
9M FY16<br />
9M FY17<br />
EBIDTA EBIDTA %<br />
9M FY16<br />
9M FY17<br />
PAT PAT %<br />
32
Q3 & 9M FY17 – RESULT ANALYSIS<br />
Q3 FY17 YoY ANALYSIS<br />
REVENUES * BREAKUP<br />
9M FY17 YoY ANALYSIS<br />
REVENUES * BREAKUP<br />
In Rs. Crore<br />
297.9<br />
298.0<br />
21.3 11 %<br />
23.7<br />
29.5 30.2<br />
65.5 2 %<br />
67.6<br />
908.2<br />
932.2<br />
66.8<br />
71.6<br />
3 %<br />
69.1<br />
75.3<br />
208.6 218.4<br />
5 %<br />
3 %<br />
181.6 176.4<br />
3 %<br />
5 %<br />
561.1 569.4<br />
1 %<br />
Q3 FY16<br />
Q3 FY17<br />
9M FY16<br />
9M FY17<br />
% Share Q3 FY16 Q3 FY17<br />
Net Box Office<br />
Food & Beverages<br />
Advertising<br />
Other Operating Revenues<br />
61.0%<br />
22.0%<br />
9.9%<br />
7.1%<br />
59.2%<br />
22.7%<br />
10.1%<br />
8.0%<br />
% Share 9M FY16 9M FY17<br />
Net Box Office<br />
Food & Beverages<br />
Advertising<br />
Other Operating Revenues<br />
61.7%<br />
23.0%<br />
7.9%<br />
7.4%<br />
61.1%<br />
23.4%<br />
8.1%<br />
7.4%<br />
Note: * Net Revenue from Operations<br />
33
Q3 & 9M FY17 – RESULT ANALYSIS<br />
TOP 5 FILMS<br />
Q3 FY17 Dangal Ae Dil Hai Mushkil<br />
M.S. Dhoni<br />
The Untold Story<br />
Dear Zindagi<br />
Shivaay<br />
Footfalls (Lakhs) 21.72 10.76 11.97 9.19 6.99<br />
GBOC (Rs Crore) 47.45 22.66 20.76 16.92 13.36<br />
Top 5 films accounted for 53% of Q3 FY17 GBOC revenues (48% in Q3 FY16)<br />
GBOC – Gross Box Office Collection<br />
34
Q3 & 9M FY17 – RESULT ANALYSIS<br />
KEY OPERATIONAL METRICS<br />
FOOTFALLS AND OCCUPANCY RATE<br />
FOOTFALLS AND OCCUPANCY RATE - COMPARABLE PROPERTIES<br />
28%<br />
26%<br />
31%<br />
28%<br />
28% 27%<br />
31%<br />
28%<br />
420 407<br />
398 362<br />
129 125<br />
3 % 3 %<br />
Q3 FY16 Q3 FY17 9M FY16 9M FY17<br />
Footfalls (Lakhs) Occupancy (%)<br />
Footfalls with Management Properties<br />
Q3 FY17: 129 lakhs, 9M FY17: 423 lakhs<br />
AVERAGE TICKET PRICE (ATP) (RS)<br />
125 112<br />
10 % 9 %<br />
Q3 FY16 Q3 FY17 9M FY16 9M FY17<br />
Footfalls (Lakhs) Occupancy (%)<br />
AVERAGE TICKET PRICE (ATP) (RS) OF COMPARABLE PROPERTIES<br />
179 182<br />
171<br />
179<br />
179 181<br />
172<br />
180<br />
1 % 5 %<br />
Q3 FY16 Q3 FY17 9M FY16 9M FY17<br />
1 % 5 %<br />
Q3 FY16 Q3 FY17 9M FY16 9M FY17<br />
All the above charts exclude managed properties<br />
35
Q3 & 9M FY17 – RESULT ANALYSIS<br />
KEY OPERATIONAL METRICS<br />
FOOD & BEVERAGES - SPEND PER HEAD (SPH) (RS)<br />
FOOD & BEVERAGES - NET CONTRIBUTION (%)<br />
59<br />
63<br />
58<br />
63<br />
75.6% 76.1% 75.1% 75.8%<br />
6 % 8 %<br />
Q3 FY16 Q3 FY17 9M FY16 9M FY17<br />
Q3 FY16 Q3 FY17 9M FY16 9M FY17<br />
ADVERTISING REVENUES<br />
71.6 75.3<br />
OTHER OPERATING REVENUES<br />
66.8 69.1<br />
29.5 30.2<br />
2 % 5%<br />
21.3 23.7<br />
11 % 3 %<br />
Q3 FY16 Q3 FY17 9M FY16 9M FY17<br />
Advertising Revenues (Rs Cr)<br />
Q3 FY16 Q3 FY17 9M FY16 9M FY17<br />
Other Operating Revenues (Rs Cr)<br />
36
Q3 & 9M FY17 – RESULT ANALYSIS<br />
KEY OPERATIONAL METRICS<br />
ENTERTAINMENT TAX - % FILM DISTRIBUTOR SHARE (%)<br />
26.9% 27.1% 27.1% 27.1%<br />
21.2% 21.3% 21.3% 21.3%<br />
45.1% 45.7% 44.0% 44.6%<br />
35.6% 36.0%<br />
34.6% 35.1%<br />
Entertainment<br />
Tax<br />
Q3 FY16 Q3 FY17 9M FY16 9M FY17<br />
Entertainment Tax - % of NBOC<br />
Properties Screens Seats<br />
Full Tax 93 372 94,719<br />
NBOC (Net Box Office Collections) , GBOC (Gross Box Office Collections)<br />
Average Residual<br />
Period<br />
Exempted 13 51 12,809 3 years<br />
Above figures exclude management properties<br />
Entertainment Tax - % of GBOC<br />
Q3 FY16 Q3 FY17 9M FY16 9M FY17<br />
Distributor Share on NBOC Distributor Share on GBOC<br />
OTHER OVERHEADS PER OPERATING SCREEN (RS LAKHS)<br />
116.6<br />
122.6<br />
34.0 39.7<br />
34.2 32.6<br />
38.3<br />
40.1<br />
11.2 13.5<br />
33.1 34.2<br />
10.9 10.2<br />
5.3 11.0 5.1 11.3<br />
15.3 16.1<br />
Q3 FY16 Q3 FY17 9M FY16 9M FY17<br />
Employee Benefits<br />
Lease Rental & Hire Charges<br />
CAM, Power & Fuel, R&M<br />
Other Overheads<br />
37
PER SCREEN ECONOMICS – SIGNIFICANT SCOPE FOR ROCE IMPROVEMENT<br />
Per Screen Economics is as per IND-AS<br />
Per Screen Economics: (In Rs Lakhs)<br />
ATP (Rs) 174<br />
SPH (Rs) 52<br />
Footfalls (Lakhs) @ 30% Occupancy 14,50,000<br />
Revenue from Operations 320.8<br />
Box Office Revenue (NBOC) 199.8<br />
Food & Beverages 74.7<br />
Advertising Income 27.1<br />
Other Revenues 19.2<br />
Costs:<br />
Distributors' Share @ 36.5% of GBOC 84.5<br />
Other Exhibition Cost 2.5<br />
Food & Beverages Cost 18.6<br />
Property Rent, Conducting Fees 47.1<br />
CAM, Power & Fuel, R&M 45.6<br />
Employee Benefits Expense (excluding corporate overheads) 11.5<br />
Other Overheads 48.5<br />
EBITDA 62.5<br />
EBITDA Margin % 19.5%<br />
Depreciation 19.2<br />
EBIT 43.2<br />
Gross Capex 250.0<br />
Working Capital 0.0<br />
Capital Employed 250.0<br />
ROCE % 17.3%<br />
Per Screen Economics:<br />
% Breakup of Revenues<br />
Box Office Collections (NBOC) 62% - 63%<br />
Food & Beverages 23% - 24%<br />
Advertising Income 8% - 9%<br />
Other Income 5% - 6%<br />
Per Screen Economics: (In Rs Lakhs)<br />
Fixed Costs - ~ 50-51% of total costs 152.7<br />
Contribution (Sales – Variable costs) 215.2<br />
Breakeven Contribution (to cover fixed costs) 152.7<br />
Breakeven Revenues 227.7<br />
Breakeven GBOC 179.0<br />
Breakeven Footfalls 1,02,901<br />
Breakeven Occupancy % 21%<br />
Per Screen Economics:<br />
• Long term steady occupancy levels of ~ 30% and stable ATP.<br />
• Gradually improving share of F&B and advertising revenues.<br />
• EBITDA margins per screen of ~19% - 20%.<br />
• ROCE per screen of ~ 15 - 20%.<br />
• Significant scope for improvement in ROCE per screen driven by<br />
increasing share of F&B revenues (~ 75% contribution) and<br />
advertising revenues (~ 95% contribution) in the future.<br />
38
SHAREHOLDING STRUCTURE<br />
300<br />
250<br />
200<br />
Share Price Performance<br />
Market Data<br />
As on 17.03.17 (BSE)<br />
Market capitalization (Rs Cr) 2,408.1<br />
Price (Rs.) 249.6<br />
No. of shares outstanding (Cr) 9.6<br />
150<br />
Jun-16 Jul-16 Aug-16 Sep-16 Oct-16 Nov-16 Dec-16 Jan-17 Feb-17 Mar-17<br />
Source: BSE<br />
Face Value (Rs.) 10.0<br />
52 week High-Low (Rs.) 292.9 – 188.3<br />
Source: Company<br />
Public /<br />
Others, 15.22<br />
Inox Benefit<br />
Trust, 4.51<br />
DII, 16.64<br />
FII, 14.93<br />
% Shareholding – December 2016 Key Institutional Investors – December 2016 % Holding<br />
Promoter &<br />
Promoter<br />
Group, 48.70<br />
Goldman Sachs India 4.74%<br />
DSP Blackrock MF 4.65%<br />
Kuwait Investment Authority Fund 3.61%<br />
Birla Sunlife MF 3.30%<br />
Morgan Stanley 2.45%<br />
Tata MF 2.11%<br />
Reliance MF 2.06%<br />
ICICI Prudential MF 1.98%<br />
Aadi Financial Advisors LLP 1.49%<br />
SBI MF 1.20%<br />
Sundaram MF 1.06%<br />
Source: Company<br />
39
FOR FURTHER QUERIES:<br />
THANK YOU<br />
Nayana Borthakur<br />
General Manager - Brand & Corporate Communication<br />
Contact No: +9122 4062 6900<br />
Email: contact@inoxmovies.com<br />
Nilesh Dalvi<br />
IR Consultant<br />
Contact No:+91 9819289131<br />
Email ID: nilesh.dalvi@dickensonir.com<br />
40
ANNEXURE<br />
41
DETAILED FINANCIALS<br />
CONSOLIDATED P&L STATEMENT<br />
Particulars (In Rs Cr) Q3 FY17 Q3 FY16 YoY % Q2 FY17 QoQ % 9M FY17 9M FY16 YoY %<br />
Revenue from Operations 298.0 297.9 0.0% 297.4 0.2% 932.2 908.2 2.6%<br />
Exhibition Cost (Distributor Share) 83.5 84.5 -1.3% 86.7 -3.7% 265.6 256.4 3.6%<br />
Food & Beverages Cost 16.1 16.0 0.9% 18.3 -11.9% 52.8 51.9 1.8%<br />
Employee Benefits Expense 21.3 19.8 7.5% 21.8 -2.3% 64.8 55.8 16.1%<br />
Lease Rental & Hire Charges 46.9 41.2 13.9% 44.0 6.6% 137.4 90.5 51.8%<br />
CAM, Power & Fuel, R&M 42.5 40.9 3.9% 43.5 -2.3% 130.9 88.5 48.0%<br />
Other Expenses 56.0 42.1 32.9% 55.9 0.2% 159.8 190.8 -16.3%<br />
EBITDA 31.7 53.4 -40.6% 27.2 16.6% 121.0 174.4 -30.6%<br />
EBITDA Margin % 10.6% 17.9% -728bps 9.1% 150bps 13.0% 19.2% -623bps<br />
Depreciation & Amortisation 21.4 19.7 8.6% 20.8 3.2% 62.5 59.1 5.7%<br />
Other Income 2.2 1.8 23.2% 2.1 2.8% 6.8 5.3 28.8%<br />
Finance Cost 6.5 6.1 5.5% 5.8 11.0% 18.1 18.5 -2.2%<br />
Exceptional Items 0.0 5.0 - 0.0 - - 5.0 -<br />
PBT 6.0 24.3 -75.4% 2.7 121.0% 47.2 97.1 -51.4%<br />
Tax Expense 2.3 7.3 -68.2% 1.1 105.1% 17.0 33.6 -49.3%<br />
PAT 3.7 17.1 -78.5% 1.6 132.5% 30.2 63.6 -52.5%<br />
Share of Associates / Joint Ventures 0.1 -0.0 - -0.0 - 0.1 -0.0 -<br />
Minority Interest - 0.0 - - - - - -<br />
PAT after share of associates/JVs/Minority Interest 3.8 17.0 -77.9% 1.6 140.4% 30.3 63.6 -52.4%<br />
PAT Margin % 1.3% 5.7% -446bps 0.5% 74bps 3.2% 7.0% -375bps<br />
Earnings Per Share (EPS) 0.41 1.86 -78.0% 0.17 141.2% 3.30 6.93 -52.4%<br />
42
DETAILED FINANCIALS<br />
CONSOLIDATED BALANCE SHEET<br />
Particulars (In Rs Cr)<br />
September-16<br />
Equity Share Capital 96.2<br />
Other Equity 486.4<br />
Interest in Inox Benefit Trust, at cost -32.7<br />
Equity attributable to owners of the company 549.9<br />
Non-Controlling Interest -0.0<br />
Total Equity 549.9<br />
Non-current liabilities:<br />
Borrowings 199.4<br />
Other Financial Liabilities 2.5<br />
Other Non-current Liabilities 96.5<br />
Provisions 9.6<br />
Total of Non-Current Liabilities 308.0<br />
Current Liabilities:<br />
Borrowings 0.0<br />
Trade Payables 70.1<br />
Other Financial Liabilities 90.5<br />
Other Current Liabilities 44.4<br />
Provisions 14.9<br />
Current Tax Liabilities (Net) 7.4<br />
Total of Current Liabilities 227.3<br />
Total Equity & Liabilities 1,085.2<br />
Particulars (In Rs Cr)<br />
September-16<br />
Non-Current Assets:<br />
Property, Plant & Equipment 630.0<br />
Capital work-in-progress 53.8<br />
Intangible Assets 30.4<br />
Investments 1.3<br />
Other Financial Assets 140.1<br />
Deferred Tax Assets (Net) 50.3<br />
Other Non Current Assets 74.7<br />
Total Non Current Assets 980.6<br />
Current Assets:<br />
Investments 0.2<br />
Inventories 9.1<br />
Trade Receivables 55.6<br />
Cash and Bank Balances 13.3<br />
Other Financial Assets 2.9<br />
Other Current Assets 23.5<br />
Total Current Assets 104.6<br />
Total Assets 1,085.2<br />
43


