Integrating NetFlow Data into Your Network and Application - NetScout
Integrating NetFlow Data into Your Network and Application - NetScout Integrating NetFlow Data into Your Network and Application - NetScout
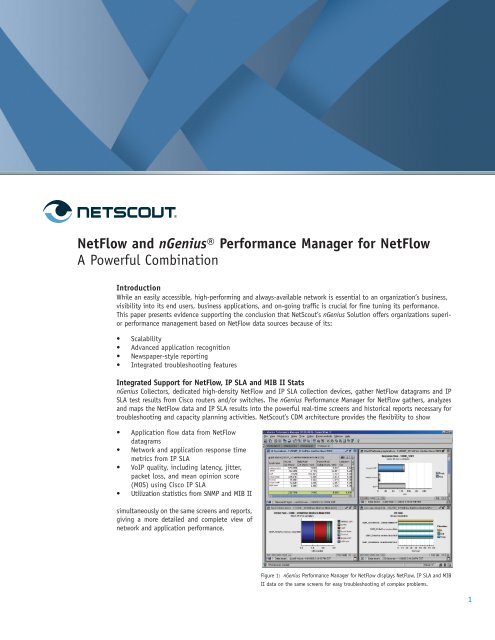
NetFlow and nGenius® Performance Manager for NetFlow A Powerful Combination Introduction While an easily accessible, high-performing and always-available network is essential to an organization’s business, visibility into its end users, business applications, and on-going traffic is crucial for fine tuning its performance. This paper presents evidence supporting the conclusion that NetScout’s nGenius Solution offers organizations superior performance management based on NetFlow data sources because of its: • Scalability • Advanced application recognition • Newspaper-style reporting • Integrated troubleshooting features Integrated Support for NetFlow, IP SLA and MIB II Stats nGenius Collectors, dedicated high-density NetFlow and IP SLA collection devices, gather NetFlow datagrams and IP SLA test results from Cisco routers and/or switches. The nGenius Performance Manager for NetFlow gathers, analyzes and maps the NetFlow data and IP SLA results into the powerful real-time screens and historical reports necessary for troubleshooting and capacity planning activities. NetScout’s CDM architecture provides the flexibility to show • Application flow data from NetFlow datagrams • Network and application response time metrics from IP SLA • VoIP quality, including latency, jitter, packet loss, and mean opinion score (MOS) using Cisco IP SLA • Utilization statistics from SNMP and MIB II simultaneously on the same screens and reports, giving a more detailed and complete view of network and application performance. Figure 1: nGenius Performance Manager for NetFlow displays NetFlow, IP SLA and MIB II data on the same screens for easy troubleshooting of complex problems. 1
- Page 2 and 3: 2 What Is NetFlow? NetFlow-enabled
- Page 4 and 5: 4 Customer Story - Insurance Compan
- Page 6 and 7: 6 applications assigned within each
<strong>NetFlow</strong> <strong>and</strong> nGenius® Performance Manager for <strong>NetFlow</strong><br />
A Powerful Combination<br />
Introduction<br />
While an easily accessible, high-performing <strong>and</strong> always-available network is essential to an organization’s business,<br />
visibility <strong>into</strong> its end users, business applications, <strong>and</strong> on-going traffic is crucial for fine tuning its performance.<br />
This paper presents evidence supporting the conclusion that <strong>NetScout</strong>’s nGenius Solution offers organizations superior<br />
performance management based on <strong>NetFlow</strong> data sources because of its:<br />
• Scalability<br />
• Advanced application recognition<br />
• Newspaper-style reporting<br />
• Integrated troubleshooting features<br />
Integrated Support for <strong>NetFlow</strong>, IP SLA <strong>and</strong> MIB II Stats<br />
nGenius Collectors, dedicated high-density <strong>NetFlow</strong> <strong>and</strong> IP SLA collection devices, gather <strong>NetFlow</strong> datagrams <strong>and</strong> IP<br />
SLA test results from Cisco routers <strong>and</strong>/or switches. The nGenius Performance Manager for <strong>NetFlow</strong> gathers, analyzes<br />
<strong>and</strong> maps the <strong>NetFlow</strong> data <strong>and</strong> IP SLA results <strong>into</strong> the powerful real-time screens <strong>and</strong> historical reports necessary for<br />
troubleshooting <strong>and</strong> capacity planning activities. <strong>NetScout</strong>’s CDM architecture provides the flexibility to show<br />
• <strong>Application</strong> flow data from <strong>NetFlow</strong><br />
datagrams<br />
• <strong>Network</strong> <strong>and</strong> application response time<br />
metrics from IP SLA<br />
• VoIP quality, including latency, jitter,<br />
packet loss, <strong>and</strong> mean opinion score<br />
(MOS) using Cisco IP SLA<br />
• Utilization statistics from SNMP <strong>and</strong> MIB II<br />
simultaneously on the same screens <strong>and</strong> reports,<br />
giving a more detailed <strong>and</strong> complete view of<br />
network <strong>and</strong> application performance.<br />
Figure 1: nGenius Performance Manager for <strong>NetFlow</strong> displays <strong>NetFlow</strong>, IP SLA <strong>and</strong> MIB<br />
II data on the same screens for easy troubleshooting of complex problems.<br />
1
2<br />
What Is <strong>NetFlow</strong>?<br />
<strong>NetFlow</strong>-enabled switches <strong>and</strong> routers from industry-leading vendors track IP flows as they enter an enabled interface<br />
of an infrastructure device in the network. <strong>NetFlow</strong>’s ability to reduce data by aggregating exchanges between a source<br />
<strong>and</strong> destination as a conversation session in a single <strong>NetFlow</strong> datagram record is a recognized value.<br />
<strong>NetFlow</strong> information is transmitted in UDP datagrams that include a header along with one or more flow records. The<br />
UDP <strong>NetFlow</strong> Export Packet is approximately 1500 bytes <strong>and</strong> could include up to 50 flow records. <strong>NetFlow</strong> records are<br />
sent to a <strong>NetFlow</strong> collector by configuring the router or switch with a destination address. The packets are sent with<br />
greater frequency depending upon how busy the <strong>NetFlow</strong>-enabled ports become. Current versions of <strong>NetFlow</strong> implemented<br />
in enterprise networks include <strong>NetFlow</strong> version 1, 5, 7, 8 <strong>and</strong> 9. <strong>NetFlow</strong> v9 can transmit data flow <strong>and</strong> template<br />
records in TCP or SCTP as well as UDP.<br />
<strong>NetFlow</strong> Versions<br />
Version 1: Original version of <strong>NetFlow</strong><br />
Version 5: The st<strong>and</strong>ard <strong>and</strong> most commonly deployed<br />
Version 7: Specific to Cisco Catalyst 6500 <strong>and</strong> 7600 Series Switches, similar to Version 5, but does<br />
not include Autonomous System numbers, interface, TCP Flag <strong>and</strong> TOS information<br />
Version 8: Added a choice of eleven aggregation schemes that reduce resource usage<br />
Version 9: Added a flexible, extensible file export format for easier support of additional fields<br />
<strong>and</strong> technologies such as MPLS, Multicast, <strong>and</strong> BGP Next Hop<br />
What Is Cisco IOS IP SLA?<br />
Cisco IOS IP SLA (formerly known as SAA) is a feature built <strong>into</strong> the Cisco Internetwork Operating System (IOS) used<br />
by most Cisco routers <strong>and</strong> switches. It enables customers to measure key performance indicators of IP applications<br />
<strong>and</strong> services that utilize data, voice, <strong>and</strong> video in an IP network.<br />
Cisco IOS IP SLAs uses active traffic monitoring—the generation of traffic in a continuous, reliable, <strong>and</strong> predictable<br />
manner—for measuring network performance. Cisco IOS IP SLAs sending data across the network to measure performance<br />
between multiple network locations or across multiple network paths. It simulates network data <strong>and</strong> IP services,<br />
<strong>and</strong> collects network performance information in real time. The information collected includes data about response<br />
time, one-way latency, jitter (interpacket delay variance), packet loss, voice quality scoring, network resource availability,<br />
application performance, <strong>and</strong> server response time. Cisco IOS IP SLAs perform active monitoring by generating<br />
<strong>and</strong> analyzing traffic to measure performance either between Cisco IOS devices or from a Cisco IOS device to a remote<br />
IP device such as a network application server.<br />
The IP SLA tests that the nGenius Solution supports are:<br />
IP/SLA ICMP echo A round trip time measuring how long it takes the target device to respond<br />
to an ICMP echo.<br />
IP/SLA DNS Difference in time between when the client sends a DNS request <strong>and</strong> when it<br />
receives a reply.<br />
IP/SLA TCP Socket Connect Difference in time between when the client sends the initial SYN <strong>and</strong> when<br />
the client sends the final ACK in the connect sequence.<br />
IP/SLA UDP jitter (VOIP) Measures round trip delay, average jitter, MOS <strong>and</strong> packet loss.<br />
IP/SLA DHCP Measures the round trip time taken to discover a DHCP Server <strong>and</strong> obtain a lease<br />
from it.<br />
IP/SLA Web Page Retrieval Measures the amount of time it takes to retrieve the specified Web page.<br />
<strong>NetFlow</strong> <strong>and</strong> nGenius Performance Manager for <strong>NetFlow</strong>
Using Netflow <strong>and</strong> IP SLA Information in Enterprise <strong>Network</strong>s<br />
Using <strong>NetFlow</strong> as a data source for network management solutions has a number of benefits. It can be cost-effective<br />
because the infrastructure product that switches <strong>and</strong> routes the packets also tracks <strong>and</strong> produces the <strong>NetFlow</strong> <strong>and</strong> IP<br />
SLA records, meaning that it scales to the enabled ports <strong>and</strong> devices in that network. Another <strong>NetFlow</strong> benefit is that<br />
it normalizes many packet exchanges between two endpoint IP addresses <strong>into</strong> one logical flow-based conversation<br />
record, reducing the impact on the network when it is being sent to collectors.<br />
Enterprises use the information collected from <strong>NetFlow</strong> for a variety of business applications. Some of these include:<br />
• Usage-Based Billing – <strong>NetFlow</strong> records include IP addresses, packet <strong>and</strong> byte counts, timestamps, Type<br />
of Service, <strong>and</strong> application ports that can be used for interdepartmental billing.<br />
• Autonomous System Traffic Engineering – <strong>NetFlow</strong> records include autonomous system numbers that are needed<br />
by ISPs to distinguish each other, <strong>and</strong> are used by traffic engineers to identify trends in order to intelligently<br />
load balance traffic over all their network paths. Autonomous system numbers are available in the Exterior<br />
Border Gateway Protocols used by routers – so they are available to routers, but not available “on the wire.”<br />
• MPLS <strong>and</strong> VPN Traffic Analysis – MPLS affixes labels to IP traffic for prioritization <strong>and</strong> path selection, in the<br />
process obscuring important IP flow information details from many performance instrumentation technologies.<br />
IP VPNs can also obscure important flow details by encrypting traffic streams <strong>and</strong> hiding application<br />
information. <strong>NetFlow</strong> can capture <strong>and</strong> preserve these important details by having either the ingress or egress<br />
edge device generate <strong>NetFlow</strong> records. In this way, crucial management visibility can be maintained.<br />
• User Experience – IP SLA tests provide important information on the end-to-end performance of your<br />
network by monitoring network round trip time, server response time, number of retries <strong>and</strong> retransmissions<br />
<strong>and</strong> voice quality.<br />
<strong>NetFlow</strong> <strong>and</strong> nGenius Performance Manager<br />
Combining <strong>NetFlow</strong> data with nGenius Performance Manager analysis capabilities extends the conversation information<br />
<strong>and</strong> yields top hosts or “top talkers,” application recognition <strong>and</strong> utilization, QoS levels, autonomous system numbers<br />
<strong>and</strong> alarming. <strong>Integrating</strong> IP SLA test results <strong>into</strong> the mix provides response times <strong>and</strong> VoIP quality. The resulting<br />
rich traffic information supports challenging network management tasks that include real-time monitoring, in-depth<br />
troubleshooting, <strong>and</strong> historical reporting for effective capacity planning.<br />
<strong>NetFlow</strong> data resident in enterprise networks can be a valuable source in performing more than network <strong>and</strong> application<br />
performance management disciplines. The nGenius Collector deployed with the st<strong>and</strong>ard nGenius Flow Director<br />
enables users to export the original <strong>NetFlow</strong> datagrams for use by other consumers of the data, such as billing services,<br />
or for industry-st<strong>and</strong>ard security <strong>and</strong> intrusion detection systems. In addition, nGenius Performance Manager’s<br />
open architecture allows logged data to be extracted for use with other traffic analyzers, predictive modeling, usagebased<br />
billing tools, etc.<br />
nGenius Collectors for Efficient <strong>NetFlow</strong> Collection<br />
The nGenius Collector is a dedicated, high-performance appliance for receiving <strong>NetFlow</strong> datagrams from up to 5000<br />
interfaces as well as results from up to 500 IP SLA tests from Cisco routers. nGenius Collectors can be used in either<br />
a dedicated <strong>NetFlow</strong> environment with nGenius Performance Manager<br />
for <strong>NetFlow</strong> or in a hybrid environment with nGenius Probes, nGenius<br />
<strong>Application</strong> Fabric Monitors (AFMon) <strong>and</strong> nGenius Performance<br />
Manager.<br />
Both nGenius Collectors <strong>and</strong> nGenius Probes map the <strong>NetFlow</strong> datagrams<br />
<strong>and</strong> IP SLA test results <strong>into</strong> the CDM framework for display<br />
in the common format views of nGenius Performance Manager, this<br />
enables them to derive additional value from the <strong>NetFlow</strong> datagrams,<br />
such as utilization information <strong>and</strong> the ability to aggregate<br />
port numbers, in order to recognize complex<br />
<strong>and</strong> server-based applications.<br />
Leveraging CDM Technology to Monitor <strong>NetFlow</strong><br />
<strong>NetScout</strong>’s CDM architecture provides the underlying structure for<br />
collecting <strong>and</strong> managing <strong>NetFlow</strong> <strong>and</strong> IP SLA information <strong>and</strong> mapping<br />
them to the powerful real-time <strong>and</strong> historical views <strong>and</strong> reports<br />
available in nGenius® Performance Manager.<br />
<strong>Application</strong> Conversations & Talkers<br />
As described in the table “<strong>NetFlow</strong> <strong>Data</strong>grams”, each <strong>NetFlow</strong> record<br />
details an IP-based conversation. When an nGenius Collector receives<br />
a <strong>NetFlow</strong> datagram it decodes the Flow record <strong>and</strong> fills in the CDM<br />
tables with the basic conversation-layer details, that is, IP source<br />
<strong>NetFlow</strong> <strong>and</strong> nGenius Performance Manager for <strong>NetFlow</strong><br />
<strong>NetFlow</strong> <strong>Data</strong>gram<br />
A <strong>NetFlow</strong> datagram is defined<br />
by seven unique keys. These<br />
elements define one <strong>NetFlow</strong><br />
record from another.<br />
1. Source IP address<br />
2. Destination IP addresses<br />
3. Source Port Number<br />
(TCP or UDP)<br />
4. Destination Port numbers<br />
(TCP or UDP)<br />
5. Layer 3 Protocol Type<br />
(such as IP, ICMP)<br />
6. Type of Service (ToS) bits<br />
7. Input logical interface<br />
(ifIndex)<br />
3
4<br />
Customer Story – Insurance Company<br />
A Northeast-based, nationwide insurance company has a number of business units for different<br />
categories of insurance policies, such as car insurance or life insurance, <strong>and</strong> have developed<br />
custom applications for policy administration. They use the nGenius Collector to collect<br />
<strong>NetFlow</strong> <strong>Data</strong>grams from all remote sales offices for traffic accounting purposes. While they<br />
do not use the information for direct billing, they have found it to be an excellent way to<br />
demonstrate how each business unit’s activity affects expensive b<strong>and</strong>width resources.<br />
<strong>and</strong> destination address <strong>and</strong> well-known TCP or UDP port information for the application in use. The nGenius Collector<br />
then populates the application-layer conversation tables from the <strong>NetFlow</strong> records. The primary benefits of the conversation<br />
information is the ability to see who is talking to whom in the network, at what time of the day <strong>and</strong> using<br />
which applications. Many enterprises <strong>and</strong> government agencies find this conversation-level detail of how valuable network<br />
resources are being consumed very useful.<br />
What distinguishes the nGenius Collector from other solutions is its<br />
ability to gain even greater traffic insight by applying <strong>NetScout</strong>’s<br />
CDM technology. Once the nGenius Collector populates the conversation<br />
tables <strong>and</strong> subsequent “Talkers” tables from the <strong>NetFlow</strong><br />
records, it can perform real-time <strong>and</strong> historical analysis <strong>and</strong> supply<br />
views of Top Talkers or Top Hosts in the network, helping many IT<br />
organizations quickly identify abusers of network b<strong>and</strong>width.<br />
Response Time Stats<br />
IP SLA measures response time, network resource availability, application<br />
performance, MOS, average jitter, connect time, throughput<br />
<strong>and</strong> packet loss. The nGenius Solution uses these response time statistics<br />
to provide worst performing locations, applications, servers,<br />
clients, flows <strong>and</strong> application servers. Together they tell you how<br />
well the network is delivering services to the end user <strong>and</strong> form a<br />
logical starting point for monitoring the performance of your applications<br />
<strong>and</strong> troubleshooting network performance bottlenecks.<br />
Voice Quality<br />
nGenius Performance Manager uses the IP/SLA UPD Jitter test to measure<br />
<strong>and</strong> report on round trip delay (latency), average jitter, packet loss<br />
<strong>and</strong> MOS (mean opinion score) to provide an accurate summary of voice<br />
quality. The UDP Jitter test can be configured to gather jitter, or both<br />
jitter <strong>and</strong> MOS. MOS is an important indicator of voice call quality <strong>and</strong><br />
uses a scale of 1 to 5, with 5 being an "excellent" call <strong>and</strong> 1 being completely<br />
unacceptable. IP SLA data from this test can be viewed in the<br />
following VoIP Quality views:<br />
• VoIP Link Summary – Depending on the test configuration, data<br />
for jitter or both jitter <strong>and</strong> MOS is displayed in this view<br />
• Jitter Over Time<br />
• Worst Links by Highest Jitter<br />
• MOS Over Time<br />
• Worst Links by Lowest MOS<br />
Note: The actual information available depends on whether you are<br />
collecting data for jitter or both jitter <strong>and</strong> MOS<br />
Responsiveness data for the UDP Jitter Test <strong>and</strong> for the rest of the IP<br />
SLA tests listed in the section above can be viewed in the Response<br />
Time section of a NewsPaper <strong>and</strong> in Response Time views.<br />
Figure 2. Monitoring the performance of your applications <strong>and</strong> troubleshooting network<br />
performance bottlenecks is easy when you can see the worst performing servers <strong>and</strong> applications<br />
– based on analysis of IP SLA tests – for your entire enterprise on the same screens<br />
<strong>and</strong> reports.<br />
Figure 3. nGenius Performance Manager for <strong>NetFlow</strong> reports on VoIP quality, including<br />
latency, jitter, packet loss, <strong>and</strong> MOS, using Cisco IP SLA test results.<br />
<strong>NetFlow</strong> <strong>and</strong> nGenius Performance Manager for <strong>NetFlow</strong>
Statistics <strong>and</strong> Utilization<br />
The nGenius Collector identifies the interface port speeds of the <strong>NetFlow</strong>-enabled devices, which enables the nGenius<br />
Performance Management solution to populate the CDM statistics tables. The nGenius solution uses these tables to calculate<br />
total packets <strong>and</strong> utilization for the infrastructure ports. Organizations can use this information for two purposes:<br />
• Real-time troubleshooting – With views of utilization per port, IT staff can quickly identify under- <strong>and</strong><br />
over-utilized ports <strong>and</strong> drill down to discover the applications, users, <strong>and</strong> conversations contributing to<br />
that activity.<br />
• Historical reporting <strong>and</strong> trending – Most- <strong>and</strong> least-utilized ports are displayed in automated daily,<br />
weekly, <strong>and</strong> monthly nGenius Newspapers to help IT staff make informed traffic engineering <strong>and</strong> capacity<br />
planning decisions.<br />
This capability provides historical reports for most- <strong>and</strong> least-utilized segments, enterprise wide, as determined from all<br />
data sources. Other solutions may offer most utilized <strong>NetFlow</strong> segments, or most utilized MIB II segments, however, using<br />
information from all the data sources to calculate these reports, nGenius Performance Manager provides the broadest <strong>and</strong><br />
most complete analysis of top utilized segments available.<br />
Identifying Complex <strong>Application</strong>s from <strong>NetFlow</strong><br />
<strong>NetFlow</strong> supports IP <strong>and</strong> its well-known TCP <strong>and</strong> UDP-based applications, for example Lotus Notes, HTTP or Telnet.<br />
These applications are identified by their well-known TCP or UDP ports <strong>and</strong> are recognized by most <strong>NetFlow</strong> collectors,<br />
including the nGenius Performance Management Solution. However, there are a number of applications that are more<br />
complex in nature, such as SAP or Exchange, which can be transported on multiple ports. Other collection tools are<br />
unable to differentiate ports, <strong>and</strong> when tracking these types of activity, label them as TCP Other or UDP Other.<br />
<strong>NetScout</strong>’s CDM Port can recognize these complex applications. For<br />
example, the range of ports used by SAP can be configured <strong>and</strong><br />
assigned to a single CDM Port number for monitoring <strong>and</strong> tracking<br />
purposes. The nGenius Solution can then aggregate related flow<br />
data so it is reflective of actual impact on the network–such as<br />
showing a single utilization rate of 18% rather than 12 ports representing<br />
1.5% each. In other cases, where the application is not<br />
well-known, the traffic might be labeled "TCP Other" or "UDP Other”<br />
with other solutions whereas CDM port enables proper classification<br />
of a new or customized business application. Furthermore, applications<br />
like the aggregated SAP activity tracked with the assigned<br />
CDM port can now be monitored <strong>and</strong> reported against, including all<br />
talkers <strong>and</strong> conversations, providing an important system-wide view<br />
of all activity which contributes to making more informed decisions<br />
about capacity planning <strong>and</strong> troubleshooting.<br />
Autonomous System Numbers<br />
<strong>NetFlow</strong> records are tracked with Autonomous System (AS) numbers.<br />
AS numbers are unique identifiers for telecommunications providers<br />
globally, assigned to that particular provider or ISP. They are found<br />
in Border Gateway Protocols used by routers <strong>and</strong> are thus available<br />
for inclusion in <strong>NetFlow</strong> records, but are not available “on the wire.”<br />
The nGenius Solution collects this information from each <strong>NetFlow</strong><br />
record, which is particularly useful to ISPs in distinguishing among<br />
themselves for billing purposes or to traffic engineers in establishing<br />
trends of network activity for more informed load balancing.<br />
QoS Monitoring<br />
As one of the seven key distinguishing pieces of information,<br />
<strong>NetFlow</strong> records include the Type of Service bits used to prioritize<br />
applications within a particular Quality of Service class. For<br />
example, when organizations implement a QoS policy <strong>and</strong> want<br />
to prioritize voice traffic over revenue applications, <strong>and</strong> revenue<br />
applications over web surfing, they use ToS. The nGenius solution<br />
identifies the ToS bits <strong>and</strong> categorizes traffic with its associated<br />
QoS class. This allows granular views of a <strong>NetFlow</strong> interface<br />
to be displayed simultaneously with all the QoS levels discovered<br />
in that segment. Further, it can identify <strong>and</strong> track the<br />
<strong>NetFlow</strong> <strong>and</strong> nGenius Performance Manager for <strong>NetFlow</strong><br />
Customer Story –<br />
Regional Service Provider<br />
An Asian-based regional service<br />
provider was experiencing network<br />
challenges in tracking<br />
traffic flows <strong>and</strong> router load in<br />
their core. They needed to identify<br />
individual customers’ business<br />
applications as well as<br />
anomalous traffic patterns.<br />
Simultaneously, they needed to<br />
resolve a number of customer<br />
challenges – evaluation of the<br />
user experience, individual customer<br />
link utilization, <strong>and</strong> utilization<br />
by application. They<br />
deployed nGenius Probes in the<br />
regional core of the customerfacing<br />
part of the network for<br />
identifying all applications <strong>and</strong><br />
response-time analysis. They<br />
used nGenius Collector to collect<br />
<strong>NetFlow</strong> datagrams from<br />
distributed routers for traffic<br />
engineering <strong>and</strong> basic customer<br />
activity monitoring. By monitoring<br />
traffic based on the AS<br />
number in <strong>NetFlow</strong> datagrams,<br />
they could easily track partner<br />
carriers <strong>and</strong> adjust b<strong>and</strong>width<br />
dem<strong>and</strong>.<br />
5
6<br />
applications assigned within each QoS level. This level of detail lets IT quickly uncover<br />
configuration errors, whether they are QoS levels that should not exist or applications<br />
that may have been assigned to a wrong QoS class.<br />
Long-Term Reporting<br />
The nGenius Performance Manager collects data from the nGenius Collectors for historical<br />
reporting via the nGenius NewsPaper, a custom report that users can disseminate to remote<br />
users via a web-based repository called a NewsSt<strong>and</strong>. NewsPapers are composed of sections<br />
<strong>and</strong> articles (categories <strong>and</strong> reports) that contain information relating to network performance.<br />
The categories include:<br />
• Executive Summary–provides a high-level view of activity either enterprise wide or<br />
by area of the network, such as the WAN. From articles published in this section,<br />
organizations can quickly identify top applications <strong>and</strong> busiest ports. This lets companies<br />
making substantial investments in particular applications, SAP for instance,<br />
<strong>and</strong> see how widely deployed <strong>and</strong> utilized it is throughout the network.<br />
• Response Time–provides performance summaries for applications, servers <strong>and</strong> locations<br />
based upon responsiveness data from the UDP Jitter Test <strong>and</strong> from the IP SLA<br />
responsiveness tests.<br />
• Capacity Planning–automatically trends data for data link, network, host <strong>and</strong><br />
application-layer utilization with an integrated baseline of activity. The<br />
Capacity Planning section of the nGenius NewsPaper is where <strong>NetFlow</strong> statistics<br />
offer significant value.<br />
• Situations To Watch–further helps in capacity planning by looking at growing<br />
trends in the network <strong>and</strong> making predictions against segments <strong>and</strong> circuits.<br />
Automated daily, weekly, <strong>and</strong> monthly NewsPapers can be tailored for specific audiences<br />
such as separate NewsPapers for a company’s North American, European, <strong>and</strong> Asian IT<br />
departments or for IT, Finance, <strong>and</strong> other business units.<br />
Enterprise Scalability <strong>and</strong> Flexibility<br />
<strong>NetScout</strong>’s highly scalable, three-tier architecture supports multiple nGenius Performance<br />
Manager Servers deployed in a distributed manner, as well as the companion nGenius<br />
St<strong>and</strong>by Servers for automated redundancy capabilities. When implemented in a distributed<br />
environment, the information between the Global Manager (master), the Local<br />
Servers (slaves) <strong>and</strong> their respective nGenius St<strong>and</strong>by Servers can be shared <strong>and</strong> accessed<br />
seamlessly to more efficiently support distributed, global organizations.<br />
Collecting <strong>NetFlow</strong> on local servers, for example servers placed in North America, Europe<br />
<strong>and</strong> Asia for a global organization, reduces the impact of additional traffic on the network<br />
of these large distributed enterprises. The Global Manager collects <strong>and</strong> aggregates<br />
statistics from all the Local Servers to provide enterprise-wide analysis. For intelligent<br />
capacity planning <strong>and</strong> infrastructure decisions, both IT organizations <strong>and</strong> their business<br />
counterparts need an enterprise view of the most utilized <strong>and</strong> least utilized ports, as<br />
well as the busiest applications <strong>and</strong> this requires that data from all distributed servers<br />
be included in the analysis.<br />
The nGenius St<strong>and</strong>by Server works in conjunction with the nGenius Performance Manager for<br />
<strong>NetFlow</strong> to preserve network performance management <strong>and</strong> configuration data in the event<br />
of a hardware malfunction, power outage or failure due to a natural disaster. By maintaining<br />
a frequently updated <strong>and</strong> replicated copy of the data collected by nGenius Collectors <strong>and</strong><br />
aggregated <strong>into</strong> its performance management software, nGenius St<strong>and</strong>by Server is able to take<br />
over seamlessly <strong>and</strong> without warning.<br />
Customer Story –<br />
Entertainment Company<br />
In addition, the nGenius Solution can share data with other vendors <strong>and</strong> systems. nGenius Collectors can export the<br />
monitored packet streams directly to third-party solutions, such as an Intrusion Detection System (IDS) appliance.<br />
nGenius Performance Manager’s open architecture allows logged data to be extracted for use with other traffic analyzers,<br />
predictive modeling, usage-based billing tools, etc.<br />
The NewsPapers in nGenius Performance Manager display analyzed information from <strong>NetFlow</strong>, nGenius Probes <strong>and</strong> SNMP<br />
data sources side by side. Viewing application <strong>and</strong> utilization details for all network intelligent data sources improves<br />
capacity planning <strong>and</strong> decision making processes.<br />
A Midwest-based company that<br />
manages golf courses was<br />
migrating from a Frame Relay<br />
WAN to an MPLS network with<br />
VPNs to encrypt their traffic.<br />
With this change, they were<br />
also going from a hub <strong>and</strong><br />
spoke architecture to a meshed<br />
network design so all the locations<br />
could communicate directly<br />
with each other, avoiding the<br />
inefficiency of everything coming<br />
<strong>into</strong> the central site first.<br />
The challenge was to do all this<br />
<strong>and</strong> not lose the visibility <strong>into</strong><br />
the application <strong>and</strong> conversation<br />
detail that previously<br />
existed.<br />
They determined it would be<br />
too expensive to re-instrument<br />
every remote location to match<br />
their previous SLA-managed<br />
Frame Relay service offering.<br />
However, they could use<br />
<strong>NetFlow</strong> <strong>and</strong> strategically<br />
deployed nGenius Probes to provide<br />
the best visibility at a<br />
cost-effective price. nGenius<br />
Collectors gathered <strong>NetFlow</strong><br />
data from all the remote locations<br />
getting a perspective on<br />
communications between locations<br />
while nGenius LAN Probes<br />
with site monitoring enabled at<br />
the hub site viewed traffic from<br />
the sites coming <strong>into</strong> headquarters.<br />
nGenius Performance<br />
Manager brought it all together<br />
with real-time screens <strong>and</strong> historical<br />
reports with aggregated<br />
views <strong>and</strong> analysis.<br />
<strong>NetFlow</strong> <strong>and</strong> nGenius Performance Manager for <strong>NetFlow</strong>
Solution Benefits<br />
The nGenius Performance Manager for <strong>NetFlow</strong> offers a significant value to organizations that use <strong>NetFlow</strong> as their<br />
network <strong>and</strong> application performance monitoring solution. Some of the benefits users can derive by deploying<br />
nGenius Performance Manager for <strong>NetFlow</strong> include:<br />
• Real-time, integrated views <strong>and</strong> analysis of <strong>NetFlow</strong>, IP SLA <strong>and</strong> MIB II data for effective troubleshooting<br />
of end-user <strong>and</strong> application problems enterprise wide.<br />
• Displays of multiple <strong>NetFlow</strong>-enabled devices <strong>and</strong> ports simultaneously for quickly pinpointing over- <strong>and</strong><br />
under-utilized ports.<br />
• Rich, application recognition applied to <strong>NetFlow</strong>-collected records by the CDM Port for complex applications,<br />
like SAP <strong>and</strong> Exchange, to uncover trends in the performance of these critical business applications<br />
<strong>and</strong> services.<br />
• Drilldowns on <strong>NetFlow</strong> ports to view applications, talkers, <strong>and</strong> conversations in use for identifying who<br />
contributes to high port utilization <strong>and</strong> for highlighting misuse of network resources.<br />
• Response time statistics to monitor how well the network is delivering services to the end user.<br />
• Conversation details that are made available to other consumers of <strong>NetFlow</strong> records, for applications such<br />
as usage-based billing solutions.<br />
• Long-term reports of application activity based on <strong>NetFlow</strong> records for helping traffic engineers properly<br />
size network segments <strong>and</strong> establish contracts with service providers for WAN services.<br />
• Enterprise scalability for distributed networks <strong>and</strong> redundancy.<br />
Conclusion<br />
IT organizations in corporations <strong>and</strong> government agencies alike are continuously challenged to efficiently deliver business-critical<br />
applications enterprise wide. Detailed monitoring <strong>and</strong> tracking of applications <strong>and</strong> users is essential in<br />
optimizing the performance of the networks they run on. <strong>NetScout</strong>’s nGenius Performance Management System, in combination<br />
with rich <strong>NetFlow</strong> data, offers the right combination of scalability, advanced application recognition, newspaper-style<br />
reporting, integrated troubleshooting, <strong>and</strong> support of multiple network management data sources. This is<br />
the type of expert information that IT departments need in order to provide high-quality business services to their<br />
users.<br />
©2007 <strong>NetScout</strong> Systems, Inc. All rights reserved. <strong>NetScout</strong> <strong>and</strong> the <strong>NetScout</strong> logo, nGenius <strong>and</strong> Quantiva are<br />
registered trademarks of <strong>NetScout</strong> Systems, Inc. The CDM logo, MasterCare <strong>and</strong> the MasterCare logo are trademarks<br />
of <strong>NetScout</strong> Systems, Inc. Other br<strong>and</strong>s, product names <strong>and</strong> trademarks are property of their respective<br />
owners. <strong>NetScout</strong> reserves the right, at its sole discretion, to make changes at any time in its technical<br />
information <strong>and</strong> specifications, <strong>and</strong> service <strong>and</strong> support programs.<br />
<strong>NetScout</strong> Systems, Inc.<br />
Corporate Headquarters<br />
310 Littleton Road<br />
Westford, MA 01886 USA<br />
Telephone (978) 614-4000<br />
Fax (978) 614-4004<br />
Web: www.netscout.com<br />
WP20070308


