Saudi Petrochemicals sector
2lWYG0v
2lWYG0v

Create successful ePaper yourself
Turn your PDF publications into a flip-book with our unique Google optimized e-Paper software.
<strong>Saudi</strong> <strong>Petrochemicals</strong> Sector<br />
<strong>Petrochemicals</strong> –Industrial<br />
<strong>Saudi</strong> Arabia<br />
06 March 2017<br />
January 18, 2010<br />
Monthly update<br />
In our monthly note, we update price movements of<br />
major petrochemical products, manufacturing activity<br />
in key demand markets, recent announcements and<br />
valuations of <strong>Saudi</strong> petrochemical companies &<br />
peers.<br />
Price movement of key petrochemical products<br />
Products 1-Month* Y-o-Y<br />
Ethylene +17.3% +41.8%<br />
HDPE +4.3% +9.9%<br />
LDPE +3.4% +21.8%<br />
Propylene +10.7% +69.0%<br />
Polypropylene +7.9% +32.4%<br />
Methanol +8.5% +70.2%<br />
Benzene +0.5% +77.1%<br />
Ammonia +14.0% +14.0%<br />
Urea -9.1% +13.6%<br />
* Last month change<br />
Summary<br />
Stock Rating Price Target<br />
SABIC N SAR97.0<br />
Yansab N SAR58.0<br />
SAFCO UW SAR62.0<br />
APCC N SAR46.0<br />
Tasnee UR Under Review<br />
Sipchem OW SAR20.4<br />
Research Department<br />
Pritish K. Devassy, CFA<br />
Tel +966 11 2119370, devassyp@alrajhi-capital.com<br />
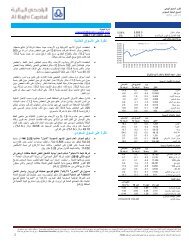
<strong>Saudi</strong> <strong>Petrochemicals</strong> <strong>sector</strong><br />
Spreads improve, slightly below our estimate<br />
Aramco lowers Propane price for March: After increasing to the highest level<br />
in more than two years in February, <strong>Saudi</strong> Aramco has lowered Propane price<br />
for March to US$480/t (-6% m-o-m), in line with our expectation. US Propane<br />
price also declined ~19% m-o-m in February. On the other hand, Aramco kept<br />
Butane price unchanged at US$600/t for March. Meanwhile, Naphtha was<br />
marginally down ~1.2% m-o-m in February. As Brent oil price is trading in a<br />
tight range of US$55-58 a barrel, we do not expect a significant upward<br />
movement in Naphtha price in the near-term. Despite an improvement in NGL<br />
discount to Naphtha (~5.5% on current Naphtha price), it is still lower than the<br />
9-10% historical average. Unless oil price increases or NGLs demand remains<br />
strong, we expect a further reduction in Propane price for April as some Asian<br />
and European petchem cracker units could switch their feedstock mix depending<br />
on the feedstock prices.<br />
Product prices advanced in February: Prices of most petrochemical products<br />
advanced in February with Ethylene (+17.3% m-o-m ) and Propylene (+10.7%)<br />
increasing significantly, driven by improved demand coupled with tight supply<br />
primarily on account of maintenance shut-downs. Other polymer products such<br />
as HDPE (+4.3%), LDPE (+3.4%), Polypropylene (+7.9%) and Polystyrene<br />
(+4.6%) continued their upward journeys, mainly due to higher upstream costs<br />
and improved demand. However, we believe the current polymer prices may not<br />
sustain going forward because prices are usually strong in January and February<br />
(m-o-m). Historically, we observe that Polypropylene peaks in Q1 . In five times<br />
out of last six years prices have increased on a m-o-m basis. Meanwhile prices of<br />
C5+ products of naphtha cracking, such as Benzene (+0.5% m-o-m) and Styrene<br />
(+0.4% m-o-m) remained almost unchanged. Methanol price also gained 8.5%<br />
in February. Snapping its upward journey, Urea (-9.1%) declined in February for<br />
the first time since July 2016.<br />
Spreads improved on higher product prices: Overall as most products’ prices<br />
have increased more than costs, spreads improved in February (m-o-m) but still<br />
marginally below our forecasts. Going forward, though spreads might improve<br />
on lower NGLs prices, Q1 margin for most companies is likely to be lower on a<br />
sequential basis.<br />
Most coverage companies currently trading a fair price: While we reiterate<br />
our ratings and target prices (see left pane) for most of the companies under our<br />
coverage , we put Tasnee under review post its announcement of plan of sale of<br />
Cristal assets. We also upgrade Sipchem to Overweight after a recent decline in<br />
stock price (Target Price unchanged). Apart from Sipchem most of the<br />
companies are currently trading at around their fair prices in our view. We see<br />
limited upside potential unless product prices and/or spread rise further.<br />
Oil prices marginally up: Crude oil price was marginally up 1.1% m-o-m in<br />
February. While on the one hand, OPEC is cutting production (94% of<br />
production cut quota reached in February as per Reuters survey) to balance the<br />
oil market, on the other, US is increasing production amid oil price recovery. US<br />
domestic crude production remains above 9m bpd for the second consecutive<br />
months on increased drilling activity, pushing US crude stock levels to a record<br />
highs last week. US oil rig count continued to rise for the ninth consecutive<br />
months in February (602 at the end of February vs. 566 at the end of January<br />
2017; source: Baker Hughes). Nonetheless, demand continues to improve in<br />
February as global manufacturing activities continued to witness an<br />
improvement for the sixth consecutive month with JPM Global Manufacturing<br />
PMI rising to a 69-month high of 52.9.<br />
Please see penultimate page for additional important disclosures. Al Rajhi Capital (Al Rajhi) is a foreign broker-dealer unregistered in the<br />
USA. Al Rajhi research is prepared by research analysts who are not registered in the USA. Al Rajhi research is distributed in the USA pursuant to<br />
Rule 15a-6 of the Securities Exchange Act of 1934 solely by Rosenblatt Securities, an SEC registered and FINRA-member broker-dealer.
Spread ($/MT)<br />
Spread ($/MT)<br />
Spread ($/MT)<br />
Q1 2013<br />
Q1 2013<br />
Q1 2013<br />
Q2 2013<br />
Q2 2013<br />
Q2 2013<br />
Q3 2013<br />
Q3 2013<br />
Q3 2013<br />
Q4 2013<br />
Q4 2013<br />
Q4 2013<br />
Q1 2014<br />
Q1 2014<br />
Q1 2014<br />
Q2 2014<br />
Q2 2014<br />
Q2 2014<br />
Q3 2014<br />
Q3 2014<br />
Q3 2014<br />
Q4 2014<br />
Q4 2014<br />
Q4 2014<br />
Q1 2015<br />
Q1 2015<br />
Q1 2015<br />
Q2 2015<br />
Q2 2015<br />
Q2 2015<br />
Q3 2015<br />
Q3 2015<br />
Q3 2015<br />
Q4 2015<br />
Q4 2015<br />
Q4 2015<br />
Q1 2016<br />
Q1 2016<br />
Q1 2016<br />
Q2 2016<br />
Q2 2016<br />
Q2 2016<br />
Q3 2016<br />
Q3 2016<br />
Q3 2016<br />
Q4 2016<br />
Q4 2016<br />
Q4 2016<br />
Q1 2017<br />
Q1 2017<br />
Q1 2017<br />
Share Price (SAR)<br />
Share Price (SAR)<br />
Share Price (SAR)<br />
Spread ($/MT)<br />
Spread ($/MT)<br />
Spread ($/MT)<br />
Q1 2013<br />
Q1 2013<br />
Q1 2013<br />
Q2 2013<br />
Q2 2013<br />
Q2 2013<br />
Q3 2013<br />
Q3 2013<br />
Q3 2013<br />
Q4 2013<br />
Q4 2013<br />
Q4 2013<br />
Q1 2014<br />
Q1 2014<br />
Q1 2014<br />
Q2 2014<br />
Q2 2014<br />
Q2 2014<br />
Q3 2014<br />
Q3 2014<br />
Q3 2014<br />
Q4 2014<br />
Q4 2014<br />
Q4 2014<br />
Q1 2015<br />
Q1 2015<br />
Q1 2015<br />
Q2 2015<br />
Q2 2015<br />
Q2 2015<br />
Q3 2015<br />
Q3 2015<br />
Q3 2015<br />
Q4 2015<br />
Q4 2015<br />
Q4 2015<br />
Q1 2016<br />
Q1 2016<br />
Q2 2016<br />
Q1 2016<br />
Q2 2016<br />
Q3 2016<br />
Q2 2016<br />
Q3 2016<br />
Q4 2016<br />
Q3 2016<br />
Q4 2016<br />
Q1 2017<br />
Q1 2017<br />
Q4 2016<br />
Q1 2017<br />
Share Price (SAR)<br />
Share Price (SAR)<br />
Share price (SAR)<br />
<strong>Saudi</strong> <strong>Petrochemicals</strong><br />
Sector<br />
<strong>Petrochemicals</strong> –Industrial<br />
02 March 2017<br />
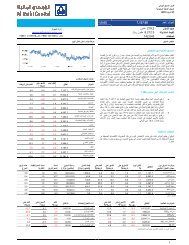
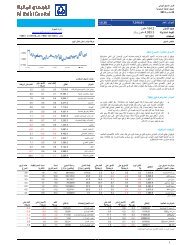
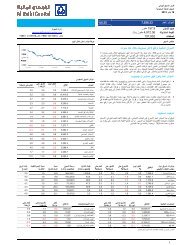
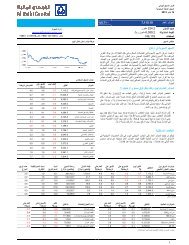
Trading opportunities<br />
The following charts show the stock price movements vs. weighted price spreads (between<br />
the end product prices and key feedstock, unadjusted for production). Based on our tracker<br />
model, we expect SAFCO to continue moving higher in the near-term on positive divergence<br />
due to higher urea prices this quarter, while APCC could trade lower due to declining spread<br />
on higher NGLs prices in Q1.<br />
Figure 1 APCC Price and Spread<br />
Figure 2 YANSAB Price and Spread<br />
1,400<br />
50.0<br />
1,400<br />
70.0<br />
1,200<br />
45.0<br />
40.0<br />
1,200<br />
60.0<br />
1,000<br />
35.0<br />
1,000<br />
50.0<br />
800<br />
600<br />
30.0<br />
25.0<br />
20.0<br />
800<br />
600<br />
40.0<br />
30.0<br />
400<br />
200<br />
15.0<br />
10.0<br />
5.0<br />
400<br />
200<br />
20.0<br />
10.0<br />
-<br />
-<br />
-<br />
-<br />
Spread<br />
APCC Share Price<br />
Spread<br />
YANSAB Share Price<br />
Source: Company data, Al Rajhi Capital, Bloomberg<br />
Source: Company data, Al Rajhi Capital, Bloomberg<br />
Figure 3 SIPCHEM Price and Spread<br />
Figure 4 SAFCO Price and Spread<br />
1,000<br />
40.0<br />
450<br />
140.0<br />
900<br />
800<br />
700<br />
600<br />
500<br />
400<br />
300<br />
200<br />
100<br />
35.0<br />
30.0<br />
25.0<br />
20.0<br />
15.0<br />
10.0<br />
5.0<br />
400<br />
350<br />
300<br />
250<br />
200<br />
150<br />
100<br />
50<br />
120.0<br />
100.0<br />
80.0<br />
60.0<br />
40.0<br />
20.0<br />
-<br />
-<br />
-<br />
-<br />
Spread<br />
SIPCHEM Share Price<br />
Spread<br />
SAFCO Share Price<br />
Source: Company data, Al Rajhi Capital, Bloomberg<br />
Source: Company data, Al Rajhi Capital, Bloomberg<br />
Figure 5 Tasnee Price and Spread<br />
Figure 6 SABIC Price and Spread<br />
2,000<br />
40.0<br />
1,200<br />
120<br />
1,800<br />
1,600<br />
35.0<br />
30.0<br />
25.0<br />
1,000<br />
800<br />
100<br />
80<br />
1,400<br />
20.0<br />
600<br />
60<br />
1,200<br />
1,000<br />
15.0<br />
10.0<br />
5.0<br />
400<br />
200<br />
40<br />
20<br />
800<br />
-<br />
-<br />
-<br />
Spread<br />
Tasnee Share Price<br />
Spread<br />
SABIC Price<br />
Source: Company data, Al Rajhi Capital, Bloomberg<br />
Source: Company data, Al Rajhi Capital, Bloomberg<br />
Disclosures Please refer to the important disclosures at the back of this report. 2
<strong>Saudi</strong> <strong>Petrochemicals</strong><br />
Sector<br />
<strong>Petrochemicals</strong> –Industrial<br />
02 March 2017<br />
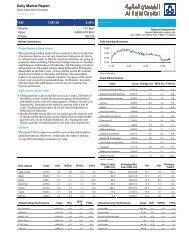
Figure 7 Price movement of key petrochemicals, fertilizers and metals<br />
Products Recent Price*<br />
% Change<br />
1-Month** QTD YTD 1-Year<br />
European Brent (US$/bbl) 56.8 1.1 (2.2) (2.2) 32.0<br />
WTI (US$/bbl) 54.2 1.1 (2.2) (2.2) 29.0<br />
Henry Hub Natural Gas (US$/mmbtu) 2.5 (16.3) (31.7) (31.7) 55.6<br />
Naphtha - Japan (US$/ton) 508 (1.2) 2.3 2.3 55.5<br />
Propane - Aramco (US$/ton) 480 17.2 26.3 26.3 65.5<br />
Butane - Aramco (US$/ton) 600 21.2 42.9 42.9 87.5<br />
Key petrochemicals (US$/ton)<br />
Ethylene (FOB Japan) 1,290 17.3 17.3 17.3 41.8<br />
HDPE (SE Asia) 1,220 4.3 4.3 4.3 9.9<br />
LDPE (SE Asia) 1,370 3.4 6.2 6.2 21.8<br />
Propylene (FOB Korea) 980 10.7 13.3 13.3 69.0<br />
Polypropylene (SE Asia) 1,165 7.9 10.4 10.4 32.4<br />
Methanol (CFR China) 371 8.5 6.0 6.0 70.2<br />
MTBE (Asia) 660 (4.3) (4.3) (4.3) 28.2<br />
Benzene (FOB Korea) 965 0.5 16.3 16.3 77.1<br />
Toluene (CFR Japan) 700 (7.3) 2.9 2.9 21.7<br />
Styrene (FOB Korea) 1,390 0.4 18.3 18.3 44.0<br />
Polystyrene (Asia) 1,480 4.6 12.1 12.1 34.5<br />
Other petrochemicals (US$/ton)<br />
Mono-ethylene glycol - SABIC 1,180 7.3 12.4 12.4 55.3<br />
Ethylene di-chloride (FOB NWE) 305 10.9 19.6 19.6 35.6<br />
Vinyl Acetate Monomer (China) 760 2.0 4.1 4.1 (14.1)<br />
Polyvinyl chloride (SE Asia) 950 5.0 5.6 5.6 30.1<br />
Titanium Dioxide (Asia) 2,460 5.1 5.1 5.1 23.0<br />
Acrylic Acid (China) 1,390 (2.8) 9.4 9.4 91.7<br />
Fertilizers (US$/ton)<br />
Ammonia (Middle East) 325 14.0 58.5 58.5 14.0<br />
Urea (Middle East) 250 (9.1) 2.0 2.0 13.6<br />
DAP (Middle East) 360 4.3 10.8 10.8 (2.7)<br />
Metals<br />
Gold - US Spot (US$/oz) 1,240 3.1 8.0 8.0 0.6<br />
Aluminum - LME (US$/ton) 1,920 5.8 12.7 12.7 20.3<br />
Copper - LME (US$/ton) 5,936 0.3 7.9 7.9 26.2<br />
Source: Bloomberg, Argaam, Al Rajhi Capital. * Last closing. ** 1-Month represents the last month change.<br />
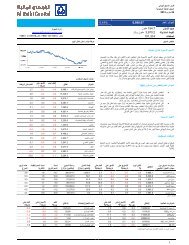
Figure 8 Historical 1-Year Forward PE Multiples Trend<br />
Figure 9 Historical 1-Year Forward EV/EBITDA Multiples Trend<br />
20<br />
11<br />
18<br />
10<br />
16<br />
9<br />
14<br />
8<br />
12<br />
7<br />
10<br />
6<br />
8<br />
5<br />
6<br />
Mar-14 Sep-14 Mar-15 Sep-15 Mar-16 Sep-16 Mar-17<br />
4<br />
Mar-14 Sep-14 Mar-15 Sep-15 Mar-16 Sep-16 Mar-17<br />
SABIC<br />
MSCI World Chemical Index<br />
SABIC<br />
MSCI World Chemical Index<br />
Source: Bloomberg, Al Rajhi Capital<br />
Source: Bloomberg, Al Rajhi Capital<br />
Disclosures Please refer to the important disclosures at the back of this report. 3
<strong>Saudi</strong> <strong>Petrochemicals</strong><br />
Sector<br />
<strong>Petrochemicals</strong> –Industrial<br />
02 March 2017<br />
Figure 10 Margins and Valuation Metrics - <strong>Saudi</strong> petrochemical companies vs. global peers<br />
Company Name<br />
<strong>Saudi</strong> Arabia<br />
Market<br />
Cap (US$<br />
'mn)<br />
TTM<br />
Operating<br />
margin<br />
TTM Net<br />
margin<br />
2017 PE P/B<br />
2017E<br />
EV/Sales<br />
2017E<br />
EV/EBITDA<br />
TTM<br />
ROE<br />
TTM<br />
Operating<br />
ROE<br />
SABIC 77,798 21.3 13.4 15.9x 1.8x 2.3x 7.6x 11.0 17.4 5.5<br />
SAFCO 7,861 35.4 36.8 22.1x 4.2x 9.2x 17.5x 14.4 13.9 12.1<br />
Sipchem 1,750 12.4 2.1 15.1x 1.1x 3.4x 8.7x 1.2 7.1 0.4<br />
NIC 3,104 10.2 1.7 16.1x 1.4x 2.4x 9.6x 3.2 19.6 0.6<br />
Yansab 8,437 35.7 33.0 14.7x 1.9x 4.1x 8.9x 14.6 15.7 11.2<br />
APC 2,414 33.4 34.2 13.5x 3.0x 4.0x 10.3x 26.4 25.8 17.7<br />
SPC 1,819 19.4 22.8 17.5x 1.2x 3.9x 13.9x 7.4 6.3 4.7<br />
<strong>Saudi</strong> Kayan 3,340 11.4 1.6 19.8x NA 3.7x 9.9x NA NA NA<br />
PetroRabigh 3,142 0.4 0.1 84.1x 1.4x 1.8x 20.4x 0.4 1.3 0.1<br />
SIIG 2,586 16.3 8.0 11.6x 1.3x 3.4x 9.5x 6.6 13.5 1.8<br />
Chemanol 241 (16.0) (18.9) 15.3x 0.7x 2.1x 6.6x (8.4) (7.1) (4.5)<br />
Nama 141 (36.5) NA NA 1.7x NA NA (119.7) (22.5) (41.4)<br />
Alujain 386 18.7 7.7 19.0x 1.3x 2.2x NA 10.2 24.6 3.4<br />
National Petrochemical 2,611 16.6 6.5 12.6x 1.6x 3.1x 9.2x 6.6 16.8 1.8<br />
Median 16.5 7.7 15.9x 1.4x 3.4x 9.5x 6.6 13.9 1.8<br />
Average 12.8 11.5 21.3x 1.7x 3.5x 11.0x (2.0) 10.2 1.0<br />
Middle East & Africa (ex-<strong>Saudi</strong> Arabia)<br />
Industries Qatar 19,107 21.2 73.3 17.6x 2.1x 13.2x 58.8x 10.0 2.9 9.5<br />
Mesaieed Petrochem 5,417 NA NA NA NA NA NA NA NA NA<br />
Sidi Kerir 607 26.9 24.1 12.1x 4.3x 2.7x 9.2x 30.9 34.5 22.7<br />
Al Qurain 1,151 12.5 18.1 NA 1.1x NA NA 9.0 6.2 5.4<br />
Sasol 18,962 14.2 8.4 9.9x 1.2x 1.7x 5.4x 7.0 11.8 3.9<br />
Median 17.7 21.1 12.1x 1.6x 2.7x 9.2x 9.5 9.0 7.5<br />
Average 18.7 31.0 13.2x 2.2x 5.9x 24.5x 14.2 13.9 10.4<br />
Europe<br />
BASF 86,962 11.2 7.0 17.0x 2.6x 1.6x 8.7x 12.9 20.5 5.5<br />
Solvay 12,454 8.3 5.1 13.2x 1.2x 1.4x 6.7x 6.5 10.5 2.5<br />
Lanxess 6,313 6.6 2.7 26.2x 2.6x 1.0x 7.4x 9.1 22.2 2.7<br />
Arkema 7,409 9.5 5.7 14.7x 1.7x 1.1x 6.7x 10.5 17.7 4.8<br />
Yara 10,411 9.2 6.7 14.2x 1.2x 1.0x 6.7x 8.6 11.8 5.3<br />
Akzo Nobel 17,210 10.7 6.8 15.5x 2.5x 1.2x 8.2x 14.9 23.3 6.0<br />
Clariant 6,227 NA NA NA NA NA NA NA NA NA<br />
Median 9.4 6.2 15.1x 2.1x 1.1x 7.1x 9.8 19.1 5.1<br />
Average 9.2 5.7 16.8x 2.0x 1.2x 7.4x 10.4 17.7 4.5<br />
North America<br />
Eastman 11,882 15.6 9.6 11.2x 2.7x 2.0x 8.3x 20.7 31.3 5.5<br />
Dow 76,997 7.1 9.0 15.5x 3.0x 1.8x 8.7x 16.7 14.4 5.9<br />
Westlake 8,532 11.5 7.9 16.4x 2.4x 1.6x 7.9x 11.7 17.1 4.8<br />
Celanese Corp 12,723 16.6 16.7 12.4x 4.9x 2.7x 9.6x 36.2 36.0 10.6<br />
Methanex 4,671 1.4 (0.6) 13.4x 2.9x 2.1x 7.7x (0.8) 1.7 (0.3)<br />
LyondellBasell Industries 37,794 17.3 13.1 9.4x 6.3x 1.4x 6.7x 60.8 80.3 16.6<br />
Huntsman Corp 5,485 6.7 3.4 12.6x 4.3x 1.0x 7.7x 23.9 47.4 3.4<br />
Median 11.5 9.0 12.6x 3.0x 1.8x 7.9x 20.7 31.3 5.5<br />
Average 10.9 8.4 13.0x 3.8x 1.8x 8.1x 24.2 32.6 6.7<br />
Asia<br />
Indorama Ventures 4,988 6.3 6.4 17.3x 2.0x 0.9x 9.5x 17.9 19.0 6.7<br />
Mitsui Chemicals 5,225 7.3 3.3 10.6x 1.4x 0.9x 7.3x 9.3 20.3 3.0<br />
Sumitomo 9,449 6.9 2.7 14.9x 1.3x 1.1x 8.7x 6.4 16.1 1.8<br />
Formosa Chemicals & Fibre Corp 18,027 9.8 13.0 14.1x 1.9x 1.9x 12.4x 14.7 11.0 8.0<br />
Lotte Chemical Corp 11,170 19.3 13.6 6.4x 1.5x 0.9x 4.2x 18.0 26.7 11.1<br />
Formosa Plastics Corp 18,689 5.1 18.9 17.2x 2.0x 3.1x 27.8x 11.9 3.2 7.9<br />
LG Chem 17,756 9.6 6.2 12.7x 1.4x 0.9x 5.6x 8.3 14.3 6.4<br />
Median 7.3 6.4 14.1x 1.5x 0.9x 8.7x 11.9 16.1 6.7<br />
Average 9.2 9.2 13.3x 1.6x 1.4x 10.8x 12.4 15.8 6.4<br />
Indices<br />
S&P500 Chemical Index 452,403 13.2 9.5 18.7x 4.7x 2.5x 10.7x 19.9 19.9 6.1<br />
MSCI World Chemical Index 1,103,204 11.1 7.4 18.5x 3.0x 1.9x 10.0x 13.8 13.8 5.3<br />
TASI 435,599 18.2 15.4 14.3x 1.6x 3.3x 10.5x 9.4 9.4x 2.3<br />
Source: Bloomberg, Al Rajhi Capital. Notes: 1) Market cap as of March 1, 2017. 2) All valuation ratios as on latest trading prices.<br />
TTM<br />
ROA<br />
Disclosures Please refer to the important disclosures at the back of this report. 4
<strong>Saudi</strong> <strong>Petrochemicals</strong><br />
Sector<br />
<strong>Petrochemicals</strong> –Industrial<br />
02 March 2017<br />
Figure 11 Performance of <strong>Saudi</strong> petrochemical companies vs. global peers<br />
Company Currency Last Price*<br />
% Change 52-Week Dividend<br />
1 Month** QTD YTD 1 Year High Low LTM Yield<br />
<strong>Saudi</strong> Arabia<br />
SABIC SAR 96.87 1.4 5.9 5.9 42.0 98.5 73.3 5.0 5.2%<br />
SAFCO SAR 70.75 (2.6) (5.2) (5.2) 10.0 82.0 58.0 4.5 6.4%<br />
Sipchem SAR 17.70 (7.0) (6.3) (6.3) 33.5 19.8 11.8 NA NA<br />
NIC SAR 17.29 8.9 (1.0) (1.0) 99.0 20.0 8.8 NA NA<br />
Yansab SAR 56.34 (4.8) 4.3 4.3 76.2 59.8 35.3 2.5 4.4%<br />
APC SAR 45.86 (0.1) (0.2) (0.2) 58.1 48.6 31.5 2.5 5.5%<br />
SPC SAR 15.55 (0.6) 5.4 5.4 97.1 15.9 8.3 0.5 3.2%<br />
<strong>Saudi</strong> Kayan SAR 8.30 (1.5) (6.1) (6.1) 70.1 9.5 4.9 NA NA<br />
PetroRabigh SAR 13.36 9.8 13.6 13.6 43.7 13.6 8.7 NA NA<br />
SIIG SAR 21.53 13.4 14.1 14.1 88.5 23.5 11.4 NA NA<br />
Chemanol SAR 7.51 4.3 (6.4) (6.4) 31.1 8.4 4.9 NA NA<br />
Nama SAR 4.15 (17.0) (33.1) (33.1) (25.8) 7.2 3.6 NA NA<br />
Alujain SAR 20.99 7.6 12.5 12.5 68.1 22.6 11.0 1.0 4.8%<br />
National Petrochemical SAR 20.40 (4.5) (4.0) (4.0) 36.6 22.8 13.4 NA NA<br />
Middle East & Africa (ex-<strong>Saudi</strong> Arabia)<br />
Industries Qatar QAR 115.30 4.4 1.5 4.2 13.8 122.0 94.5 4.0 3.5%<br />
Mesaieed Petrochem QAR 15.70 0.4 (0.6) 0.9 (8.8) 21.0 14.5 0.7 4.5%<br />
Sidi Kerir EGP 18.67 (6.3) 8.9 (6.3) 89.9 22.2 10.7 0.4 2.1%<br />
Al Qurain KWd 325.00 14.0 41.3 14.0 96.2 330.0 184.0 10.0 3.1%<br />
Sasol ZAr 37,936.00 (6.6) (5.3) (5.0) (7.7) 49,747.0 35,495.0 1,480.0 3.9%<br />
Europe<br />
BASF EUR 89.98 (1.5) 2.6 2.6 56.9 91.6 61.6 2.9 3.2%<br />
Solvay EUR 111.60 1.5 1.1 1.1 35.1 117.0 79.1 3.3 2.9%<br />
Lanxess EUR 65.80 (4.4) 5.3 5.3 75.1 68.8 37.3 0.6 0.9%<br />
Arkema EUR 92.81 0.1 (0.2) (0.2) 68.9 97.2 57.3 1.9 2.0%<br />
Yara NOK 320.90 (8.4) (5.9) (5.9) (0.5) 362.0 256.1 15.0 4.7%<br />
Akzo Nobel EUR 64.75 0.8 9.0 9.0 22.4 65.1 52.6 1.6 2.4%<br />
Clariant CHF 18.95 1.5 9.0 9.0 16.1 19.4 15.6 0.4 2.1%<br />
North America<br />
Eastman USD 81.47 3.5 7.9 7.9 30.4 82.1 62.7 1.9 2.3%<br />
Dow USD 63.46 4.4 10.5 10.5 35.2 64.4 47.5 1.8 2.9%<br />
Westlake USD 66.18 2.8 17.5 17.5 55.7 66.8 39.5 0.8 1.1%<br />
Celanese Corp USD 90.28 6.1 14.3 14.3 52.6 91.5 60.6 1.4 1.6%<br />
Methanex USD 52.00 1.9 16.7 16.7 69.5 53.4 26.8 1.1 2.1%<br />
LyondellBasell Industries USD 93.89 (2.2) 10.2 10.2 21.9 97.6 69.8 3.4 3.6%<br />
Huntsman Corp USD 23.03 10.8 20.2 20.2 119.1 23.4 11.1 0.5 2.2%<br />
Asia<br />
Indorama Ventures THB 36.00 1.4 9.1 9.1 70.4 37.8 22.1 0.5 1.5%<br />
Mitsui Chemicals JPY 576.00 7.3 9.1 9.1 59.3 599.0 320.0 9.0 1.6%<br />
Sumitomo JPY 634.00 3.8 14.6 14.6 31.8 658.0 396.0 13.0 2.1%<br />
Formosa Chemicals & Fibre Corp TWD 95.00 0.4 (1.3) (1.3) 32.7 100.0 75.0 3.5 3.7%<br />
Lotte Chemical Corp KRW 364,500.00 (3.2) (1.2) (1.2) 15.4 410,000.0 249,000.0 4,000.0 1.1%<br />
Formosa Plastics Corp TWD 91.00 2.7 2.0 2.0 20.6 98.1 75.0 3.6 4.0%<br />
LG Chem KRW 283,000.00 8.0 8.4 8.4 (3.9) 341,000.0 215,500.0 5,000.0 1.8%<br />
Indices<br />
S&P500 Chemical Index USD 550.70 2.5 7.9 7.9 23.0 552.2 449.3 12.0 2.2%<br />
MSCI World Chemical Index USD 299.84 1.0 6.4 6.4 24.4 298.7 245.0 6.8 2.3%<br />
TASI SAR 6,966.53 (1.8) (3.4) (3.4) 14.3 7,290.3 5,327.5 234.6 3.4%<br />
Source: Bloomberg, Al Rajhi Capital. * Last closing as of March 1, 2017. ** 1 Month represents the last month change.<br />
Disclosures Please refer to the important disclosures at the back of this report. 5
<strong>Saudi</strong> <strong>Petrochemicals</strong><br />
Sector<br />
<strong>Petrochemicals</strong> –Industrial<br />
02 March 2017<br />
IMPORTANT DISCLOSURES FOR U.S. PERSONS<br />
This research report was prepared by Al Rajhi Capital (Al Rajhi), a company authorized to engage in securities activities in <strong>Saudi</strong> Arabia. Al<br />
Rajhi is not a registered broker-dealer in the United States and, therefore, is not subject to U.S. rules regarding the preparation of research<br />
reports and the independence of research analysts. This research report is provided for distribution to “major U.S. institutional investors” in<br />
reliance on the exemption from registration provided by Rule 15a-6 of the U.S. Securities Exchange Act of 1934, as amended (the<br />
“Exchange Act”).<br />
Any U.S. recipient of this research report wishing to effect any transaction to buy or sell securities or related financial instruments based on<br />
the information provided in this research report should do so only through Rosenblatt Securities Inc, 40 Wall Street 59th Floor, New York<br />
NY 10005, a registered broker dealer in the United States. Under no circumstances should any recipient of this research report effect any<br />
transaction to buy or sell securities or related financial instruments through Al Rajhi. Rosenblatt Securities Inc. accepts responsibility for the<br />
contents of this research report, subject to the terms set out below, to the extent that it is delivered to a U.S. person other than a major U.S.<br />
institutional investor.<br />
The analyst whose name appears in this research report is not registered or qualified as a research analyst with the Financial Industry<br />
Regulatory Authority (“FINRA”) and may not be an associated person of Rosenblatt Securities Inc. and, therefore, may not be subject to<br />
applicable restrictions under FINRA Rules on communications with a subject company, public appearances and trading securities held by a<br />
research analyst account.<br />
Ownership and Material Conflicts of Interest<br />
Rosenblatt Securities Inc. or its affiliates does not ‘beneficially own,’ as determined in accordance with Section 13(d) of the Exchange Act,<br />
1% or more of any of the equity securities mentioned in the report. Rosenblatt Securities Inc, its affiliates and/or their respective officers,<br />
directors or employees may have interests, or long or short positions, and may at any time make purchases or sales as a principal or agent<br />
of the securities referred to herein. Rosenblatt Securities Inc. is not aware of any material conflict of interest as of the date of this<br />
publication.<br />
Compensation and Investment Banking Activities<br />
Rosenblatt Securities Inc. or any affiliate has not managed or co-managed a public offering of securities for the subject company in the past<br />
12 months, nor received compensation for investment banking services from the subject company in the past 12 months, neither does it or<br />
any affiliate expect to receive, or intends to seek compensation for investment banking services from the subject company in the next 3<br />
months.<br />
Additional Disclosures<br />
This research report is for distribution only under such circumstances as may be permitted by applicable law. This research report has no<br />
regard to the specific investment objectives, financial situation or particular needs of any specific recipient, even if sent only to a single<br />
recipient. This research report is not guaranteed to be a complete statement or summary of any securities, markets, reports or<br />
developments referred to in this research report. Neither Al Rajhi nor any of its directors, officers, employees or agents shall have any<br />
liability, however arising, for any error, inaccuracy or incompleteness of fact or opinion in this research report or lack of care in this research<br />
report’s preparation or publication, or any losses or damages which may arise from the use of this research report.<br />
Al Rajhi may rely on information barriers, such as “Chinese Walls” to control the flow of information within the areas, units, divisions, groups,<br />
or affiliates of Al Rajhi.<br />
Investing in any non-U.S. securities or related financial instruments (including ADRs) discussed in this research report may present certain<br />
risks. The securities of non-U.S. issuers may not be registered with, or be subject to the regulations of, the U.S. Securities and Exchange<br />
Commission. Information on such non-U.S. securities or related financial instruments may be limited. Foreign companies may not be<br />
subject to audit and reporting standards and regulatory requirements comparable to those in effect within the United States.<br />
The value of any investment or income from any securities or related financial instruments discussed in this research report denominated in<br />
a currency other than U.S. dollars is subject to exchange rate fluctuations that may have a positive or adverse effect on the value of or<br />
income from such securities or related financial instruments.<br />
Past performance is not necessarily a guide to future performance and no representation or warranty, express or implied, is made by Al<br />
Rajhi with respect to future performance. Income from investments may fluctuate. The price or value of the investments to which this<br />
research report relates, either directly or indirectly, may fall or rise against the interest of investors. Any recommendation or opinion<br />
contained in this research report may become outdated as a consequence of changes in the environment in which the issuer of the<br />
securities under analysis operates, in addition to changes in the estimates and forecasts, assumptions and valuation methodology used<br />
herein.<br />
No part of the content of this research report may be copied, forwarded or duplicated in any form or by any means without the prior consent<br />
of Al Rajhi and Al Rajhi accepts no liability whatsoever for the actions of third parties in this respect. This research document has been<br />
prepared by Al Rajhi Capital Company (“Al Rajhi Capital”) of Riyadh, <strong>Saudi</strong> Arabia. It has been prepared for the general use of Al Rajhi<br />
Capital’s clients and may not be redistributed, retransmitted or disclosed, in whole or in part, or in any form or manner, without the express<br />
written consent of Al Rajhi Capital. Receipt and review of this research document constitute your agreement not to redistribute, retransmit,<br />
or disclose to others the contents, opinions, conclusion, or information contained in this document prior to public disclosure of such<br />
information by Al Rajhi Capital. The information contained was obtained from various public sources believed to be reliable but we do not<br />
guarantee its accuracy. Al Rajhi Capital makes no representations or warranties (express or implied) regarding the data and information<br />
provided and Al Rajhi Capital does not represent that the information content of this document is complete, or free from any error, not<br />
misleading, or fit for any particular purpose. This research document provides general information only. Neither the information nor any<br />
opinion expressed constitutes an offer or an invitation to make an offer, to buy or sell any securities or other investment products related to<br />
such securities or investments. It is not intended to provide personal investment advice and it does not take into account the specific<br />
investment objectives, financial situation and the particular needs of any specific person who may receive this document.<br />
Investors should seek financial, legal or tax advice regarding the appropriateness of investing in any securities, other investment or<br />
investment strategies discussed or recommended in this document and should understand that statements regarding future prospects may<br />
not be realized. Investors should note that income from such securities or other investments, if any, may fluctuate and that the price or value<br />
of such securities and investments may rise or fall. Fluctuations in exchange rates could have adverse effects on the value of or price of, or<br />
income derived from, certain investments. Accordingly, investors may receive back less than originally invested. Al Rajhi Capital or its<br />
officers or one or more of its affiliates (including research analysts) may have a financial interest in securities of the issuer(s) or related<br />
investments, including long or short positions in securities, warrants, futures, options, derivatives, or other financial instruments. Al Rajhi<br />
Capital or its affiliates may from time to time perform investment banking or other services for, solicit investment banking or other business<br />
from, any company mentioned in this research document. Al Rajhi Capital, together with its affiliates and employees, shall not be liable for<br />
any direct, indirect or consequential loss or damages that may arise, directly or indirectly, from any use of the information contained in this<br />
research document.<br />
This research document and any recommendations contained are subject to change without prior notice. Al Rajhi Capital assumes no<br />
responsibility to update the information in this research document. Neither the whole nor any part of this research document may be altered,<br />
duplicated, transmitted or distributed in any form or by any means. This research document is not directed to, or intended for distribution to<br />
or use by, any person or entity who is a citizen or resident of or located in any locality, state, country or other jurisdiction where such<br />
distribution, publication, availability or use would be contrary to law or which would subject Al Rajhi Capital or any of its affiliates to any<br />
registration or licensing requirement within such jurisdiction.<br />
Disclosures Please refer to the important disclosures at the back of this report. 6
<strong>Saudi</strong> <strong>Petrochemicals</strong><br />
Sector<br />
<strong>Petrochemicals</strong> –Industrial<br />
02 March 2017<br />
Disclaimer and additional disclosures for Equity Research<br />
Disclaimer<br />
This research document has been prepared by Al Rajhi Capital Company (“Al Rajhi Capital”) of Riyadh, <strong>Saudi</strong> Arabia. It has been prepared<br />
for the general use of Al Rajhi Capital’s clients and may not be redistributed, retransmitted or disclosed, in whole or in part, or in any form or<br />
manner, without the express written consent of Al Rajhi Capital. Receipt and review of this research document constitute your agreement<br />
not to redistribute, retransmit, or disclose to others the contents, opinions, conclusion, or information contained in this document prior to<br />
public disclosure of such information by Al Rajhi Capital. The information contained was obtained from various public sources believed to be<br />
reliable but we do not guarantee its accuracy. Al Rajhi Capital makes no representations or warranties (express or implied) regarding the<br />
data and information provided and Al Rajhi Capital does not represent that the information content of this document is complete, or free<br />
from any error, not misleading, or fit for any particular purpose. This research document provides general information only. Neither the<br />
information nor any opinion expressed constitutes an offer or an invitation to make an offer, to buy or sell any securities or other investment<br />
products related to such securities or investments. It is not intended to provide personal investment advice and it does not take into account<br />
the specific investment objectives, financial situation and the particular needs of any specific person who may receive this document.<br />
Investors should seek financial, legal or tax advice regarding the appropriateness of investing in any securities, other investment or<br />
investment strategies discussed or recommended in this document and should understand that statements regarding future prospects may<br />
not be realized. Investors should note that income from such securities or other investments, if any, may fluctuate and that the price or value<br />
of such securities and investments may rise or fall. Fluctuations in exchange rates could have adverse effects on the value of or price of, or<br />
income derived from, certain investments. Accordingly, investors may receive back less than originally invested. Al Rajhi Capital or its<br />
officers or one or more of its affiliates (including research analysts) may have a financial interest in securities of the issuer(s) or related<br />
investments, including long or short positions in securities, warrants, futures, options, derivatives, or other financial instruments. Al Rajhi<br />
Capital or its affiliates may from time to time perform investment banking or other services for, solicit investment banking or other business<br />
from, any company mentioned in this research document. Al Rajhi Capital, together with its affiliates and employees, shall not be liable for<br />
any direct, indirect or consequential loss or damages that may arise, directly or indirectly, from any use of the information contained in this<br />
research document.<br />
This research document and any recommendations contained are subject to change without prior notice. Al Rajhi Capital assumes no<br />
responsibility to update the information in this research document. Neither the whole nor any part of this research document may be altered,<br />
duplicated, transmitted or distributed in any form or by any means. This research document is not directed to, or intended for distribution to<br />
or use by, any person or entity who is a citizen or resident of or located in any locality, state, country or other jurisdiction where such<br />
distribution, publication, availability or use would be contrary to law or which would subject Al Rajhi Capital or any of its affiliates to any<br />
registration or licensing requirement within such jurisdiction.<br />
Explanation of Al Rajhi Capital’s rating system<br />
Al Rajhi Capital uses a three-tier rating system based on absolute upside or downside potential for all stocks under its coverage except<br />
financial stocks and those few other companies not compliant with Islamic Shariah law:<br />
"Overweight": Our target price is more than 10% above the current share price, and we expect the share price to reach the target on a 12<br />
month time horizon.<br />
"Neutral": We expect the share price to settle at a level between 10% below the current share price and 10% above the current share price<br />
on a 12 month time horizon.<br />
"Underweight": Our target price is more than 10% below the current share price, and we expect the share price to reach the target on a 12<br />
month time horizon.<br />
"Target price": We estimate target value per share for every stock we cover. This is normally based on widely accepted methods<br />
appropriate to the stock or <strong>sector</strong> under consideration, e.g. DCF (discounted cash flow) or SoTP (sum of the parts) analysis.<br />
Please note that the achievement of any price target may be impeded by general market and economic trends and other external factors, or<br />
if a company’s profits or operating performance exceed or fall short of our expectations.<br />
Contact us<br />
Jithesh Gopi, CFA<br />
Head of Research and Financial Institutions<br />
Tel : +966 1 211 9332<br />
Email: gopij@alrajhi-capital.com<br />
Al Rajhi Capital<br />
Research Department<br />
Head Office, King Fahad Road<br />
P.O. Box 5561, Riyadh 11432<br />
Kingdom of <strong>Saudi</strong> Arabia<br />
Email: research@alrajhi-capital.com<br />
Al Rajhi Capital is licensed by the <strong>Saudi</strong> Arabian Capital Market Authority, License No. 07068/37.<br />
Disclosures Please refer to the important disclosures at the back of this report. 7