- Page 1:
Dynamic Tailoring and Tuning for Sp
- Page 4 and 5:
Acknowledgments This work was suppo
- Page 6 and 7:
3.2 RPT Formulation . . . . . . . .
- Page 9 and 10:
List of Figures 1-1 Timeline of Ori
- Page 11 and 12:
List of Tables 1.1 Effect of simula
- Page 13 and 14:
Nomenclature Abbreviations ACS atti
- Page 15:
dk optimization search direction f
- Page 18 and 19:
1.1 Space-Based Interferometry NASA
- Page 20 and 21:
unfettered by the Earth’s atmosph
- Page 22 and 23:
the SCI, both the size and flexibil
- Page 24 and 25:
maybethatitbecomescertain that the
- Page 26 and 27:
Table 1.1: Effect of simulation res
- Page 28 and 29:
Table 1.2: Effect of simulation res
- Page 30 and 31:
has been found that structural desi
- Page 32 and 33:
precision telescope structure for m
- Page 34 and 35:
attractive, and more conservative a
- Page 36 and 37:
to solve the performance tailoring
- Page 39 and 40:
Chapter 2 Performance Tailoring A c
- Page 41 and 42:
ometer (SCI). In the following sect
- Page 43 and 44:
The equations of motion of the unda
- Page 45 and 46:
The frequency response functions fr
- Page 47 and 48:
the output covariance matrix, Σz,
- Page 49 and 50:
where the subscript indicates the i
- Page 51 and 52:
2.3.3 Design Variables The choice o
- Page 53 and 54:
and then, by inspection, the inerti
- Page 55 and 56:
algorithms begin at an initial gues
- Page 57 and 58:
at least locally optimal, and the s
- Page 59 and 60:
initial design variable state, x =
- Page 61 and 62:
and the RMS OPD is computed using E
- Page 63 and 64:
# Designs 25 20 15 10 5 Accepted, b
- Page 65 and 66:
does not provide information on why
- Page 67 and 68:
energy is distributed almost evenly
- Page 69 and 70:
also symmetric as seen in the figur
- Page 71 and 72:
Chapter 3 Robust Performance Tailor
- Page 73 and 74:
through careful and experienced mod
- Page 75 and 76:
described above. However, one can r
- Page 77 and 78:
ic, σz(�x, �p), that is depend
- Page 79 and 80:
Magnitude, OPD/F x [µm/N] Magnitud
- Page 81 and 82:
% Energy 100 90 80 70 60 50 40 30 2
- Page 83 and 84:
metric to the cost function. Note,
- Page 85 and 86:
tion: ∂hi (z,�x, �pi) ∂�x
- Page 87 and 88:
values are chosen from their statis
- Page 89 and 90:
Table 3.3: Algorithm performance: a
- Page 91 and 92:
Statistical Robustness The statisti
- Page 93 and 94:
Performance [µm] 1400 1200 1000 80
- Page 95 and 96:
(Figure 3-6(b)). The nominal perfor
- Page 97 and 98:
Norm. Cum. Var. [µm 2 ] PSD [µm 2
- Page 99 and 100:
energy by mode for easy comparison.
- Page 101 and 102:
Y−coordinate [m] Y−coordinate [
- Page 103 and 104:
RMS performance, [µm] 400 350 300
- Page 105 and 106:
The requirement chosen here is some
- Page 107 and 108:
Chapter 4 Dynamic Tuning Robust Per
- Page 109 and 110:
on a physical truss. Since tailorin
- Page 111 and 112:
Table 4.1: Tuning parameters for SC
- Page 113 and 114:
m 2 [kg] J ∗ # # time y ∗ [kg]
- Page 115 and 116:
m 2 [kg] 800 700 600 500 400 300 20
- Page 117 and 118:
configuration than the untuned, but
- Page 119 and 120:
Norm. Cum. Var. [µm 2 ] PSD [µm 2
- Page 121 and 122:
Performance Requirement [µm] 400 3
- Page 123 and 124:
is considered. 4.2.1 Hardware-only
- Page 125 and 126:
and added to the objective function
- Page 127 and 128:
using either a decreasing step-size
- Page 129 and 130:
for tailoring, but tuning parameter
- Page 131 and 132:
tained by randomly choosing paramet
- Page 133 and 134:
p [GPa] y ∗ [kg] Performance [µm
- Page 135 and 136:
# Func. Evals Performance RMS (µm)
- Page 137 and 138:
tion changes in the updated solutio
- Page 139 and 140:
Data: initial iterate, p0, performa
- Page 141 and 142:
the new tuning configuration is ver
- Page 143 and 144: Performing an AO tuning optimizatio
- Page 145 and 146: Uncertainty Bounds Test �y [kg] S
- Page 147 and 148: Table 4.6: Tuning results on fifty
- Page 149 and 150: eters are discussed. The optimizati
- Page 151 and 152: Chapter 5 Robust Performance Tailor
- Page 153 and 154: MPC optimization by allowing a diff
- Page 155 and 156: where the notation yij indicates th
- Page 157 and 158: (Table 4.1), and the uncertainty pa
- Page 159 and 160: Table 5.2: Performance and design p
- Page 161 and 162: it in the worst-case uncertainty re
- Page 163 and 164: The data in Figure 5-2 indicate tha
- Page 165 and 166: configuration. The tuned configurat
- Page 167 and 168: same requirement. The effect become
- Page 169 and 170: indicating that this requirement is
- Page 171 and 172: E 2 [Pa] 7.8 7.6 7.4 7.2 7 6.8 6.6
- Page 173 and 174: than the RPT design, 155.45µm to 5
- Page 175 and 176: have a very small nominal performan
- Page 177 and 178: of these simulations fail to meet r
- Page 179 and 180: and that it is the only design meth
- Page 181 and 182: Chapter 6 Focus Application: Struct
- Page 183 and 184: optical path differences between th
- Page 185 and 186: Table 6.1: RWA disturbance model pa
- Page 187 and 188: FRF Magnitude 10 1 10 0 10 −1 10
- Page 189 and 190: Y Z Z X Y (a) w (c) w Y h Z Figure
- Page 191 and 192: Table 6.6: Primary mirror propertie
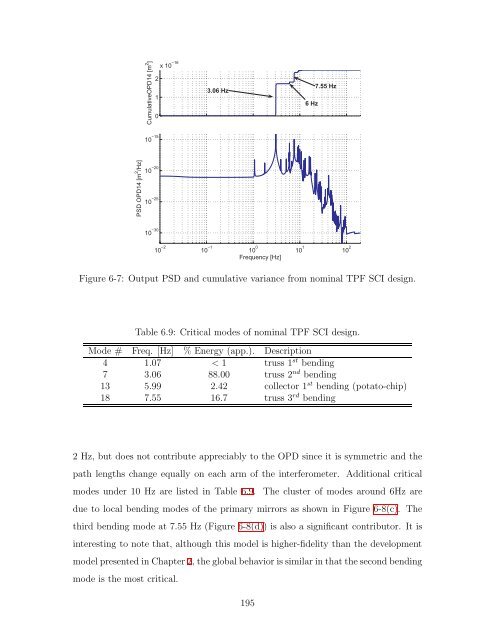
- Page 193: OP1 STAR Z OP2 OP3 Coll 1 Coll 2 Bu
- Page 197 and 198: 6.2 Design Parameters In order to a
- Page 199 and 200: 6.2.2 Tuning The tuning parameters
- Page 201 and 202: complex and the normal modes analys
- Page 203 and 204: does not change with the design par
- Page 205 and 206: (a) (b) (c) Figure 6-11: SCI TPF PT
- Page 207 and 208: Table 6.14: Performance predictions
- Page 209 and 210: performance trends similar to those
- Page 211 and 212: Chapter 7 Conclusions and Recommend
- Page 213 and 214: a statistical robustness measure su
- Page 215 and 216: and the worst-case performance is a
- Page 217 and 218: - Consider uncertainty analysis too
- Page 219 and 220: Appendix A Gradient-Based Optimizat
- Page 221 and 222: such that the gradient direction is
- Page 223 and 224: the descent direction. In some case
- Page 225 and 226: Bibliography [1] Jpl planet quest w
- Page 227 and 228: [24] Nightsky Systems Carl Blaurock
- Page 229 and 230: [48] S. C. O. Grocott, J. P. How, a
- Page 231 and 232: [74] M. Lieber. Development of ball
- Page 233 and 234: AIAA/ASME/ASCE/AHS/ASC Structures,