Chapter 5 Robust Performance Tailoring with Tuning - SSL - MIT
Chapter 5 Robust Performance Tailoring with Tuning - SSL - MIT Chapter 5 Robust Performance Tailoring with Tuning - SSL - MIT
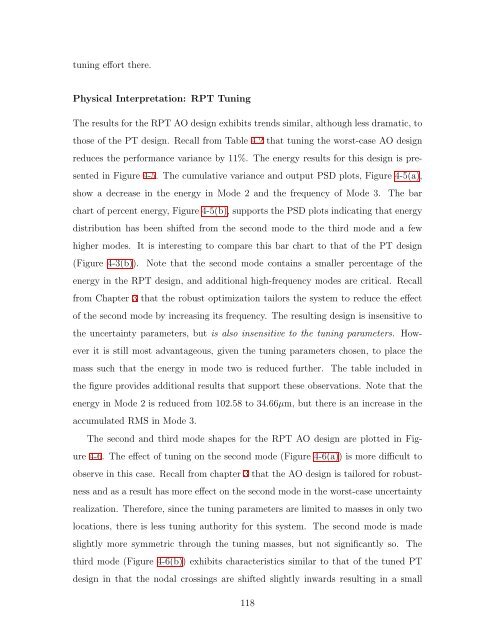
tuning effort there. Physical Interpretation: RPT Tuning The results for the RPT AO design exhibits trends similar, although less dramatic, to those of the PT design. Recall from Table 4.2 that tuning the worst-case AO design reduces the performance variance by 11%. The energy results for this design is pre- sented in Figure 4-5. The cumulative variance and output PSD plots, Figure 4-5(a), show a decrease in the energy in Mode 2 and the frequency of Mode 3. The bar chart of percent energy, Figure 4-5(b), supports the PSD plots indicating that energy distribution has been shifted from the second mode to the third mode and a few higher modes. It is interesting to compare this bar chart to that of the PT design (Figure 4-3(b)). Note that the second mode contains a smaller percentage of the energy in the RPT design, and additional high-frequency modes are critical. Recall from Chapter 3 that the robust optimization tailors the system to reduce the effect of the second mode by increasing its frequency. The resulting design is insensitive to the uncertainty parameters, but is also insensitive to the tuning parameters. How- ever it is still most advantageous, given the tuning parameters chosen, to place the mass such that the energy in mode two is reduced further. The table included in the figure provides additional results that support these observations. Note that the energy in Mode 2 is reduced from 102.58 to 34.66µm, but there is an increase in the accumulated RMS in Mode 3. The second and third mode shapes for the RPT AO design are plotted in Fig- ure 4-6. The effect of tuning on the second mode (Figure 4-6(a)) is more difficult to observe in this case. Recall from chapter 3 that the AO design is tailored for robust- ness and as a result has more effect on the second mode in the worst-case uncertainty realization. Therefore, since the tuning parameters are limited to masses in only two locations, there is less tuning authority for this system. The second mode is made slightly more symmetric through the tuning masses, but not significantly so. The third mode (Figure 4-6(b)) exhibits characteristics similar to that of the tuned PT design in that the nodal crossings are shifted slightly inwards resulting in a small 118
Norm. Cum. Var. [µm 2 ] PSD [µm 2 /Hz] 1 0.5 10 5 10 0 0 10 −5 10 −2 10 0 Frequency [Hz] (a) 10 2 not tuned tuned % Energy 60 50 40 30 20 10 0 not tuned tuned 1 2 3 4 5 7 Mode # Not tuned Tuned Mode fn energy σ 2 z σz fn energy σ 2 z σz # (Hz) % (µm 2 ) (µm) (Hz) % (µm 2 ) (µm) 1 0.043 13.70 12902 42.04 0.043 17.64 13179 48.22 2 0.073 33.43 31478 102.58 0.072 12.68 9474 34.66 3 0.487 46.63 43906 143.08 0.336 57.43 42907 156.98 4 0.599 0.19 175 0.57 0.578 5.64 4217 15.43 5 1.808 3.85 3625 11.81 1.754 3.57 2670 9.77 7 4.300 1.34 1315 4.29 3.864 1.69 1265 4.62 Total: 99.14 93401 304.37 98.65 73712 269.68 (c) Figure 4-5: Modal energy breakdown for worst-case RPT AO design (a) output PSDs (b) % energy comparison: not tuned (blue), tuned (green) (c) results table. 119 (b)
- Page 67 and 68: energy is distributed almost evenly
- Page 69 and 70: also symmetric as seen in the figur
- Page 71 and 72: Chapter 3 Robust Performance Tailor
- Page 73 and 74: through careful and experienced mod
- Page 75 and 76: described above. However, one can r
- Page 77 and 78: ic, σz(�x, �p), that is depend
- Page 79 and 80: Magnitude, OPD/F x [µm/N] Magnitud
- Page 81 and 82: % Energy 100 90 80 70 60 50 40 30 2
- Page 83 and 84: metric to the cost function. Note,
- Page 85 and 86: tion: ∂hi (z,�x, �pi) ∂�x
- Page 87 and 88: values are chosen from their statis
- Page 89 and 90: Table 3.3: Algorithm performance: a
- Page 91 and 92: Statistical Robustness The statisti
- Page 93 and 94: Performance [µm] 1400 1200 1000 80
- Page 95 and 96: (Figure 3-6(b)). The nominal perfor
- Page 97 and 98: Norm. Cum. Var. [µm 2 ] PSD [µm 2
- Page 99 and 100: energy by mode for easy comparison.
- Page 101 and 102: Y−coordinate [m] Y−coordinate [
- Page 103 and 104: RMS performance, [µm] 400 350 300
- Page 105 and 106: The requirement chosen here is some
- Page 107 and 108: Chapter 4 Dynamic Tuning Robust Per
- Page 109 and 110: on a physical truss. Since tailorin
- Page 111 and 112: Table 4.1: Tuning parameters for SC
- Page 113 and 114: m 2 [kg] J ∗ # # time y ∗ [kg]
- Page 115 and 116: m 2 [kg] 800 700 600 500 400 300 20
- Page 117: configuration than the untuned, but
- Page 121 and 122: Performance Requirement [µm] 400 3
- Page 123 and 124: is considered. 4.2.1 Hardware-only
- Page 125 and 126: and added to the objective function
- Page 127 and 128: using either a decreasing step-size
- Page 129 and 130: for tailoring, but tuning parameter
- Page 131 and 132: tained by randomly choosing paramet
- Page 133 and 134: p [GPa] y ∗ [kg] Performance [µm
- Page 135 and 136: # Func. Evals Performance RMS (µm)
- Page 137 and 138: tion changes in the updated solutio
- Page 139 and 140: Data: initial iterate, p0, performa
- Page 141 and 142: the new tuning configuration is ver
- Page 143 and 144: Performing an AO tuning optimizatio
- Page 145 and 146: Uncertainty Bounds Test �y [kg] S
- Page 147 and 148: Table 4.6: Tuning results on fifty
- Page 149 and 150: eters are discussed. The optimizati
- Page 151 and 152: Chapter 5 Robust Performance Tailor
- Page 153 and 154: MPC optimization by allowing a diff
- Page 155 and 156: where the notation yij indicates th
- Page 157 and 158: (Table 4.1), and the uncertainty pa
- Page 159 and 160: Table 5.2: Performance and design p
- Page 161 and 162: it in the worst-case uncertainty re
- Page 163 and 164: The data in Figure 5-2 indicate tha
- Page 165 and 166: configuration. The tuned configurat
- Page 167 and 168: same requirement. The effect become
tuning effort there.<br />
Physical Interpretation: RPT <strong>Tuning</strong><br />
The results for the RPT AO design exhibits trends similar, although less dramatic, to<br />
those of the PT design. Recall from Table 4.2 that tuning the worst-case AO design<br />
reduces the performance variance by 11%. The energy results for this design is pre-<br />
sented in Figure 4-5. The cumulative variance and output PSD plots, Figure 4-5(a),<br />
show a decrease in the energy in Mode 2 and the frequency of Mode 3. The bar<br />
chart of percent energy, Figure 4-5(b), supports the PSD plots indicating that energy<br />
distribution has been shifted from the second mode to the third mode and a few<br />
higher modes. It is interesting to compare this bar chart to that of the PT design<br />
(Figure 4-3(b)). Note that the second mode contains a smaller percentage of the<br />
energy in the RPT design, and additional high-frequency modes are critical. Recall<br />
from <strong>Chapter</strong> 3 that the robust optimization tailors the system to reduce the effect<br />
of the second mode by increasing its frequency. The resulting design is insensitive to<br />
the uncertainty parameters, but is also insensitive to the tuning parameters. How-<br />
ever it is still most advantageous, given the tuning parameters chosen, to place the<br />
mass such that the energy in mode two is reduced further. The table included in<br />
the figure provides additional results that support these observations. Note that the<br />
energy in Mode 2 is reduced from 102.58 to 34.66µm, but there is an increase in the<br />
accumulated RMS in Mode 3.<br />
The second and third mode shapes for the RPT AO design are plotted in Fig-<br />
ure 4-6. The effect of tuning on the second mode (Figure 4-6(a)) is more difficult to<br />
observe in this case. Recall from chapter 3 that the AO design is tailored for robust-<br />
ness and as a result has more effect on the second mode in the worst-case uncertainty<br />
realization. Therefore, since the tuning parameters are limited to masses in only two<br />
locations, there is less tuning authority for this system. The second mode is made<br />
slightly more symmetric through the tuning masses, but not significantly so. The<br />
third mode (Figure 4-6(b)) exhibits characteristics similar to that of the tuned PT<br />
design in that the nodal crossings are shifted slightly inwards resulting in a small<br />
118


