Chapter 5 Robust Performance Tailoring with Tuning - SSL - MIT
Chapter 5 Robust Performance Tailoring with Tuning - SSL - MIT
Chapter 5 Robust Performance Tailoring with Tuning - SSL - MIT

You also want an ePaper? Increase the reach of your titles
YUMPU automatically turns print PDFs into web optimized ePapers that Google loves.
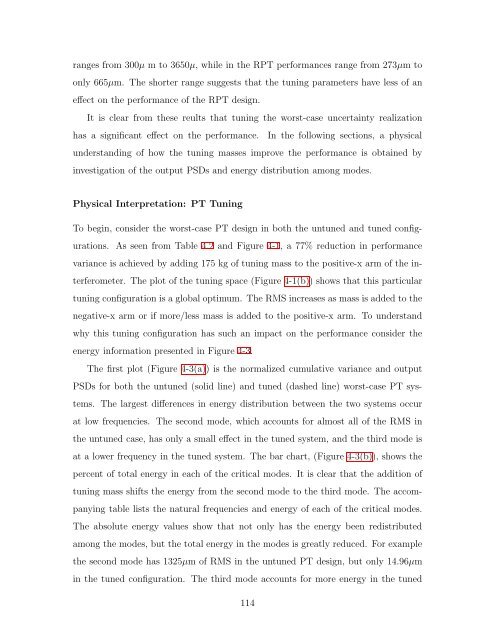
anges from 300µ m to 3650µ, while in the RPT performances range from 273µm to<br />
only 665µm. The shorter range suggests that the tuning parameters have less of an<br />
effect on the performance of the RPT design.<br />
It is clear from these reults that tuning the worst-case uncertainty realization<br />
has a significant effect on the performance. In the following sections, a physical<br />
understanding of how the tuning masses improve the performance is obtained by<br />
investigation of the output PSDs and energy distribution among modes.<br />
Physical Interpretation: PT <strong>Tuning</strong><br />
To begin, consider the worst-case PT design in both the untuned and tuned config-<br />
urations. As seen from Table 4.2 and Figure 4-1, a 77% reduction in performance<br />
variance is achieved by adding 175 kg of tuning mass to the positive-x arm of the in-<br />
terferometer. The plot of the tuning space (Figure 4-1(b)) shows that this particular<br />
tuning configuration is a global optimum. The RMS increases as mass is added to the<br />
negative-x arm or if more/less mass is added to the positive-x arm. To understand<br />
why this tuning configuration has such an impact on the performance consider the<br />
energy information presented in Figure 4-3.<br />
The first plot (Figure 4-3(a)) is the normalized cumulative variance and output<br />
PSDs for both the untuned (solid line) and tuned (dashed line) worst-case PT sys-<br />
tems. The largest differences in energy distribution between the two systems occur<br />
at low frequencies. The second mode, which accounts for almost all of the RMS in<br />
the untuned case, has only a small effect in the tuned system, and the third mode is<br />
at a lower frequency in the tuned system. The bar chart, (Figure 4-3(b)), shows the<br />
percent of total energy in each of the critical modes. It is clear that the addition of<br />
tuning mass shifts the energy from the second mode to the third mode. The accom-<br />
panying table lists the natural frequencies and energy of each of the critical modes.<br />
The absolute energy values show that not only has the energy been redistributed<br />
among the modes, but the total energy in the modes is greatly reduced. For example<br />
the second mode has 1325µm of RMS in the untuned PT design, but only 14.96µm<br />
in the tuned configuration. The third mode accounts for more energy in the tuned<br />
114