

SPA 3e_ Teachers Edition _ Ch 6

You also want an ePaper? Increase the reach of your titles
YUMPU automatically turns print PDFs into web optimized ePapers that Google loves.
L E S S O N 6.2 • Sampling Distributions: Center and Variability 415<br />
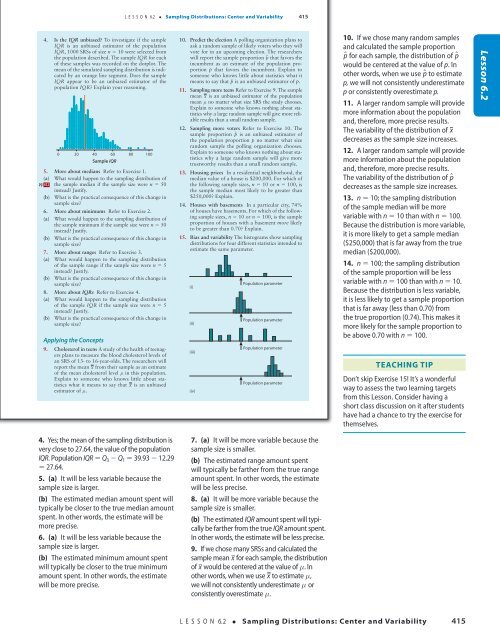
4. Is the IQR unbiased? To investigate if the sample<br />
IQR is an unbiased estimator of the population<br />
IQR, 1000 SRSs of size n 5 10 were selected from<br />
the population described. The sample IQR for each<br />
of these samples was recorded on the dotplot. The<br />
mean of the simulated sampling distribution is indicated<br />
by an orange line segment. Does the sample<br />
IQR appear to be an unbiased estimator of the<br />
population IQR? Explain your reasoning.<br />
dd<br />
0<br />
d<br />
d<br />
d<br />
d<br />
d<br />
d<br />
20<br />
d<br />
d<br />
d<br />
d<br />
d<br />
dd<br />
d<br />
d<br />
d d<br />
d<br />
40 60<br />
Sample IQR<br />
d d d<br />
d<br />
d<br />
d d dd d d<br />
80<br />
100<br />
5. More about medians Refer to Exercise 1.<br />
(a) What would happen to the sampling distribution of<br />
pg 412 the sample median if the sample size were n 5 50<br />
instead? Justify.<br />
(b) What is the practical consequence of this change in<br />
sample size?<br />
6. More about minimums Refer to Exercise 2.<br />
(a) What would happen to the sampling distribution of<br />
the sample minimum if the sample size were n 5 50<br />
instead? Justify.<br />
(b) What is the practical consequence of this change in<br />
sample size?<br />
7. More about ranges Refer to Exercise 3.<br />
(a) What would happen to the sampling distribution<br />
of the sample range if the sample size were n 5 5<br />
instead? Justify.<br />
(b) What is the practical consequence of this change in<br />
sample size?<br />
8. More about IQRs Refer to Exercise 4.<br />
(a) What would happen to the sampling distribution<br />
of the sample IQR if the sample size were n 5 5<br />
instead? Justify.<br />
(b) What is the practical consequence of this change in<br />
sample size?<br />
Applying the Concepts<br />
9. <strong>Ch</strong>olesterol in teens A study of the health of teenagers<br />
plans to measure the blood cholesterol levels of<br />
an SRS of 13- to 16-year-olds. The researchers will<br />
report the mean x from their sample as an estimate<br />
of the mean cholesterol level m in this population.<br />
Explain to someone who knows little about statistics<br />
what it means to say that x is an unbiased<br />
estimator of m.<br />
10. Predict the election A polling organization plans to<br />
ask a random sample of likely voters who they will<br />
vote for in an upcoming election. The researchers<br />
will report the sample proportion p^ that favors the<br />
incumbent as an estimate of the population proportion<br />
p that favors the incumbent. Explain to<br />
someone who knows little about statistics what it<br />
means to say that p^ is an unbiased estimator of p.<br />
11. Sampling more teens Refer to Exercise 9. The sample<br />
mean x is an unbiased estimator of the population<br />
mean m no matter what size SRS the study chooses.<br />
Explain to someone who knows nothing about statistics<br />
why a large random sample will give more reliable<br />
results than a small random sample.<br />
12. Sampling more voters Refer to Exercise 10. The<br />
sample proportion p^ is an unbiased estimator of<br />
the population proportion p no matter what size<br />
random sample the polling organization chooses.<br />
Explain to someone who knows nothing about statistics<br />
why a large random sample will give more<br />
trustworthy results than a small random sample.<br />
13. Housing prices In a residential neighborhood, the<br />
median value of a house is $200,000. For which of<br />
the following sample sizes, n 5 10 or n 5 100, is<br />
the sample median most likely to be greater than<br />
$250,000? Explain.<br />
14. Houses with basements In a particular city, 74%<br />
of houses have basements. For which of the following<br />
sample sizes, n 5 10 or n 5 100, is the sample<br />
proportion of houses with a basement more likely<br />
to be greater than 0.70? Explain.<br />
15. Bias and variability The histograms show sampling<br />
distributions for four different statistics intended to<br />
estimate the same parameter.<br />
(i)<br />
(ii)<br />
(iii)<br />
(iv)<br />
Population parameter<br />
Population parameter<br />
Population parameter<br />
Population parameter<br />
10. If we chose many random samples<br />
and calculated the sample proportion<br />
p^ for each sample, the distribution of p^<br />
would be centered at the value of p. In<br />
other words, when we use p^ to estimate<br />
p, we will not consistently underestimate<br />
p or consistently overestimate p.<br />
11. A larger random sample will provide<br />
more information about the population<br />
and, therefore, more precise results.<br />
The variability of the distribution of x<br />
decreases as the sample size increases.<br />
12. A larger random sample will provide<br />
more information about the population<br />
and, therefore, more precise results.<br />
The variability of the distribution of p^<br />
decreases as the sample size increases.<br />
13. n 5 10; the sampling distribution<br />
of the sample median will be more<br />
variable with n 5 10 than with n 5 100.<br />
Because the distribution is more variable,<br />
it is more likely to get a sample median<br />
($250,000) that is far away from the true<br />
median ($200,000).<br />
14. n 5 100; the sampling distribution<br />
of the sample proportion will be less<br />
variable with n 5 100 than with n 5 10.<br />
Because the distribution is less variable,<br />
it is less likely to get a sample proportion<br />
that is far away (less than 0.70) from<br />
the true proportion (0.74). This makes it<br />
more likely for the sample proportion to<br />
be above 0.70 with n 5 100.<br />
Teaching Tip<br />
Don’t skip Exercise 15! It’s a wonderful<br />
way to assess the two learning targets<br />
from this Lesson. Consider having a<br />
short class discussion on it after students<br />
have had a chance to try the exercise for<br />
themselves.<br />
Lesson 6.2<br />
18/08/16 5:00 PMStarnes_<strong>3e</strong>_CH06_398-449_Final.indd 415<br />
4. Yes; the mean of the sampling distribution is<br />
very close to 27.64, the value of the population<br />
IQR. Population IQR 5 Q 3 2 Q 1 5 39.93 2 12.29<br />
5 27.64.<br />
5. (a) It will be less variable because the<br />
sample size is larger.<br />
(b) The estimated median amount spent will<br />
typically be closer to the true median amount<br />
spent. In other words, the estimate will be<br />
more precise.<br />
6. (a) It will be less variable because the<br />
sample size is larger.<br />
(b) The estimated minimum amount spent<br />
will typically be closer to the true minimum<br />
amount spent. In other words, the estimate<br />
will be more precise.<br />
18/08/16 5:00 PM<br />
7. (a) It will be more variable because the<br />
sample size is smaller.<br />
(b) The estimated range amount spent<br />
will typically be farther from the true range<br />
amount spent. In other words, the estimate<br />
will be less precise.<br />
8. (a) It will be more variable because the<br />
sample size is smaller.<br />
(b) The estimated IQR amount spent will typically<br />
be farther from the true IQR amount spent.<br />
In other words, the estimate will be less precise.<br />
9. If we chose many SRSs and calculated the<br />
sample mean x for each sample, the distribution<br />
of x would be centered at the value of m. In<br />
other words, when we use x to estimate m,<br />
we will not consistently underestimate m or<br />
consistently overestimate m.<br />
L E S S O N 6.2 • Sampling Distributions: Center and Variability 415<br />
Starnes_<strong>3e</strong>_ATE_CH06_398-449_v3.indd 415<br />
11/01/17 3:54 PM

