

SPA 3e_ Teachers Edition _ Ch 6

You also want an ePaper? Increase the reach of your titles
YUMPU automatically turns print PDFs into web optimized ePapers that Google loves.
L E S S O N 6.1 • What Is a Sampling Distribution? 401<br />
Parameters and Statistics<br />
For the sample of college graduates contacted by the CPS, the mean income was<br />
x 5 $69,609. The number $69,609 is a statistic because it describes this one sample.<br />
The population that the researchers want to draw conclusions about is all U.S. college<br />
graduates. In this case, the parameter of interest is the mean income m of the population<br />
of all college graduates.<br />
DEFINITION Statistic, Parameter<br />
A statistic is a number that describes some characteristic of a sample.<br />
A parameter is a number that describes some characteristic of the population.<br />
Because we can’t examine the entire population, the value of a parameter is usually<br />
unknown. To estimate the value of the parameter, we use a statistic calculated using<br />
data from a random sample of the population.<br />
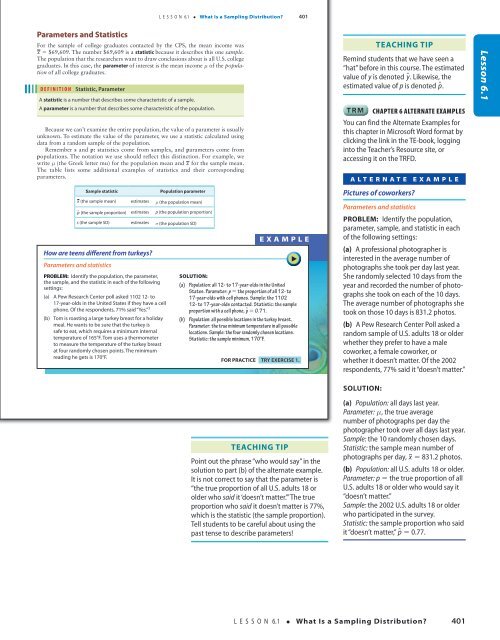
Remember s and p: statistics come from samples, and parameters come from<br />
populations. The notation we use should reflect this distinction. For example, we<br />
write m (the Greek letter mu) for the population mean and x for the sample mean.<br />
The table lists some additional examples of statistics and their corresponding<br />
parameters.<br />
Teaching Tip<br />
Remind students that we have seen a<br />
“hat” before in this course. The estimated<br />
value of y is denoted y^ . Likewise, the<br />
estimated value of p is denoted p^ .<br />
TRM chapter 6 Alternate Examples<br />
You can find the Alternate Examples for<br />
this chapter in Microsoft Word format by<br />
clicking the link in the TE-book, logging<br />
into the Teacher’s Resource site, or<br />
accessing it on the TRFD.<br />
Alternate Example<br />
Lesson 6.1<br />
Sample statistic<br />
Population parameter<br />
x (the sample mean) estimates m (the population mean)<br />
p^ (the sample proportion) estimates p (the population proportion)<br />
s (the sample SD) estimates s (the population SD)<br />
How are teens different from turkeys?<br />
Parameters and statistics<br />
PROBLEM: Identify the population, the parameter,<br />
the sample, and the statistic in each of the following<br />
settings:<br />
(a) A Pew Research Center poll asked 1102 12- to<br />
17-year-olds in the United States if they have a cell<br />
phone. Of the respondents, 71% said “Yes.” 3<br />
(b) Tom is roasting a large turkey breast for a holiday<br />
meal. He wants to be sure that the turkey is<br />
safe to eat, which requires a minimum internal<br />
temperature of 165°F. Tom uses a thermometer<br />
to measure the temperature of the turkey breast<br />
at four randomly chosen points. The minimum<br />
reading he gets is 170°F.<br />
e XAMPLe<br />
SOLUTION:<br />
(a) Population: all 12- to 17-year-olds in the United<br />
States. Parameter: p 5 the proportion of all 12- to<br />
17-year-olds with cell phones. Sample: the 1102<br />
12- to 17-year-olds contacted. Statistic: the sample<br />
proportion with a cell phone, p^ 5 0.71.<br />
(b) Population: all possible locations in the turkey breast.<br />
Parameter: the true minimum temperature in all possible<br />
locations. Sample: the four randomly chosen locations.<br />
Statistic: the sample minimum, 170°F.<br />
FOR PRACTICE TRY EXERCISE 1.<br />
Pictures of coworkers?<br />
Parameters and statistics<br />
PROBLEM: Identify the population,<br />
parameter, sample, and statistic in each<br />
of the following settings:<br />
(a) A professional photographer is<br />
interested in the average number of<br />
photographs she took per day last year.<br />
She randomly selected 10 days from the<br />
year and recorded the number of photographs<br />
she took on each of the 10 days.<br />
The average number of photographs she<br />
took on those 10 days is 831.2 photos.<br />
(b) A Pew Research Center Poll asked a<br />
random sample of U.S. adults 18 or older<br />
whether they prefer to have a male<br />
coworker, a female coworker, or<br />
whether it doesn’t matter. Of the 2002<br />
respondents, 77% said it “doesn’t matter.”<br />
SOLUTION:<br />
18/08/16 4:57 PMStarnes_<strong>3e</strong>_CH06_398-449_Final.indd 401<br />
Teaching Tip<br />
18/08/16 4:58 PM<br />
Point out the phrase “who would say” in the<br />
solution to part (b) of the alternate example.<br />
It is not correct to say that the parameter is<br />
“the true proportion of all U.S. adults 18 or<br />
older who said it ‘doesn’t matter.’” The true<br />
proportion who said it doesn’t matter is 77%,<br />
which is the statistic (the sample proportion).<br />
Tell students to be careful about using the<br />
past tense to describe parameters!<br />
(a) Population: all days last year.<br />
Parameter: m, the true average<br />
number of photographs per day the<br />
photographer took over all days last year.<br />
Sample: the 10 randomly chosen days.<br />
Statistic: the sample mean number of<br />
photographs per day, x 5 831.2 photos.<br />
(b) Population: all U.S. adults 18 or older.<br />
Parameter: p 5 the true proportion of all<br />
U.S. adults 18 or older who would say it<br />
“doesn’t matter.”<br />
Sample: the 2002 U.S. adults 18 or older<br />
who participated in the survey.<br />
Statistic: the sample proportion who said<br />
it “doesn’t matter,” p^ 5 0.77.<br />
L E S S O N 6.1 • What Is a Sampling Distribution? 401<br />
Starnes_<strong>3e</strong>_ATE_CH06_398-449_v3.indd 401<br />
11/01/17 3:53 PM

