Executive Summary
2017_executive_summary
2017_executive_summary

You also want an ePaper? Increase the reach of your titles
YUMPU automatically turns print PDFs into web optimized ePapers that Google loves.
1<br />
2<br />
3<br />
4<br />
5<br />
guidelines, it is also useful to characterize emissions according to commonly used economic sector categories:<br />
residential, commercial, industry, transportation, electricity generation, agriculture, and U.S. Territories.<br />
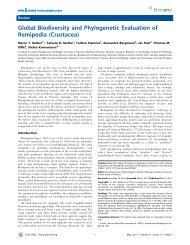
Table ES-6 summarizes emissions from each of these economic sectors, and Figure ES-13 shows the trend in<br />
emissions by sector from 1990 to 2015.<br />
Figure ES-13: U.S. Greenhouse Gas Emissions Allocated to Economic Sectors (MMT CO2 Eq.)<br />
6<br />
7<br />
8<br />
Table ES-6: U.S. Greenhouse Gas Emissions Allocated to Economic Sectors (MMT CO2 Eq.)<br />
Economic Sectors 1990 2005 2011 2012 2013 2014 2015<br />
Electric 1,864.8 Power Industry 1,862.5 2,441.6 2,197.3 2,059.9 2,078.2 2,079.7 1,941.2<br />
Transportation 1,551.3 2,001.0 1,800.0 1,780.7 1,790.2 1,803.4 1,803.7<br />
1,551.3<br />
Industry 1,629.5 1,469.3 1,378.5 1,365.2 1,412.8 1,426.0 1,436.7<br />
Agriculture 1,620.9<br />
526.7 574.3 592.0 577.6 567.5 566.1 570.3<br />
Commercial 563.4<br />
418.1 400.7 406.5 387.3 410.1 422.2 416.7<br />
Residential 418.1<br />
344.9 370.4 356.3 318.4 372.6 394.0 372.7<br />
U.S. Territories 33.7 58.2 45.4 47.6 47.5 44.9 44.9<br />
344.9<br />
Total Emissions 6,366.7 7,315.6 6,776.0 6,536.8 6,678.9 6,736.3 6,586.2<br />
33.7<br />
LULUCF Sector Net Total a,b (449.1) (315.3) (375.1) (387.7) (370.4) (368.8) (366.4)<br />
Net Emissions (Sources and Sinks) 5,917.6 7,000.3 6,400.9 6,149.1 6,308.5 6,367.5 6,219.8<br />
Note: Total emissions presented without LULUCF. Total net emissions presented with LULUCF.<br />
a<br />
The LULUCF Sector Net Total is the net sum of all emissions (i.e., sources) of greenhouse gases to the atmosphere plus<br />
removals of CO2 (i.e., sinks or negative emissions) from the atmosphere.<br />
b<br />
Quality control uncovered errors in the estimate and uncertainty of soil C stock changes for 2013, 2014, 2015, which will<br />
be updated following public review. Corrected estimates are provided in footnotes of the emission summary tables for<br />
Cropland Remaining Cropland, Land Converted to Cropland, Grassland Remaining Grassland, and Land Converted to<br />
Grassland sections in the LULUCF chapter of this report.<br />
Notes: Totals may not sum due to independent rounding. Parentheses indicate negative values or sequestration.<br />
9<br />
10<br />
11<br />
12<br />
13<br />
14<br />
Using this categorization, emissions from electricity generation accounted for the largest portion (29 percent) of<br />
total U.S. greenhouse gas emissions in 2015. Transportation activities, in aggregate, accounted for the second largest<br />
portion (27 percent), while emissions from industry accounted for the third largest portion (22 percent) of total U.S.<br />
greenhouse gas emissions in 2015. Emissions from industry have in general declined over the past decade, due to a<br />
number of factors, including structural changes in the U.S. economy (i.e., shifts from a manufacturing-based to a<br />
service-based economy), fuel switching, and energy efficiency improvements. The remaining 21 percent of U.S.<br />
<strong>Executive</strong> <strong>Summary</strong><br />
ES-23