Euradwaste '08 - EU Bookshop - Europa
Euradwaste '08 - EU Bookshop - Europa Euradwaste '08 - EU Bookshop - Europa
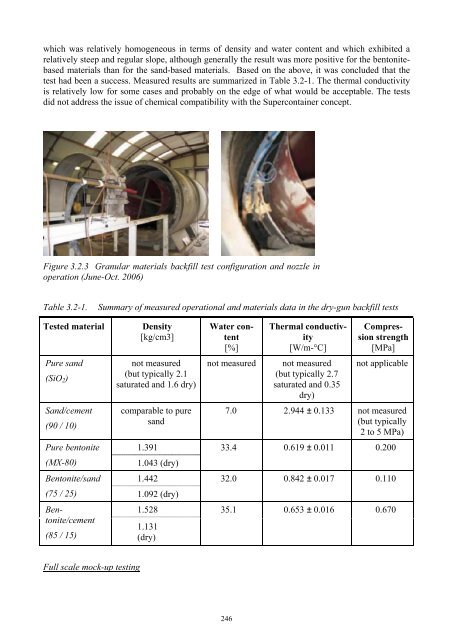
which was relatively homogeneous in terms of density and water content and which exhibited a relatively steep and regular slope, although generally the result was more positive for the bentonitebased materials than for the sand-based materials. Based on the above, it was concluded that the test had been a success. Measured results are summarized in Table 3.2-1. The thermal conductivity is relatively low for some cases and probably on the edge of what would be acceptable. The tests did not address the issue of chemical compatibility with the Supercontainer concept. Figure 3.2.3 Granular materials backfill test configuration and nozzle in operation (June-Oct. 2006) Table 3.2-1. Summary of measured operational and materials data in the dry-gun backfill tests Tested material Density [kg/cm3] Pure sand (SiO2) Sand/cement (90 / 10) not measured (but typically 2.1 saturated and 1.6 dry) comparable to pure sand Pure bentonite 1.391 (MX-80) 1.043 (dry) Bentonite/sand 1.442 (75 / 25) 1.092 (dry) Bentonite/cement (85 / 15) Full scale mock-up testing 1.528 1.131 (dry) Water content [%] 246 Thermal conductivity [W/m-°C] not measured not measured (but typically 2.7 saturated and 0.35 dry) Compression strength [MPa] not applicable 7.0 2.944 ± 0.133 not measured (but typically 2 to 5 MPa) 33.4 0.619 ± 0.011 0.200 32.0 0.842 ± 0.017 0.110 35.1 0.653 ± 0.016 0.670
On April 8 th 2008, the grout injection backfill technique was tested on a 30 m long, full-scale mockup of a disposal cell. This time, the heater inside the sand-filled tube was set to obtain an initial average tube surface temperature of 60°C. It took about 6 hours, at an average rate of 15 m 3 /h, to fill up the annular void. It is currently foreseen to investigate the resulting backfill through borehole sampling and cutting a slice of the mock-up (see Figure 3.2-2). It will depend on this investigation whether the test can be called a success. An important lesson already from this test is that the logistical needs behind the backfill operation increase considerably if longer sections of disposal drift are taken. The possibility to satisfy those needs in underground conditions may turn out to be the determining factor in the limitation of the section length. 3.3 Buffer of granular material in horizontal configuration of waste container resting on prefabricated buffer blocks (NAGRA) Disposal concept / design [3] [5] The engineered barrier system foresees a massive steel canister and a bentonite backfill. The bentonite consists of a hybrid system: the canisters are emplaced on a pre-fabricated pedestal of bentonite blocks and the remainder of the emplacement tunnel is backfilled with a bentonite granulate. Underground transport of the waste packages is in the reference case by rail systems using transport casks (shielding) for the disposal canisters. The emplacement is done by specially designed equipment that allows remote handling. Backfilling of the emplacement tunnels is also performed by remote handling. All of the emplacement equipment is on rail tracks and is powered by electric drive and winches since the emplacement tunnels are inclined between 4 and 6% according to the subhorizontal host rock layer. The following figures illustrate the emplacement sequence: • Transfer from surface to the repository level is carried out by common rack locomotives. In the central area at repository level the wagon carrying the transport cask (shielding) is shunted to a tunnel locomotive (Figure 3.3.1, left); • A pedestal of bentonite blocks is positioned on the emplacement trolley at the enlarged branch tunnel of each emplacement tunnel (Figure 3.3.1, right). The branch tunnel is equipped with double track and a lock; • The transport cask with a waste canister is positioned beside the emplacement trolley. After all preparations are completed operators leave the lock. All the subsequent activities will be carried out using remote operations. The canister is now pushed off the transport cask by the hydraulic device 1 (hydraulic wagon) and moved to the emplacement trolley by the transload equipment (Figure 3.3.1, right) • The emplacement trolley is driven by gravity and controlled by a winch locomotive within the lock up to the emplacement position (Figure 3.3.2, left). At emplacement position pedestal and canister are lowered subsequently and the emplacement trolley is pulled back to the lock • After a waste canister has been emplaced, the remaining tunnel is backfilled with bentonite granulate using twin augers and a wagon which is pulled back continuously by winches while backfilling (Figure 3.3.2, right). 247
- Page 212 and 213: To determine the impact of temperat
- Page 214 and 215: in the underground laboratory in Gr
- Page 216 and 217: under isothermal conditions. If the
- Page 218 and 219: 202
- Page 220 and 221: Zones around such openings which ex
- Page 222 and 223: layout of cells developed by ENPC w
- Page 224 and 225: ) a) e) d) f) d) e) f) c) Figure 3.
- Page 226 and 227: EDZ removal by additional excavatio
- Page 228 and 229: [7] Wenk H.-R., Voltolini, M., Mazu
- Page 230 and 231: that provided by various national s
- Page 232 and 233: system robustness, rather than as s
- Page 234 and 235: Regarding diffusion studies perform
- Page 236 and 237: 7. EDZ characterization and evoluti
- Page 238 and 239: [4] Alonso, J. et al. 2004: Bentoni
- Page 240 and 241: There has been a significant change
- Page 242 and 243: 226
- Page 244 and 245: 228
- Page 246 and 247: 2. Methodology ESDRED has been focu
- Page 248 and 249: Figure 3: Reduced scale mock-up aft
- Page 250 and 251: Figure 8: Demonstration of emplacem
- Page 252 and 253: The various reports produced by the
- Page 254 and 255: 238
- Page 256 and 257: 2. Methodology In general, the work
- Page 258 and 259: limitations of the selected press.
- Page 260 and 261: Figure 3.2.1 Schematic representati
- Page 264 and 265: Figure 3.3.1 Emplacement of SF-Cani
- Page 266 and 267: 1.650 1.600 1.550 1.500 1.450 1.400
- Page 268 and 269: the outlet with some pressure and f
- Page 270 and 271: A experiment, using cross-hole seis
- Page 272 and 273: This seal will be implemented as ri
- Page 274 and 275: [6] Miehe, R., Kröhn, P., Moog, H.
- Page 276 and 277: dence. For waste canister transport
- Page 278 and 279: The main waste canister characteris
- Page 280 and 281: placement borehole. The BSK 3 canis
- Page 282 and 283: Figure 6: Sketch of the Pushing Rob
- Page 284 and 285: 268
- Page 286 and 287: 1.1 Water Cushion Application SKB (
- Page 288 and 289: In the case of SKB and Posiva, the
- Page 290 and 291: Deposition machine tests with load
- Page 292 and 293: Figure 10: Details of electrical pu
- Page 294 and 295: the very heavy weight (43 ton) of t
- Page 296 and 297: is no experience in either the work
- Page 298 and 299: the case of the long plug elaborate
- Page 300 and 301: values measured in the percolated w
- Page 302 and 303: plug the concrete was mixed manuall
- Page 304 and 305: 2.3 Testing of low-pH shotcrete for
- Page 306 and 307: 290
- Page 308 and 309: energy is produced by fission of ur
- Page 310 and 311: 3.2. Integration 3.2.1. Pool Facili
which was relatively homogeneous in terms of density and water content and which exhibited a<br />
relatively steep and regular slope, although generally the result was more positive for the bentonitebased<br />
materials than for the sand-based materials. Based on the above, it was concluded that the<br />
test had been a success. Measured results are summarized in Table 3.2-1. The thermal conductivity<br />
is relatively low for some cases and probably on the edge of what would be acceptable. The tests<br />
did not address the issue of chemical compatibility with the Supercontainer concept.<br />
Figure 3.2.3 Granular materials backfill test configuration and nozzle in<br />
operation (June-Oct. 2006)<br />
Table 3.2-1. Summary of measured operational and materials data in the dry-gun backfill tests<br />
Tested material Density<br />
[kg/cm3]<br />
Pure sand<br />
(SiO2)<br />
Sand/cement<br />
(90 / 10)<br />
not measured<br />
(but typically 2.1<br />
saturated and 1.6 dry)<br />
comparable to pure<br />
sand<br />
Pure bentonite 1.391<br />
(MX-80) 1.043 (dry)<br />
Bentonite/sand 1.442<br />
(75 / 25) 1.092 (dry)<br />
Bentonite/cement<br />
(85 / 15)<br />
Full scale mock-up testing<br />
1.528<br />
1.131<br />
(dry)<br />
Water content<br />
[%]<br />
246<br />
Thermal conductivity<br />
[W/m-°C]<br />
not measured not measured<br />
(but typically 2.7<br />
saturated and 0.35<br />
dry)<br />
Compression<br />
strength<br />
[MPa]<br />
not applicable<br />
7.0 2.944 ± 0.133 not measured<br />
(but typically<br />
2 to 5 MPa)<br />
33.4 0.619 ± 0.011 0.200<br />
32.0 0.842 ± 0.017 0.110<br />
35.1 0.653 ± 0.016 0.670


