2j7YOwO
2j7YOwO 2j7YOwO
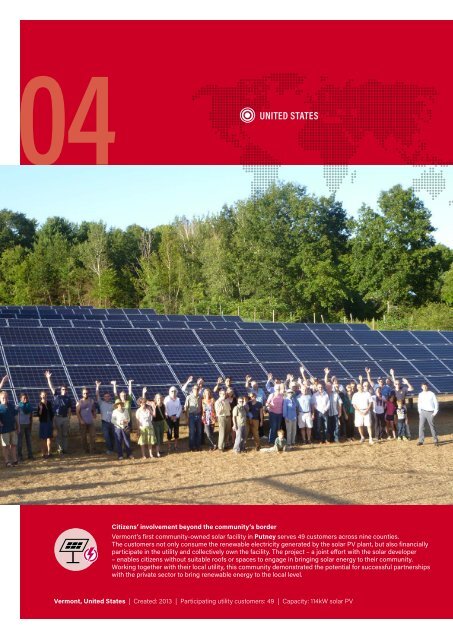
04 UNITED STATES Citizens’ involvement beyond the community’s border Vermont’s first community-owned solar facility in Putney serves 49 customers across nine counties. The customers not only consume the renewable electricity generated by the solar PV plant, but also financially participate in the utility and collectively own the facility. The project – a joint effort with the solar developer – enables citizens without suitable roofs or spaces to engage in bringing solar energy to their community. Working together with their local utility, this community demonstrated the potential for successful partnerships with the private sector to bring renewable energy to the local level. Vermont, United States | Created: 2013 | Participating utility customers: 49 | Capacity: 114kW solar PV
04 INVESTMENT FLOWS Global new investment in renewable power and fuels (not including hydropower projects >50 MW) was USD 285.9 billion in 2015, as estimated by Bloomberg New Energy Finance (BNEF) i . This represents a rise of 5% compared to the previous year and exceeds the previous record of USD 278.5 billion achieved in 2011 ii . Investment in renewable power and fuels has exceeded USD 200 billion per year for the past six years. (p See Figure 35.) Including investments in hydropower projects larger than 50 MW, total new investment in renewable power and fuels was at least USD 328.9 billion in 2015 iii . 1 Note that these estimates do not include investment in renewable heating and cooling technologies. ( R See Reference Tables R14.) In 2015, global investment in new renewable power capacity (excluding hydropower >50 MW), at USD 265.8 billion iv , was more than double the USD 130 billion allocated to new coal- and natural gas-fired generation capacity. This represents the largest difference in favour of renewables to date. If hydropower projects >50 MW are considered, the spread between renewables and fossil fuel investment in new power capacity is even greater. Figure 35. Global New Investment in Renewable Power and Fuels, Developed, Emerging and Developing Countries, 2005–2015 Billion USD 300 250 World total Developed countries China, India & Brazil Other developing countries 239 279 257 234 273 286 billion USD 200 150 100 73 112 83 154 108 182 179 123 60 114 64 164 75 191 87 151 106 136 98 142 131 130 156 Source: BNEF, see footnotes i and iii for this section. 50 20 53 29 46 9 2005 2006 2007 2008 2009 2010 2011 2012 2013 2014 2015 04 Does not include investment in hydropower > 50 MW i This chapter is derived from UNEP’s Global Trends in Renewable Energy Investment 2016 (Frankfurt: 2016), the sister publication to the GSR, prepared by the Frankfurt School–UNEP Collaborating Centre for Climate & Sustainable Energy Finance (FS-UNEP) in co-operation with BNEF. Data are based on the output of the desktop database of BNEF, unless otherwise noted, and reflect the timing of investment decisions. The following renewable energy projects are included: all biomass and waste-to-energy, geothermal and wind generation projects of more than 1 MW; all hydropower projects of between 1 and 50 MW; all solar power projects, with those less than 1 MW estimated separately and referred to as small-scale projects or small distributed capacity; all ocean energy projects; and all biofuel projects with an annual production capacity of 1 million litres or more. For more information, please refer to the FS-UNEP/BNEF Global Trends report. Where totals do not add up, the difference is due to rounding. ii Note that declining costs of some renewable energy technologies (particularly solar PV and wind power) have a decremental impact on total investment (all else being equal). Thus, growth in investment (monetary) does not reflect actual growth in installed renewable power capacity. iii Investment in large hydropower (>50 MW) is not included in the overall total for investment in renewable energy. BNEF tracks only hydropower projects of between 1 MW and 50 MW, but it does make estimates for hydro >50 MW. iv This number is for renewable power asset finance and small-scale projects. It differs from the overall total for renewable energy investment (USD 285.9 billion) provided elsewhere in this chapter because it excludes biofuels and some types of noncapacity investment, such as equity-raising on public markets and development R&D. RENEWABLES 2016 · GLOBAL STATUS REPORT 99
- Page 47 and 48: China, the third largest ethanol pr
- Page 49 and 50: concluded long-term offtake agreeme
- Page 51 and 52: GEOTHERMAL POWER Figure XX. Figure
- Page 53 and 54: GEOTHERMAL INDUSTRY Low natural gas
- Page 55 and 56: HYDROPOWER Figure 12. Hydropower Gl
- Page 57 and 58: OCEAN ENERGY OCEAN ENERGY MARKETS O
- Page 59 and 60: Country of Spain, the first commerc
- Page 61 and 62: 7.3 GW was installed, for a total o
- Page 63 and 64: Figure 16. Solar PV Capacity and Ad
- Page 65 and 66: SOLAR PV INDUSTRY The solar PV indu
- Page 67 and 68: Sharp - in the storage market by in
- Page 69 and 70: CSP INDUSTRY It was a watershed yea
- Page 71 and 72: SOLAR THERMAL HEATING AND COOLING F
- Page 73 and 74: SOLAR THERMAL HEATING/COOLING INDUS
- Page 75 and 76: WIND POWER WIND POWER MARKETS Wind
- Page 77 and 78: WIND POWER Figure 23. Wind Power Gl
- Page 79 and 80: WIND POWER INDUSTRY The wind power
- Page 81 and 82: Sidebar 3. Renewable Power Technolo
- Page 83 and 84: Investment Cost R USD min max wa Ca
- Page 85 and 86: Investment Cost R USD min max wa Ca
- Page 87 and 88: 03 DISTRIBUTED RENEWABLE ENERGY FOR
- Page 89 and 90: through renewables-based mini-grids
- Page 91 and 92: India Tanzania Kenya Ethiopia 661,6
- Page 93 and 94: INVESTMENT AND FINANCING The year 2
- Page 95 and 96: The market for PAYG solar - micro-p
- Page 97: in 2015. In 2014, GACC projected th
- Page 101 and 102: INVESTMENT BY ECONOMY The shift in
- Page 103 and 104: INVESTMENT BY TECHNOLOGY Solar powe
- Page 105 and 106: SOURCES OF INVESTMENT Debt makes up
- Page 107 and 108: 05 POLICY LANDSCAPE Nearly all coun
- Page 109 and 110: spearheaded by UNIDO, is designed t
- Page 111 and 112: Specific commitments to renewable h
- Page 113 and 114: Figure 39. Countries with Renewable
- Page 115 and 116: Three US states took steps to expan
- Page 117 and 118: volume requirements that were an in
- Page 119 and 120: Table 4. Renewable Energy Support P
- Page 121 and 122: Table 4. Renewable Energy Support P
- Page 123 and 124: 06 ENERGY EFFICIENCY GLOBAL OVERVIE
- Page 125 and 126: MARKET AND INDUSTRY TRENDS BUILDING
- Page 127 and 128: States, new dishwashers use 40% les
- Page 129 and 130: 1990 and 2008, design-related effic
- Page 131 and 132: The Green Climate Fund included in
- Page 133 and 134: appliances, and the country also ha
- Page 135 and 136: 07 FEATURE: COMMUNITY RENEWABLE ENE
- Page 137 and 138: ORGANISATIONAL STRUCTURES Organisat
- Page 139 and 140: e a successful means for addressing
- Page 141 and 142: Table R2. Renewable Electric Power
- Page 143 and 144: Table R4. Geothermal Power Global C
- Page 145 and 146: Table R6. Solar PV Global Capacity
- Page 147 and 148: Table R8. Solar Water Heating Colle
04<br />
UNITED<br />
STATES<br />
Citizens’ involvement beyond the community’s border<br />
Vermont’s first community-owned solar facility in Putney serves 49 customers across nine counties.<br />
The customers not only consume the renewable electricity generated by the solar PV plant, but also financially<br />
participate in the utility and collectively own the facility. The project – a joint effort with the solar developer<br />
– enables citizens without suitable roofs or spaces to engage in bringing solar energy to their community.<br />
Working together with their local utility, this community demonstrated the potential for successful partnerships<br />
with the private sector to bring renewable energy to the local level.<br />
Vermont, United States | Created: 2013 | Participating utility customers: 49 | Capacity: 114kW solar PV


