- Page 1 and 2:
RENEWABLES 2016 GLOBAL STATUS REPOR
- Page 3 and 4:
GSR 2016 TABLE OF CONTENTS Foreword
- Page 5 and 6:
Figures Figure 1. Estimated Renewab
- Page 7 and 8:
FOREWORD The year 2015 was an extra
- Page 9 and 10:
RENEWABLES GLOBAL STATUS REPORT (GS
- Page 11 and 12: Note: Some individuals have contrib
- Page 13 and 14: Sweden Robert Fischer (University o
- Page 15 and 16: REVIEWERS AND OTHER CONTRIBUTORS Sh
- Page 17 and 18: EXECUTIVE SUMMARY GLOBAL OVERVIEW A
- Page 19 and 20: RENEWABLE ENERGY INDICATORS 2015 IN
- Page 21 and 22: TOP FIVE COUNTRIES Annual investmen
- Page 23 and 24: SOLAR PV: Record deployment and rap
- Page 25 and 26: INVESTMENT FLOWS A new record high;
- Page 27 and 28: 01 GLOBAL OVERVIEW The year 2015 wa
- Page 29 and 30: markets, policy changes and uncerta
- Page 31 and 32: Sidebar 1. Regional Spotlight: Sout
- Page 33 and 34: Figure 4. Renewable Power Capacitie
- Page 35 and 36: also are growing, as are wind turbi
- Page 37 and 38: n Latin America: Biomass-based heat
- Page 39 and 40: n Africa: Although biofuel producti
- Page 41 and 42: JOBS IN RENEWABLE ENERGY Table 1. E
- Page 43 and 44: 02 MARKET AND INDUSTRY TRENDS BIOMA
- Page 45 and 46: BIOMASS ENERGY Figure 7. Shares of
- Page 47 and 48: China, the third largest ethanol pr
- Page 49 and 50: concluded long-term offtake agreeme
- Page 51 and 52: GEOTHERMAL POWER Figure XX. Figure
- Page 53 and 54: GEOTHERMAL INDUSTRY Low natural gas
- Page 55 and 56: HYDROPOWER Figure 12. Hydropower Gl
- Page 57 and 58: OCEAN ENERGY OCEAN ENERGY MARKETS O
- Page 59 and 60: Country of Spain, the first commerc
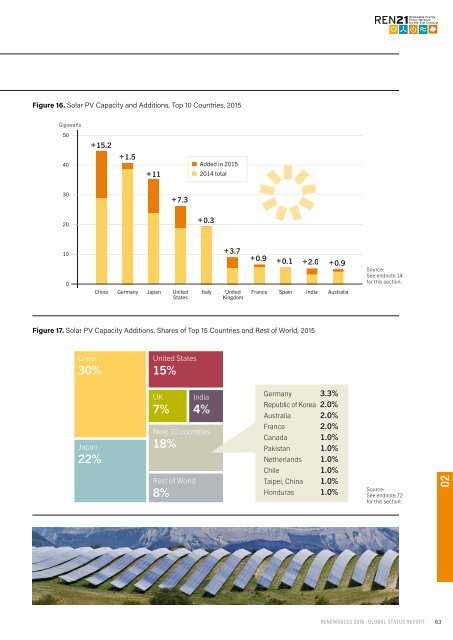
- Page 61: 7.3 GW was installed, for a total o
- Page 65 and 66: SOLAR PV INDUSTRY The solar PV indu
- Page 67 and 68: Sharp - in the storage market by in
- Page 69 and 70: CSP INDUSTRY It was a watershed yea
- Page 71 and 72: SOLAR THERMAL HEATING AND COOLING F
- Page 73 and 74: SOLAR THERMAL HEATING/COOLING INDUS
- Page 75 and 76: WIND POWER WIND POWER MARKETS Wind
- Page 77 and 78: WIND POWER Figure 23. Wind Power Gl
- Page 79 and 80: WIND POWER INDUSTRY The wind power
- Page 81 and 82: Sidebar 3. Renewable Power Technolo
- Page 83 and 84: Investment Cost R USD min max wa Ca
- Page 85 and 86: Investment Cost R USD min max wa Ca
- Page 87 and 88: 03 DISTRIBUTED RENEWABLE ENERGY FOR
- Page 89 and 90: through renewables-based mini-grids
- Page 91 and 92: India Tanzania Kenya Ethiopia 661,6
- Page 93 and 94: INVESTMENT AND FINANCING The year 2
- Page 95 and 96: The market for PAYG solar - micro-p
- Page 97 and 98: in 2015. In 2014, GACC projected th
- Page 99 and 100: 04 INVESTMENT FLOWS Global new inve
- Page 101 and 102: INVESTMENT BY ECONOMY The shift in
- Page 103 and 104: INVESTMENT BY TECHNOLOGY Solar powe
- Page 105 and 106: SOURCES OF INVESTMENT Debt makes up
- Page 107 and 108: 05 POLICY LANDSCAPE Nearly all coun
- Page 109 and 110: spearheaded by UNIDO, is designed t
- Page 111 and 112: Specific commitments to renewable h
- Page 113 and 114:
Figure 39. Countries with Renewable
- Page 115 and 116:
Three US states took steps to expan
- Page 117 and 118:
volume requirements that were an in
- Page 119 and 120:
Table 4. Renewable Energy Support P
- Page 121 and 122:
Table 4. Renewable Energy Support P
- Page 123 and 124:
06 ENERGY EFFICIENCY GLOBAL OVERVIE
- Page 125 and 126:
MARKET AND INDUSTRY TRENDS BUILDING
- Page 127 and 128:
States, new dishwashers use 40% les
- Page 129 and 130:
1990 and 2008, design-related effic
- Page 131 and 132:
The Green Climate Fund included in
- Page 133 and 134:
appliances, and the country also ha
- Page 135 and 136:
07 FEATURE: COMMUNITY RENEWABLE ENE
- Page 137 and 138:
ORGANISATIONAL STRUCTURES Organisat
- Page 139 and 140:
e a successful means for addressing
- Page 141 and 142:
Table R2. Renewable Electric Power
- Page 143 and 144:
Table R4. Geothermal Power Global C
- Page 145 and 146:
Table R6. Solar PV Global Capacity
- Page 147 and 148:
Table R8. Solar Water Heating Colle
- Page 149 and 150:
Table R10. Electricity Access by Re
- Page 151 and 152:
Table R10. Electricity Access by Re
- Page 153 and 154:
Table R11. Population Relying on Tr
- Page 155 and 156:
Table R12. Programmes Furthering En
- Page 157 and 158:
Table R12. Programmes Furthering En
- Page 159 and 160:
Table R13. Networks Furthering Ener
- Page 161 and 162:
Table R15. Share of Primary and Fin
- Page 163 and 164:
Table R15. Share of Primary and Fin
- Page 165 and 166:
Table R17. Share of Electricity Gen
- Page 167 and 168:
Table R17. Share of Electricity Gen
- Page 169 and 170:
Table R18. Renewable Energy Targets
- Page 171 and 172:
Table R19. Targets for Renewable Po
- Page 173 and 174:
Table R19. Targets for Renewable Po
- Page 175 and 176:
Table R19. Targets for Renewable Po
- Page 177 and 178:
Table R20. Cumulative Number 1 of C
- Page 179 and 180:
Table R21. Cumulative Number 1 of C
- Page 181 and 182:
Table R23. Heating and Cooling from
- Page 183 and 184:
Table R25. National and State/Provi
- Page 185 and 186:
Table R26. City and Local Renewable
- Page 187 and 188:
ENDNOTES 01 GLOBAL OVERVIEW unfccc-
- Page 189 and 190:
ENDNOTES 01 GLOBAL OVERVIEW bbc.com
- Page 191 and 192:
ENDNOTES 01 GLOBAL OVERVIEW 76 See
- Page 193 and 194:
ENDNOTES 01 GLOBAL OVERVIEW India,
- Page 195 and 196:
ENDNOTES 01 GLOBAL OVERVIEW persona
- Page 197 and 198:
ENDNOTES 01 GLOBAL OVERVIEW which o
- Page 199 and 200:
ENDNOTES 01 GLOBAL OVERVIEW http://
- Page 201 and 202:
ENDNOTES 02 MARKET AND INDUSTRY TRE
- Page 203 and 204:
ENDNOTES 02 MARKET AND INDUSTRY TRE
- Page 205 and 206:
ENDNOTES 02 MARKET AND INDUSTRY TRE
- Page 207 and 208:
ENDNOTES 02 MARKET AND INDUSTRY TRE
- Page 209 and 210:
ENDNOTES 02 MARKET AND INDUSTRY TRE
- Page 211 and 212:
ENDNOTES 02 MARKET AND INDUSTRY TRE
- Page 213 and 214:
ENDNOTES 02 MARKET AND INDUSTRY TRE
- Page 215 and 216:
ENDNOTES 02 MARKET AND INDUSTRY TRE
- Page 217 and 218:
ENDNOTES 02 MARKET AND INDUSTRY TRE
- Page 219 and 220:
ENDNOTES 02 MARKET AND INDUSTRY TRE
- Page 221 and 222:
ENDNOTES 02 MARKET AND INDUSTRY TRE
- Page 223 and 224:
ENDNOTES 02 MARKET AND INDUSTRY TRE
- Page 225 and 226:
ENDNOTES 02 MARKET AND INDUSTRY TRE
- Page 227 and 228:
ENDNOTES 02 MARKET AND INDUSTRY TRE
- Page 229 and 230:
ENDNOTES 02 MARKET AND INDUSTRY TRE
- Page 231 and 232:
ENDNOTES 02 MARKET AND INDUSTRY TRE
- Page 233 and 234:
ENDNOTES 02 MARKET AND INDUSTRY TRE
- Page 235 and 236:
ENDNOTES 02 MARKET AND INDUSTRY TRE
- Page 237 and 238:
ENDNOTES 02 MARKET AND INDUSTRY TRE
- Page 239 and 240:
ENDNOTES 02 MARKET AND INDUSTRY TRE
- Page 241 and 242:
ENDNOTES 02 MARKET AND INDUSTRY TRE
- Page 243 and 244:
ENDNOTES 03 DISTRIBUTED RENEWABLE E
- Page 245 and 246:
ENDNOTES 03 DISTRIBUTED RENEWABLE E
- Page 247 and 248:
ENDNOTES 05 POLICY LANDSCAPE POLICY
- Page 249 and 250:
ENDNOTES 05 POLICY LANDSCAPE “Res
- Page 251 and 252:
ENDNOTES 05 POLICY LANDSCAPE 2015,
- Page 253 and 254:
ENDNOTES 06 ENERGY EFFICIENCY blog_
- Page 255 and 256:
ENDNOTES 06 ENERGY EFFICIENCY go.jp
- Page 257 and 258:
ENDNOTES 07 FEATURE Programme, 2013
- Page 259 and 260:
ENDNOTES REFERENCE TABLES 2016); so
- Page 261 and 262:
ENDNOTES REFERENCE TABLES FTI Consu
- Page 263 and 264:
NOTES 4. Bio-power Data Given exist
- Page 265 and 266:
GLOSSARY projects vary in technolog
- Page 267 and 268:
GLOSSARY Labelling. System in which
- Page 269 and 270:
GLOSSARY Vehicle fuel standards. Ru
- Page 271 and 272:
PHOTO CREDITS page 9 SAIREC, South