2j7YOwO
2j7YOwO 2j7YOwO
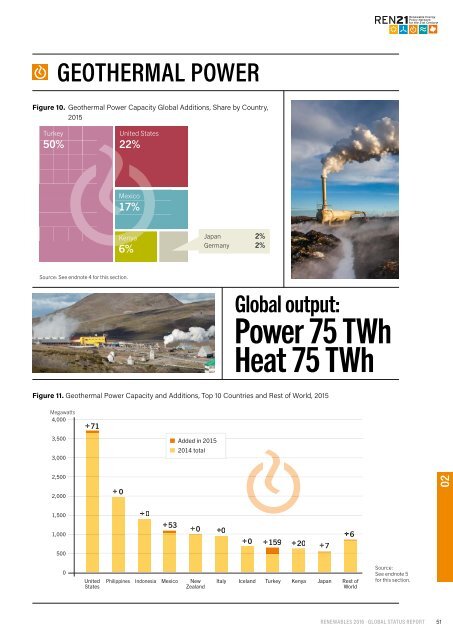
02 MARKET AND INDUSTRY TRENDS GEOTHERMAL POWER AND HEAT GEOTHERMAL MARKETS Geothermal resources provide energy in the form of electricity and direct heating and cooling, totalling an estimated 543 PJ (151 TWh) in 2015. 1 Geothermal direct use and electricity generation each are estimated to account for one-half of total final geothermal output (75 TWh each)i. 2 Some geothermal plants produce both electricity and thermal output for various heat applications. About 315 MW of new geothermal power generating capacity was completed in 2015, bringing the global total to an estimated 13.2 GW. 3 Countries that added capacity during the year were (in order of new capacity brought online) Turkey, the United States, Mexico, Kenya, Japan and Germany. 4 (p See Figure 10.) Turkey accounted for about half of new installations. At the end of 2015, the countries with the largest amounts of geothermal power generating capacity were the United States (3.6 GW), the Philippines (1.9 GW), Indonesia (1.4 GW), Mexico (1.1 GW), New Zealand (1.0 GW), Italy (0.9 GW), Iceland (0.7 GW), Turkey (0.6 GW), Kenya (0.6 GW) and Japan (0.5 GW). 5 (p See Figure 11.) Capacity additions in 2015 were somewhat lower in total than in recent years. As many as 11 binary ii power plants were completed, totalling 129 MW, and another 8 single-flash plants were completed, totalling 186 MW. 6 Turkey continued its relatively rapid build-up of geothermal power capacity, with 10 units completed in 2015, adding 159 MW for a total of at least 624 MW. 7 Among the plants completed was a 4 MW binary Organic Rankine Cycle (ORC) unit by Exergy (Italy) that is claimed to be the world’s first to operate at two pressure levels, which increases energy recovery and overall efficiency from low-temperature resources. 8 Turkey is well on its way to meeting its goal of having 1 GW of geothermal power capacity in place by 2023. 9 In 2015, the country generated 3.37 TWh with geothermal energy, up 50% over 2014. 10 The United States added 71 MW with two binary plants (by Ormat, United States) coming online in Nevada, bringing total operating capacity to nearly 3.6 GW (2.5 GW net). 11 Generation in 2015 was 16.8 TWh, representing a 5.6% increase relative to 2014. 12 There are some indications that significant new growth could be unleashed if economic and regulatory conditions improved; about 500 MW of projects are languishing in latestage development in the United States. 13 Mexico brought online a 53 MW unit at the Los Azufres field in early 2015 and retired four ageing wellhead units (5 MW each) in the same location. In addition, two 5 MW wellhead plants were installed in the Domo San Pedro field, which is Mexico’s first privately owned geothermal project. 14 The total net increase for the year was 43 MW, bringing Mexico’s installed capacity to 1.1 GW. 15 During 2015, Mexico’s energy authorities provided additional concessions for the government’s power producer (CFE) in fields where the company already has developed geothermal resources. However, most of the country’s remaining geothermal potential was opened for private investment and development. 16 Kenya added at least 20 MW of new capacity in 2015 for a total of about 600 MW. 17 Drilling commenced on the first phase of the Akiira Geothermal 140 MW plant after Kenya Power signed a PPA for its output. It is expected that the plant will be sub-Saharan Africa’s first private sector greenfield geothermal development. 18 Exploration risk insurance was secured for this project; in many cases, however, risk mitigation remains a hurdle for geothermal development, especially in developing countries. 19 In late 2015, another binary plant was completed in Bavaria in Germany, supplying 5.5 MW of power generating capability in addition to 12 MW of thermal output. 20 As of early 2016, Germany had a concentration of several small geothermal plants around Munich that take advantage of local low-temperature geothermal resources to provide both heat and power. 21 Japan also added several facilities (altogether 6.8 MW) in 2015, bringing its total capacity to 535 MW. The new plants included i This does not include the renewable final energy output of ground-source heat pumps, which was estimated at 358 PJ (99 TWh) in 2015. See endnote 1 for this section. ii In a binary plant, the geothermal fluid heats and vaporises a separate working fluid with a lower boiling point than water, which drives a turbine for power generation. Each fluid cycle is closed, and the geothermal fluid is re-injected into the heat reservoir. The binary cycle allows an effective and efficient extraction of heat for power generation from relatively low-temperature geothermal fluids. Organic Rankine Cycle (ORC) binary geothermal plants use an organic working fluid, and the Kalina cycle uses a non-organic working fluid. In conventional geothermal power plants, geothermal steam is used directly to drive the turbine, whereas in a conventional thermal power plant, fuelled by nuclear reaction or fossil fuels, the working fluid is pure water. 50
GEOTHERMAL POWER Figure XX. Figure Geothermal 10. Geothermal Power Capacity Power Additions, Capacity Share Global by Country, Additions, 2015 Share by Country, 2015 Turkey 50% United States 22% Mexico 17% Kenya 6% Japan 2% Germany 2% Source: See endnote 4 for this section. Global output: Power 75 TWh Heat 75 TWh Figure 11. Geothermal Power Capacity and Additions, Top 10 Countries and Rest of World, 2015 Figure XX. Geothermal Power Capacity and Additions, Top 10 Countries and Rest of World, 2014 Megawatts 4,000 + 71 3,500 3,000 Added in 2015 2014 total 2,500 2,000 + 0 02 1,500 + 0 1,000 + 53 + 0 +0 + 6 + 0 + 159 + 20 + 7 500 0 United States Philippines Indonesia Mexico New Zealand Italy Iceland Turkey Kenya Japan Rest of World Source: See endnote 5 for this section. Additions are net of repowering and retirements. RENEWABLES 2016 · GLOBAL STATUS REPORT 51
- Page 1 and 2: RENEWABLES 2016 GLOBAL STATUS REPOR
- Page 3 and 4: GSR 2016 TABLE OF CONTENTS Foreword
- Page 5 and 6: Figures Figure 1. Estimated Renewab
- Page 7 and 8: FOREWORD The year 2015 was an extra
- Page 9 and 10: RENEWABLES GLOBAL STATUS REPORT (GS
- Page 11 and 12: Note: Some individuals have contrib
- Page 13 and 14: Sweden Robert Fischer (University o
- Page 15 and 16: REVIEWERS AND OTHER CONTRIBUTORS Sh
- Page 17 and 18: EXECUTIVE SUMMARY GLOBAL OVERVIEW A
- Page 19 and 20: RENEWABLE ENERGY INDICATORS 2015 IN
- Page 21 and 22: TOP FIVE COUNTRIES Annual investmen
- Page 23 and 24: SOLAR PV: Record deployment and rap
- Page 25 and 26: INVESTMENT FLOWS A new record high;
- Page 27 and 28: 01 GLOBAL OVERVIEW The year 2015 wa
- Page 29 and 30: markets, policy changes and uncerta
- Page 31 and 32: Sidebar 1. Regional Spotlight: Sout
- Page 33 and 34: Figure 4. Renewable Power Capacitie
- Page 35 and 36: also are growing, as are wind turbi
- Page 37 and 38: n Latin America: Biomass-based heat
- Page 39 and 40: n Africa: Although biofuel producti
- Page 41 and 42: JOBS IN RENEWABLE ENERGY Table 1. E
- Page 43 and 44: 02 MARKET AND INDUSTRY TRENDS BIOMA
- Page 45 and 46: BIOMASS ENERGY Figure 7. Shares of
- Page 47 and 48: China, the third largest ethanol pr
- Page 49: concluded long-term offtake agreeme
- Page 53 and 54: GEOTHERMAL INDUSTRY Low natural gas
- Page 55 and 56: HYDROPOWER Figure 12. Hydropower Gl
- Page 57 and 58: OCEAN ENERGY OCEAN ENERGY MARKETS O
- Page 59 and 60: Country of Spain, the first commerc
- Page 61 and 62: 7.3 GW was installed, for a total o
- Page 63 and 64: Figure 16. Solar PV Capacity and Ad
- Page 65 and 66: SOLAR PV INDUSTRY The solar PV indu
- Page 67 and 68: Sharp - in the storage market by in
- Page 69 and 70: CSP INDUSTRY It was a watershed yea
- Page 71 and 72: SOLAR THERMAL HEATING AND COOLING F
- Page 73 and 74: SOLAR THERMAL HEATING/COOLING INDUS
- Page 75 and 76: WIND POWER WIND POWER MARKETS Wind
- Page 77 and 78: WIND POWER Figure 23. Wind Power Gl
- Page 79 and 80: WIND POWER INDUSTRY The wind power
- Page 81 and 82: Sidebar 3. Renewable Power Technolo
- Page 83 and 84: Investment Cost R USD min max wa Ca
- Page 85 and 86: Investment Cost R USD min max wa Ca
- Page 87 and 88: 03 DISTRIBUTED RENEWABLE ENERGY FOR
- Page 89 and 90: through renewables-based mini-grids
- Page 91 and 92: India Tanzania Kenya Ethiopia 661,6
- Page 93 and 94: INVESTMENT AND FINANCING The year 2
- Page 95 and 96: The market for PAYG solar - micro-p
- Page 97 and 98: in 2015. In 2014, GACC projected th
- Page 99 and 100: 04 INVESTMENT FLOWS Global new inve
GEOTHERMAL POWER<br />
Figure XX. Figure Geothermal 10. Geothermal Power Capacity Power Additions, Capacity Share Global by Country, Additions, 2015 Share by Country,<br />
2015<br />
Turkey<br />
50%<br />
United States<br />
22%<br />
Mexico<br />
17%<br />
Kenya<br />
6%<br />
Japan 2%<br />
Germany 2%<br />
Source: See endnote 4 for this section.<br />
Global output:<br />
Power 75 TWh<br />
Heat 75 TWh<br />
Figure 11. Geothermal Power Capacity and Additions, Top 10 Countries and Rest of World, 2015<br />
Figure XX. Geothermal Power Capacity and Additions, Top 10 Countries and Rest of World, 2014<br />
Megawatts<br />
4,000<br />
+ 71<br />
3,500<br />
3,000<br />
Added in 2015<br />
2014 total<br />
2,500<br />
2,000<br />
+ 0<br />
02<br />
1,500<br />
+ 0<br />
1,000<br />
+ 53 + 0 +0<br />
+ 6<br />
+ 0 + 159 + 20 + 7<br />
500<br />
0<br />
United<br />
States<br />
Philippines<br />
Indonesia<br />
Mexico<br />
New<br />
Zealand<br />
Italy Iceland Turkey Kenya Japan Rest of<br />
World<br />
Source:<br />
See endnote 5<br />
for this section.<br />
Additions are net of repowering and retirements.<br />
RENEWABLES 2016 · GLOBAL STATUS REPORT<br />
51


