

2j7YOwO
2j7YOwO
2j7YOwO

You also want an ePaper? Increase the reach of your titles
YUMPU automatically turns print PDFs into web optimized ePapers that Google loves.
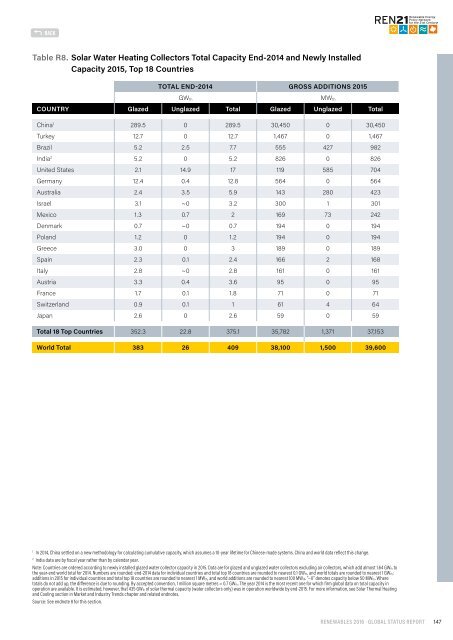
Table R8. Solar Water Heating Collectors Total Capacity End-2014 and Newly Installed<br />
Capacity 2015, Top 18 Countries<br />
TOTAL END-2014 GROSS ADDITIONS 2015<br />
GW th<br />
MW th<br />
COUNTRY Glazed Unglazed Total Glazed Unglazed Total<br />
China 1 289.5 0 289.5 30,450 0 30,450<br />
Turkey 12.7 0 12.7 1,467 0 1,467<br />
Brazil 5.2 2.5 7.7 555 427 982<br />
India 2 5.2 0 5.2 826 0 826<br />
United States 2.1 14.9 17 119 585 704<br />
Germany 12.4 0.4 12.8 564 0 564<br />
Australia 2.4 3.5 5.9 143 280 423<br />
Israel 3.1 ~0 3.2 300 1 301<br />
Mexico 1.3 0.7 2 169 73 242<br />
Denmark 0.7 ~0 0.7 194 0 194<br />
Poland 1.2 0 1.2 194 0 194<br />
Greece 3.0 0 3 189 0 189<br />
Spain 2.3 0.1 2.4 166 2 168<br />
Italy 2.8 ~0 2.8 161 0 161<br />
Austria 3.3 0.4 3.6 95 0 95<br />
France 1.7 0.1 1.8 71 0 71<br />
Switzerland 0.9 0.1 1 61 4 64<br />
Japan 2.6 0 2.6 59 0 59<br />
Total 18 Top Countries 352.3 22.8 375.1 35,782 1,371 37,153<br />
World Total 383 26 409 38,100 1,500 39,600<br />
1<br />
In 2014, China settled on a new methodology for calculating cumulative capacity, which assumes a 10-year lifetime for Chinese-made systems. China and world data reflect this change.<br />
2<br />
India data are by fiscal year rather than by calendar year.<br />
Note: Countries are ordered according to newly installed glazed water collector capacity in 2015. Data are for glazed and unglazed water collectors excluding air collectors, which add almost 1.64 GWth to<br />
the year-end world total for 2014. Numbers are rounded: end-2014 data for individual countries and total top 18 countries are rounded to nearest 0.1 GWth, and world totals are rounded to nearest 1 GWth;<br />
additions in 2015 for individual countries and total top 18 countries are rounded to nearest 1 MWth, and world additions are rounded to nearest 100 MWth. “~0” denotes capacity below 50 MWth. Where<br />
totals do not add up, the difference is due to rounding. By accepted convention, 1 million square metres = 0.7 GWth. The year 2014 is the most recent one for which firm global data on total capacity in<br />
operation are available. It is estimated, however, that 435 GWth of solar thermal capacity (water collectors only) was in operation worldwide by end-2015. For more information, see Solar Thermal Heating<br />
and Cooling section in Market and Industry Trends chapter and related endnotes.<br />
Source: See endnote 8 for this section.<br />
RENEWABLES 2016 · GLOBAL STATUS REPORT<br />
147
