Development of a novel mechatronic system for mechanical weed ...
Development of a novel mechatronic system for mechanical weed ...
Development of a novel mechatronic system for mechanical weed ...

You also want an ePaper? Increase the reach of your titles
YUMPU automatically turns print PDFs into web optimized ePapers that Google loves.
Results and discussion<br />
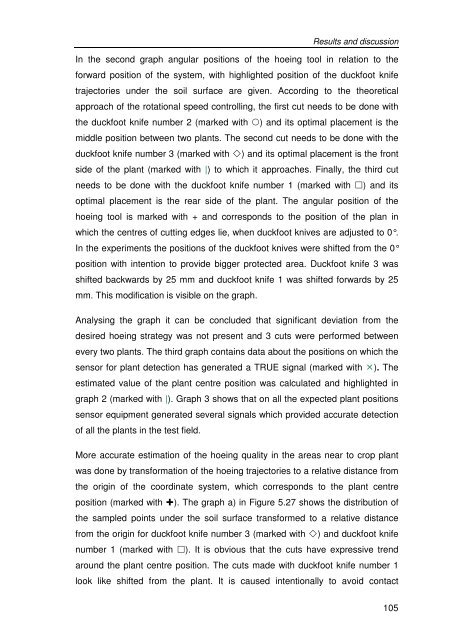
In the second graph angular positions <strong>of</strong> the hoeing tool in relation to the<br />
<strong>for</strong>ward position <strong>of</strong> the <strong>system</strong>, with highlighted position <strong>of</strong> the duckfoot knife<br />
trajectories under the soil surface are given. According to the theoretical<br />
approach <strong>of</strong> the rotational speed controlling, the first cut needs to be done with<br />
the duckfoot knife number 2 (marked with �) and its optimal placement is the<br />
middle position between two plants. The second cut needs to be done with the<br />
duckfoot knife number 3 (marked with �) and its optimal placement is the front<br />
side <strong>of</strong> the plant (marked with |) to which it approaches. Finally, the third cut<br />
needs to be done with the duckfoot knife number 1 (marked with �) and its<br />
optimal placement is the rear side <strong>of</strong> the plant. The angular position <strong>of</strong> the<br />
hoeing tool is marked with + and corresponds to the position <strong>of</strong> the plan in<br />
which the centres <strong>of</strong> cutting edges lie, when duckfoot knives are adjusted to 0°.<br />
In the experiments the positions <strong>of</strong> the duckfoot knives were shifted from the 0°<br />
position with intention to provide bigger protected area. Duckfoot knife 3 was<br />
shifted backwards by 25 mm and duckfoot knife 1 was shifted <strong>for</strong>wards by 25<br />
mm. This modification is visible on the graph.<br />
Analysing the graph it can be concluded that significant deviation from the<br />
desired hoeing strategy was not present and 3 cuts were per<strong>for</strong>med between<br />
every two plants. The third graph contains data about the positions on which the<br />
sensor <strong>for</strong> plant detection has generated a TRUE signal (marked with �). The<br />
estimated value <strong>of</strong> the plant centre position was calculated and highlighted in<br />
graph 2 (marked with |). Graph 3 shows that on all the expected plant positions<br />
sensor equipment generated several signals which provided accurate detection<br />
<strong>of</strong> all the plants in the test field.<br />
More accurate estimation <strong>of</strong> the hoeing quality in the areas near to crop plant<br />
was done by trans<strong>for</strong>mation <strong>of</strong> the hoeing trajectories to a relative distance from<br />
the origin <strong>of</strong> the coordinate <strong>system</strong>, which corresponds to the plant centre<br />
position (marked with �). The graph a) in Figure 5.27 shows the distribution <strong>of</strong><br />
the sampled points under the soil surface trans<strong>for</strong>med to a relative distance<br />
from the origin <strong>for</strong> duckfoot knife number 3 (marked with �) and duckfoot knife<br />
number 1 (marked with �). It is obvious that the cuts have expressive trend<br />
around the plant centre position. The cuts made with duckfoot knife number 1<br />
look like shifted from the plant. It is caused intentionally to avoid contact<br />
105