1 - Nuclear Sciences and Applications - IAEA
1 - Nuclear Sciences and Applications - IAEA
1 - Nuclear Sciences and Applications - IAEA

You also want an ePaper? Increase the reach of your titles
YUMPU automatically turns print PDFs into web optimized ePapers that Google loves.
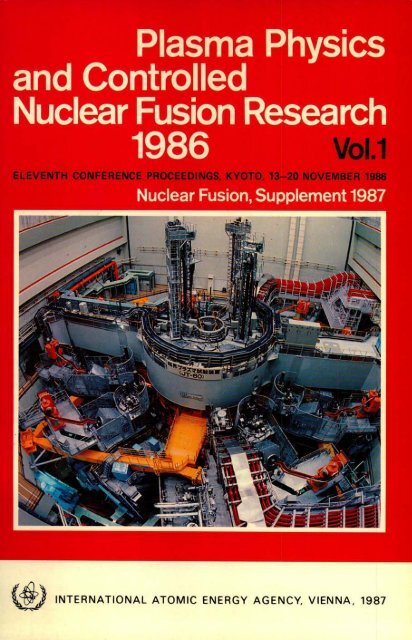
The cover picture shows JT-60, one of the largest operational tokamaks.<br />
By courtesy of the Japan Atomic Energy Research Institute, Tokyo.
PLASMA PHYSICS<br />
AND CONTROLLED<br />
NUCLEAR FUSION RESEARCH<br />
1986<br />
VOLUME 1
The following States are Members of the International Atomic Energy Agency:<br />
AFGHANISTAN<br />
ALBANIA<br />
ALGERIA<br />
ARGENTINA<br />
AUSTRALIA<br />
AUSTRIA<br />
BANGLADESH<br />
BELGIUM<br />
BOLIVIA<br />
BRAZIL<br />
BULGARIA<br />
BURMA<br />
BYELORUSSIAN SOVIET<br />
SOCIALIST REPUBLIC<br />
CAMEROON<br />
CANADA<br />
CHILE<br />
CHINA<br />
COLOMBIA<br />
COSTA RICA<br />
COTE D'lVOIRE<br />
CUBA<br />
CYPRUS<br />
CZECHOSLOVAKIA<br />
DEMOCRATIC KAMPUCHEA<br />
DEMOCRATIC PEOPLE'S<br />
REPUBLIC OF KOREA<br />
DENMARK<br />
DOMINICAN REPUBLIC<br />
ECUADOR<br />
EGYPT<br />
EL SALVADOR<br />
ETHIOPIA<br />
FINLAND<br />
FRANCE<br />
GABON<br />
GERMAN DEMOCRATIC REPUBLIC<br />
GERMANY, FEDERAL REPUBLIC OF<br />
GHANA<br />
GREECE<br />
GUATEMALA<br />
HAITI<br />
HOLY SEE<br />
HUNGARY<br />
ICELAND<br />
INDIA<br />
INDONESIA<br />
IRAN, ISLAMIC REPUBLIC OF<br />
IRAQ<br />
IRELAND<br />
ISRAEL<br />
ITALY<br />
JAMAICA<br />
JAPAN<br />
JORDAN<br />
KENYA<br />
KOREA, REPUBLIC OF<br />
KUWAIT<br />
LEBANON<br />
LIBERIA<br />
LIB YAN ARAB JAMAHIRIYA<br />
LIECHTENSTEIN<br />
LUXEMBOURG<br />
MADAGASCAR<br />
MALAYSIA<br />
MALI<br />
MAURITIUS<br />
MEXICO<br />
MONACO<br />
MONGOLIA<br />
MOROCCO<br />
NAMIBIA<br />
NETHERLANDS<br />
NEW ZEALAND<br />
NICARAGUA<br />
NIGER<br />
NIGERIA<br />
NORWAY<br />
PAKISTAN<br />
PANAMA<br />
PARAGUAY<br />
PERU<br />
PHILIPPINES<br />
POLAND<br />
PORTUGAL<br />
QATAR<br />
ROMANIA<br />
SAUDI ARABIA<br />
SENEGAL<br />
SIERRA LEONE<br />
SINGAPORE<br />
SOUTH AFRICA<br />
SPAIN<br />
SRI LANKA<br />
SUDAN<br />
SWEDEN<br />
SWITZERLAND<br />
SYRIAN ARAB REPUBLIC<br />
THAILAND<br />
TUNISIA<br />
TURKEY<br />
UGANDA<br />
UKRAINIAN SOVIET SOCIALIST<br />
REPUBLIC<br />
UNION OF SOVIET SOCIALIST<br />
REPUBLICS<br />
UNITED ARAB EMIRATES<br />
UNITED KINGDOM OF GREAT<br />
BRITAIN AND NORTHERN<br />
IRELAND<br />
UNITED REPUBLIC OF<br />
TANZANIA<br />
UNITED STATES OF AMERICA<br />
URUGUAY<br />
VENEZUELA<br />
VIET NAM<br />
YUGOSLAVIA<br />
ZAIRE<br />
ZAMBIA<br />
ZIMBABWE<br />
The Agency's Statute was approved on 23 October 1956 by the Conference on the Statute of the<br />
<strong>IAEA</strong> held at United Nations Headquarters, New York; it entered into force on 29 July 1957. The<br />
Headquarters of the Agency are situated in Vienna. Its principal objective is "to accelerate <strong>and</strong> enlarge the<br />
contribution of atomic energy to peace, health <strong>and</strong> prosperity throughout the world".<br />
© <strong>IAEA</strong>, 1987<br />
Permission to reproduce or translate the information contained in this publication may be obtained<br />
by writing to the International Atomic Energy Agency, Wagramerstrasse 5, P.O. Box 100, A-1400 Vienna,<br />
Austria.<br />
Printed by the <strong>IAEA</strong> in Austria<br />
June 1987
NUCLEAR FUSION, SUPPLEMENT 1987<br />
PLASMA PHYSICS<br />
AND CONTROLLED<br />
NUCLEAR FUSION RESEARCH<br />
1986<br />
PROCEEDINGS OF THE<br />
ELEVENTH INTERNATIONAL CONFERENCE ON PLASMA PHYSICS<br />
AND CONTROLLED NUCLEAR FUSION RESEARCH<br />
HELD BY THE<br />
INTERNATIONAL ATOMIC ENERGY AGENCY<br />
IN KYOTO, 13-20 NOVEMBER 1986<br />
In three volumes<br />
VOLUME 1<br />
INTERNATIONAL ATOMIC ENERGY AGENCY<br />
VIENNA, 1987
PLASMA PHYSICS AND CONTROLLED NUCLEAR FUSION RESEARCH 1986<br />
<strong>IAEA</strong>, VIENNA, 1987<br />
STI/PUB/723<br />
ISBN 92-0-130087-5
FOREWORD<br />
The <strong>IAEA</strong> Conferences on Plasma Physics <strong>and</strong> Controlled <strong>Nuclear</strong> Fusion<br />
Research, organized biennially, are the largest <strong>and</strong> most important meetings in the<br />
field. They are a scientific forum not only for the presentation of the best results<br />
achieved in all laboratories performing fusion research but also for the co-ordination<br />
of international fusion efforts.<br />
The Eleventh Conference, which was organized in co-operation with the<br />
Japanese Atomic Energy Research Institute, was attended by about 650 participants<br />
<strong>and</strong> observers representing 32 countries <strong>and</strong> two international organizations. About<br />
200 papers were accepted for oral <strong>and</strong> poster presentations. The Conference opened<br />
with the traditional Artsimovich Memorial Lecture.<br />
The Eleventh Conference became an important event for fusion scientists <strong>and</strong><br />
engineers all over the world, for two special reasons. First, on the basis of the results<br />
achieved on several experimental devices, the plans for reaching plasma ignition<br />
within the next two years were presented. Second, the Conference not only marked<br />
25 years of international co-operation under the auspices of the <strong>IAEA</strong> but also<br />
represented the starting point for a new international venture — an international<br />
thermonuclear experimental reactor.<br />
These Proceedings, which include all the technical papers <strong>and</strong> five Conference<br />
summaries, are published in English as a supplement to the <strong>IAEA</strong> journal <strong>Nuclear</strong><br />
Fusion.<br />
The Agency promotes close international co-operation among plasma <strong>and</strong> fusion<br />
physicists <strong>and</strong> engineers of all countries by organizing these regular conferences on<br />
controlled nuclear fusion <strong>and</strong> by holding seminars, workshops <strong>and</strong> specialists<br />
meetings on appropriate topics. It is hoped that the present publication, as part of<br />
these activities, will contribute to the rapid demonstration of fusion power as one of<br />
the world's future energy resources.
EDITORIAL NOTE<br />
The Proceedings have been edited by the editorial staff of the <strong>IAEA</strong> to the extent considered<br />
necessary for the reader's assistance. The views expressed remain, however, the responsibility of the<br />
named authors or participants. In addition, the views are not necessarily those of the governments of<br />
the nominating Member States or of the nominating organizations.<br />
Although great care has been taken to maintain the accuracy of information contained in this<br />
publication, neither the <strong>IAEA</strong> nor its Member States assume any responsibility for consequences which<br />
may arise from its use.<br />
The use of particular designations of countries or territories does not imply any judgement by the<br />
publisher, the <strong>IAEA</strong>, as to the legal status of such countries or territories, of their authorities <strong>and</strong> institutions<br />
or of the delimitation of their boundaries.<br />
The mention of names of specific companies or products (whether or not indicated as registered)<br />
does not imply any intention to infringe proprietary rights, nor should it be construed as an endorsement<br />
or recommendation on the part of the <strong>IAEA</strong>.<br />
The authors are responsible for having obtained the necessary permission for the <strong>IAEA</strong> to<br />
reproduce, translate or use material from sources already protected by copyrights.<br />
Material prepared by authors who are in contractual relation with governments is copyrighted<br />
by the <strong>IAEA</strong>, as publisher, only to the extent permitted by the appropriate national regulations.
CONTENTS OF VOLUME 1<br />
ARTSIMOVICH MEMORIAL LECTURE <strong>and</strong> TOKAMAK EXPERIMENTS<br />
(Session A)<br />
Artsimovich Memorial Lecture (<strong>IAEA</strong>-CN-47/A-0) 3<br />
J.F. Clarke<br />
Recent experiments in JT-60 (<strong>IAEA</strong>-CN-47/A-I-1) 11<br />
JT-60 Team: T. Abe, H. Aikawa, H. Akaoka, H. Akasaka, M. Akiba,<br />
N. Akino, T. Akiyama, T. Ando, K. Annoh, N. Aoyagi, K. Arakawa,<br />
M. Araki, K. Arimoto, M. Azumi, S. Chiba, M. Dairaku, N. Ebiswa,<br />
T. Fujii, T. Fukuda, H. Furukawa, K. Hamamatsu, K. Hayashi,<br />
M. Hara, K. Haraguchi, H. Hiratsuka, T. Hirayama, S. Hiroki,<br />
K. Hiruta, M. Honda, H. Horiike, R. Hosoda, N. Hosogane, Y. Iida,<br />
T. Iijima, K. Ikeda, Y. Ikeda, T. Imai, T. Inoue, N. Isaji, M. Isaka,<br />
S. Ishida, N. Itige, T. Ito, Y. Ito, A. Kaminaga, M. Kawai,<br />
Y. Kawamata, K. Kawasaki, K. Kikuchi, M. Kikuchi, H. Kimura,<br />
T. Kimura, H. Kishimoto, K. Kitahara, S. Kitamura, A. Kitsunezaki,<br />
K. Kiyono, N. Kobayashi, K. Kodama, Y. Koide, T. Koike,<br />
M. Komata, I. Kondo, S. Konoshima, H. Kubo, S. Kunieda,<br />
S. Kurakata, K. Kurihara, M. Kuriyama, T. Kuroda, M. Kusaka,<br />
Y. Kusama, S. Maehara, K. Maeno, S. Mase, S. Matsuda,<br />
M. Matsukawa, T. Matsukawa, M. Matsuoka, N. Miya, K. Miyati,<br />
Y. Miyo, K. Mizuhashi, M. Mizuno, R. Murai, Y. Murakami, M. Muto,<br />
M. Nagami, A. Nagashima, K. Nagashima, T. Nagashima, S. Nagaya,<br />
H. Nakamura, Y. Nakamura, M. Nemoto, Y. Neyatani, S. Niikura,<br />
H. Ninomiya, T. Nishitani, H. Nomata, K. Obara, N. Ogiwara,<br />
Y. Ohara, K. Ohasa, T. Ohga, H. Ohhara, M. Ohkubo, T. Ohshima,<br />
K. Ohta, M. Ohta, M. Ohtaka, Y. Ohuchi, A. Oikawa, H. Okumura,<br />
Y. Okumura, K. Omori, S. Omori, Y. Omori, T. Ozeki, M. Saigusa,<br />
K. Sakamoto, A. Sakasai, S. Sakata, M. Satou, M. Sawahata,<br />
M. Seimiya, M. Seki, S. Seki, K. Shibanuma, R. Shimada, K. Shimizu,<br />
M. Shimizu, Y. Shimomura, S. Shinozaki, H. Shirai, H. Shirakata,<br />
M. Shitomi, K. Suganuma, T. Sugie, T. Sugiyama, H. Sunaoshi,<br />
K. Suzuki, M. Suzuki, M. Suzuki, N. Suzuki, S. Suzuki, Y. Suzuki,<br />
H. Takahashi, M. Takahashi, S. Takahashi, T. Takahashi,<br />
M. Takasaki, M. Takatsu, A. Takeshita, H. Takeuchi, S. Tamura,<br />
S. Tanaka, K. Tani, M. Terakado, T. Terakado, K. Tobita,
T. Tokutake, T. Totsuka, N. Toyoshima, H. Tsuda, T. Tsugita, S. Tsuji,<br />
Y. Tsukahara, M. Tsuneoka, K. Uehara, M. Umehara, Y. Uramoto,<br />
H. Usami, K. Ushigusa, K. Usui, J. Yagyu, K. Yamada, M. Yamamoto,<br />
0. Yamashita, Y. Yamashita, K. Yano, T. Yasukawa, K. Yokokura,<br />
H. Yokomizo, H. Yoshida, M. Yoshikawa, Y. Yoshinari, R. Yoshino,<br />
1. Yonekawa, K. Watanabe<br />
Discussion 29<br />
JET latest results <strong>and</strong> future prospects (<strong>IAEA</strong>-CN-47/A-I-2) 31<br />
JET Team: H. Altmann, R.J. Anderson, J. Arbez, W. Bailey,<br />
D.V. Bartlett, B. Beaumont, G. Beaumont, K. Behringer, P. Bertoldi,<br />
E. Bertolini, C.H. Best, V. Bhatnagar, R.J. Bickerton, A. Boileau,<br />
F. Bombarda, T. Bonicelli, S. Booth, A. Boschi, G. Bosia, M. Botman,<br />
H. Brelen, H. Brinkschulte, M.L. Browne, M. Brusati, T. Budd,<br />
M. Bures, P. Butcher, H. Buttgereit, D. Cacaut, C. Caldwell-Nichols,<br />
J.D. Callen, D.J. Campbell, J. Carwardine, G. Celentano,<br />
CD. Challis, A. Cheetham, J.P. Christiansen, C. Christodoulopoulos,<br />
P. Chuilon, R. Claesen, J.P. Coad, S.A. Cohen, M. Cooke, J.G. Cordey,<br />
W. Core, S. Corti, A.E. Costley, G.A. Cottrell, M. Cox, C. David,<br />
J. Dean, L. de Kock, E. Deksnis, G.B. Denne, G. Deschamps,<br />
K.J. Dietz, J. Dobbing, S.E. Dorling, D.F. Diichs, G. Duesing,<br />
P. A. Duperrex, H. Duquenoy, A.W. Edwards, J. Ehrenberg,<br />
W. Engelhardt, S.K. Erents, F. Erhorn, B.T. Eriksson, M. Evrard,<br />
H. Falter, N. Foden, M.J. Forrest, C. Froger, K. Fullard,<br />
G. Fussmann, M. Gadeberg, A. Galetsas, A. Gallacher, D. Gambier,<br />
R. Giannella, A. Giannelli, A. Gibson, R.D. Gill, A. Goede,<br />
A. Gondhalekar, C. Gordon, C. Gormezano, N.A. Gottardi,<br />
C.W. Gowers, R. Granetz, B. Green, S. Gregoli, F.S. Griph,<br />
R. Haange, J.H. Hamnen, C.J. Hancock, P.J. Harbour, N.C. Hawkes,<br />
P. Haynes, T. Hellsten, J.L. Hemmerich, R. Hemsworth, F. Hendriks,<br />
R.F. Herzog, L. Horton, J. How, M. Huart, A. Hubbard, J. Hugill,<br />
M. Hugon, M. Huguet, B. Ingram, H. Jacket, J. Jacquinot,<br />
Z. Jankowicz, O.N. Jarvis, E.M. Jones, P. Jones, T.T.C. Jones,<br />
C. Jupen, E. Kdllne, J. Kallne, O. Kaneko, A. Kaye, B.E. Keen,<br />
M. Keilhacker, G. Kinahan, S. Kissel, A. Konstantellos, M. Kovanen,<br />
U. Kuphnapfel, P. Kupschus, P. Lallia, J.R. Last, L. Lauro-Taroni,<br />
K.D. Lawson, E. Lazzaro, R.C. Lobel, P.J. Lomas,<br />
N. Lopes-Cardozo, M. Lorenz-Gottardi, C. Lowry, G. Magyar,<br />
D. Maisonnier, M. Malacarne, V. Marchese, P. Massmann,<br />
G.M. McCracken, P. McCullen, M.J. Mead, P. Meriguet, V. Merlo,<br />
V. Mertens, S. Mills, P. Millward, A. Moissonnier, P.L. Mondino,<br />
D. Moreau, P.D. Morgan, E.R. Mutter, D. Murmann, G. Murphy,<br />
M.F. Nave, L. Nickesson, P. Nielsen, P. Noll, S. Nowak, W. Obert,<br />
M. Olsson, J. O'Rourke, M.G. Pacco, J. Paillere, S. Papastergiou,
J. Partridge, D. Pasini, N.J. Peacock, M. Pescatore, J. Plancoulaine,<br />
J.-P. Poffe, R. Prentice, T. Raimondi, J. Ramette, C. Raymond,<br />
P.H. Rebut, J. Removille, W. Riediker, R. Roberts, D.C. Robinson,<br />
A. Rolfe, R. T. Ross, G. Rupprecht, R. Rushton, H. C. Sack,<br />
G. Sadler, J. Sqffert, N. Salmon, F. S<strong>and</strong>, A. Santagiustina,<br />
R. Saunders, M. Schmid, F.C. Schuller, K. Selin, R. Shaw, A. Sibley,<br />
D. Sigournay, R. Sillen, F. Simonet, R. Simonini, P. Smeulders,<br />
J.A. Snipes, K. Sonnenberg, L. Sonnerup, M.F. Stamp, C.A. Steed,<br />
D. Stork, P.E. Stott, T.E. Stringer, D.R. Summers, H.P. Summers,<br />
A.J. Tagle, G. Tallents, A. Tonga, A. Taroni, A. Terrington, A. Tesini,<br />
P.R. Thomas, E. Thompson, K. Thomsen, F. Tibone, R. Tivey,<br />
T.N. Todd, P. Trevalion, M. Tschudin, B.J. Tubbing, P. Twynam,<br />
E. Usselmann, H. Van der Beken, J.E. Van Montfoort,<br />
M. von Hellermann, J. von Seggern, T. Wade, C. Walker,<br />
B.A. Wall<strong>and</strong>er, M. Walravens, K. Walter, M.L. Watkins,<br />
M. Watson, D. Webberley, A. Weller, J.A. Wesson, J. Wilks,<br />
T. Winkel, C. Woodward, M. Wykes, D. Young, L. Zannelli, J. W. Zwart<br />
Dicussion 48<br />
TFTR plasma regimes (<strong>IAEA</strong>-CN-47/A-I-3) 51<br />
R.J. Hawryluk, V. Arunasalam, M.G. Bell, M. Bitter, W.R. Blanchard,<br />
N.L. Bretz, R. Budny, C.E. Bush, J.D. Callen, S.A. Cohen,<br />
S.K. Combs, S.L. Davis, D.L. Dimock, H.F. Dylla, P.C. Efthimion,<br />
L.C. Emerson, A.C. Engl<strong>and</strong>, H.P. Eubank, R.J. Fonck,<br />
E. Fredrickson, H.P. Furth, G. Gammel, R.J. Goldston, B. Grek,<br />
L.R. Grisham, G. Hammett, W.W. Heidbrink, H.W. Hendel,<br />
K.W. Hill, E. Hinnov, S. Hiroe, H. Hsuan, R.A. Hulse, K.P. Jaehnig,<br />
D. Jassby, F.C. Jobes, D.W. Johnson, L.C. Johnson, R. Kaita,<br />
R. Kamperschroer, S.M. Kaye, S.J. Kilpatrick, R.J. Knize, H. Kugel,<br />
P.H. LaMarche, B. LeBlanc, R. Little, C.H. Ma, D.M. Manos,<br />
D.K. Mansfield, R.T. McCann, M.P. McCarthy, D.C. McCune,<br />
K. McGuire, D.H. McNeill, D.M. Meade, S.S. Medley,<br />
D.R. Mikkelsen, S.L. Milora, W. Morris, D. Mueller, V. Mukhovatov,<br />
E.B. Nieschmidt, J. O'Rourke, D.K. Owens, H. Park, N. Pomphrey,<br />
B. Prichard, A.T. Ramsey, M.H. Redi, A.L. Roquemore,<br />
P.H. Rutherford, N.R. Sauthoff, G. Schilling, J. Schivell,<br />
G.L. Schmidt, S.D. Scott, S. Sesnic, J.C. Sinnis, F.J. Stauffer,<br />
B.C. Stratton, G.D. Tait, G. Taylor, J.R. Timberlake, H.H. Towner,<br />
M. Ulrickson, V. Vershkov, S. Von Goeler, F. Wagner, R. Wiel<strong>and</strong>,<br />
J.B. Wilgen, M. Williams, K.L. Wong, S. Yoshikawa, R. Yoshino,<br />
K.M. Young, M.C. Zarnstorff, V.S. Zaveryaev, S.J. Zweben<br />
Discussion 63
Experimental studies in JET with magnetic separatrix<br />
(<strong>IAEA</strong>-CN-47/A-I-5) 65<br />
A. Tanga, D.V. Bartlett, K. Behringer, R.J. Bickerton, A. Cheetham,<br />
J.G. Cordey, A. Gibson, N.A. Gottardi, A. Gondhalekar, P.J. Harbour,<br />
H. Jaeckel, M. Keilhacker, E. Lazzaro, V. Martens, P. Noll, S. Nowak,<br />
F.C. Schuller, A.J. Tagle, A. Taroni, P.R. Thomas, F. Tibone<br />
Discussion 73<br />
Energy confinement <strong>and</strong> profile consistency in TFTR<br />
(<strong>IAEA</strong>-CN-47/A-H-1) 75<br />
R.J. Goldston, V. Arunasalam, M.G. Bell, M. Bitter, W.R. Blanchard,<br />
N.L. Bretz, R- Budny, C.E. Bush, J.D. Callen, S.A. Cohen,<br />
S.K. Combs, S.L. Davis, D.L. Dimock, H.F. Dylla, P.C. Efthimion,<br />
L.C. Emerson, A.C. Engl<strong>and</strong>, H.P. Eubank, R.J. Fonck, E. Fredrickson,<br />
H.P. Furth, G. Gammel, B. Grek, L.R. Grisham, G. Hammett,<br />
R.J. Hawryluk, W.W. Heidbrink, D.B. Heifetz, H.W. Hendel, K.W. Hill,<br />
E. Hinnov, 5. Hiroe, H. Hsuan, R.A. Hulse, K.P. Jaehnig, D. Jassby,<br />
F.C. Jobes, D.W. Johnson, L.C. Johnson, R. Kaita, R. Kamperschroer,<br />
S.M. Kaye, S.J. Kilpatrick, R.J. Knize, H. Kugel, P.H. LaMarche,<br />
B. LeBlanc, R. Little, C.H. Ma, D.M. Manos, D.K. Mansfield,<br />
R.T. McCann, M.P. McCarthy, D.C. McCune, K. McGuire,<br />
D.H. McNeill, D.M. Meade, 5.5. Medley, D.R. Mikkelsen, S.L. Milora,<br />
W. Morris, D. Mueller, V. Mukhovatov, E.B. Nieschmidt, J. O'Rourke,<br />
D.K. Owens, H. Park, N. Pomphrey, B. Prichard, A.T. Ramsey,<br />
M.H. Redi, A.L. Roquemore, P.H. Rutherford, N.R. Sauthoff,<br />
G. Schilling, J. Schivell, G.L. Schmidt, S.D. Scott, S. Sesnic,<br />
J.C. Sinnis, F.J. Stauffer, B.C. Stratton, G.D. Tait, G. Taylor,<br />
J.R. Timberlake, H.H. Towner, M. Ulrickson, V. Vershkov,<br />
5. Von Goeler, F. Wagner, R. Wiel<strong>and</strong>, J.B. Wilgen, M. Williams,<br />
K.L. Wong, S. Yoshikawa, R. Yoshino, K.M. Young, M.C. Zarnstorff,<br />
V.S. Zaveryaev, S.J. Zweben<br />
Discussion 86<br />
Energy <strong>and</strong> particle confinement of JT-60 plasmas with high power<br />
heating (<strong>IAEA</strong>-CN-47/A-II-2) 89<br />
JT-60 Team: T. Abe, H. Aikawa, H. Akaoka, H. Akasaka, M. Akiba,<br />
N. Akino, T. Akiyama, T. Ando, K. Annoh, N. Aoyagi, K. Arakawa,<br />
M. Araki, K. Arimoto, M. Azumi, 5. Chiba, M. Dairaku, N. Ebiswa,<br />
T. Fujii, T. Fukuda, H. Furukawa, K. Hamamatsu, K. Hayashi,<br />
M. Hara, K. Haraguchi, H. Hiratsuka, T. Hirayama, S. Hiroki,<br />
K. Hiruta, M. Honda, H. Horiike, R. Hosoda, N. Hosogane, Y. lida,<br />
T. Iijima, K. Ikeda, Y. Ikeda, T. Imai, T. Inoue, N. Isaji, M. Isaka,<br />
5. Ishida, N. Itige, T. Ito, Y. Ito, A. Kaminaga, M. Kawai,<br />
Y. Kawamata, K. Kawasaki, K. Kikuchi, M. Kikuchi, H. Kimura,<br />
T. Kimura, H. Kishimoto, K. Kitahara, 5. Kitamura, A. Kitsunezaki,
K. Kiyono, N. Kobayashi, K. Kodama, Y. Koide, T. Koike,<br />
M. Komata, I. Kondo, S. Konoshima, H. Kubo, S. Kunieda,<br />
S. Kurakata, K. Kurihara, M. Kuriyama, T. Kuroda, M. Kusaka,<br />
Y. Kusama, S. Maehara, K. Maeno, S. Mase, S. Matsuda,<br />
M. Matsukawa, T. Matsukawa, M. Matsuoka, N. Miya, K. Miyati,<br />
Y. Miyo, K. Mizuhashi, M. Mizuno, R. Murai, Y. Murakami, M. Muto,<br />
M. Nagami, A. Nagashima, K. Nagashima, T. Nagashima, S. Nagaya,<br />
H. Nakamura, Y. Nakamura, M. Nemoto, Y. Neyatani, S. Niikura,<br />
H. Ninomiya, T. Nishitani, H. Nomata, K. Obara, N. Ogiwara,<br />
Y. Ohara, K. Ohasa, T. Ohga, H. Ohhara, M. Ohkubo, T. Ohshima,<br />
K. Ohta, M. Ohta, M. Ohtaka, Y. Ohuchi, A. Oikawa, H. Okumura,<br />
Y. Okumura, K. Omori, S. Omori, Y. Omori, T. Ozeki, M. Saigusa,<br />
K. Sakamoto, A. Sakasai, S. Sakata, M. Satou, M. Sawahata,<br />
M. Seimiya, M. Seki, S. Seki, K. Shibanuma, R. Shimada, K. Shimizu,<br />
M. Shimizu, Y. Shimomura, S. Shinozaki, H. Shirai, H. Shirakata,<br />
M. Shitomi, K. Suganuma, T. Sugie, T. Sugiyama, H. Sunaoshi,<br />
K. Suzuki, M. Suzuki, M. Suzuki, N. Suzuki, S. Suzuki, Y. Suzuki,<br />
H. Takahashi, M. Takahashi, S. Takahashi, T. Takahashi,<br />
M. Takasaki, M. Takatsu, A. Takeshita, H. Takeuchi, S. Tamura,<br />
S. Tanaka, K. Tani, M. Terakado, T. Terakado, K. Tobita,<br />
T. Tokutake, T. Totsuka, N. Toyoshima, H. Tsuda, T. Tsugita, S. Tsuji,<br />
Y. Tsukahara, M. Tsuneoka, K. Uehara, M. Umehara, Y. Uramoto,<br />
H. Usami, K. Ushigusa, K. Usui, J. Yagyu, K. Yamada, M. Yamamoto,<br />
0. Yamashita, Y. Yamashita, K. Yano, T. Yasukawa, K. Yokokura,<br />
H. Yokomizo, H. Yoshida, M. Yoshikawa, Y. Yoshinari, R. Yoshino,<br />
1. Yonekawa, K. Watanabe<br />
Discussion 98<br />
Energy confinement in JET with Ohmic heating <strong>and</strong> strong<br />
auxiliary heating (<strong>IAEA</strong>-CN-47/A-II-3) 99<br />
J.G. Cordey, D.V. Bartlett, V. Bhatnagar, R.J. Bickerton, M. Bures,<br />
J.D. Callen, D.J. Campbell, CD. Challis, J.P. Christiansen, S. Corti,<br />
A.E. Costley, G.A. Cornell, G. Duesing, J. Fessey, M. Gadeberg,<br />
A. Gibson, A. Gondhalekar, N.A. Gottardi, C.W. Gowers,<br />
M. von Hellermann, F. Hendriks, L. Horton, H. Jdckel, J. Jacquinot,<br />
O.N. Jarvis, T.T.C. Jones, E. Kallne, J. Kallne, M. Keilhacker,<br />
S. Kissel, L. de Kock, P. Lallia, E. Lazzaro, P.J. Lomas,<br />
N. Lopes-Cardozo, P.D. Morgan, P. Nielsen, J. O'Rourke,<br />
R. Prentice, R. T. Ross, G. Sadler, F. C. Schuller, A. Stabler,<br />
P. Smeulders, M.F. Stamp, D. Stork, P.E. Stott, D.R. Summers,<br />
A. Tonga, P.R. Thomas, E. Thompson, K. Thomsen, G. Tonetti,<br />
B.J. Tubbing, M.L. Watkins<br />
Discussion 109
Effect of p <strong>and</strong> j profiles on energy confinement in ECH experiments<br />
on T-10 (<strong>IAEA</strong>-CN-47/A-II-4) Ill<br />
V. V. Alikaev, A.A. Bagdasarov, E.L. Berezovskij, A.B. Berlizov,<br />
G.A. Bobrovskij, A.A. Borshchegovskij, N.L. Vasin, A.N.I. Vertiporokh,<br />
V.V. Volkov, E.P. Gorbunov, Yu.A. Gorelov, Yu.V. Esipchuk,<br />
S.L. Efremov, V.S. Zaveryaev, V.I. Win, A.Ya. Kislov, P.E. Kovrov,<br />
S.Yu. Luk'yanov, Yu.S. Maksimov, A.A. Medvedev, G.E. Notkin,<br />
A.B. Pimenov, V.I. Poznyak, I.A. Popov, S.V. Popovichev,<br />
K.A. Razumova, P.V. Savrukhin, E.V. Sitar, A.M. Solntsev,<br />
M.M. Stepanenko, V.S. Strelkov, A.V. Tarakanov, K.N. Tarasyan,<br />
K.B. Titishov, V.M. Trukhin, G.S. Yaramyshev, S.N. Vlasov,<br />
A.L. Gol'denberg, V.A. Markelov, V.A. Flyagin, B.V. Shishkin<br />
Discussion 123<br />
Achievement of regimes with high density, low qa <strong>and</strong> good confinement<br />
on ASDEX (<strong>IAEA</strong>-CN-47/A-II-5) 125<br />
H. Niedermeyer, F. Wagner, G. Becker, K. Bttchl, A. Eberhagen,<br />
G. Fussmann, O. Gehre, G. von Gierke, O. Gruber, G. Janeschitz,<br />
M. Kaufrnann, K. Lackner, R. Lang, V. Mertens, H. Murmann,<br />
W. S<strong>and</strong>mann, E. Speth, K. Steinmetz, G. Vlases, H.S. Bosch,<br />
H. Brocken, J. Gerhardt, E. Glock, G. Haas, J. Hofrnann,<br />
A. Izvozchikov, F. Karger, M. Keilhacker, O. Klttber, M. Kornherr,<br />
M. Lenoci, G. Lisitano, F. Mast, KM. Mayer, K. McCormick,<br />
D. Meisel, E.R. Muller, Z.A. Pietrzyk, W. Poschenrieder, H. Rapp,<br />
H. Riedler, H. Rohr, J. Roth, F. Ryter, F. Schneider, C. Setzensack,<br />
G. Siller, P. Smeulders, F.X. Soldner, K.-H. Steuer, O. Vollmer, D. Zasche<br />
Discussion 136<br />
Studies of the regime of improved particle <strong>and</strong> energy confinement<br />
following pellet injection into Alcator C (<strong>IAEA</strong>-CN-47/A-III-l) 139<br />
M. Greenwald, M. Besen, F. Camacho, C. Fiore, M. Foord,<br />
R. G<strong>and</strong>y, C. Gomez, R. Granetz, D. Gwinn, S. Knowlton,<br />
B. LaBombard, B. Lipschultz, H. Manning, E. Marmar, S.C. McCool,<br />
J. Parker, R. Parker, R. Petrasso, P. Pribyl, J. Rice, D. Sigtnar,<br />
Y. Takase, J. Terry, R. Watterson, S. Wolfe<br />
Discussion 149<br />
Confinement studies of additionally heated plasma in the<br />
JFT-2M tokamak (<strong>IAEA</strong>-CN-47/A-III-2) 151<br />
K. Odajima, A. Funahashi, K. Hoshino, S. Kasai, T. Kawakami,<br />
H. Kawashima, T. Matoba, T. Matsuda, H. Matsumoto, Y. Miura,<br />
M. Mori, H. Ogawa, T. Ogawa, H. Ohtsuka, S. Sengoku, T. Shoji,<br />
N. Suzuki, H. Tamai, Y. Uesugi, T. Yamamoto, T. Yamauchi,<br />
M. Hasegawa, S. Takada, K. Hasegawa, A. Honda, I. Ishibori,<br />
T. Kashimura, Y. Kashiwa, M. Kazawa, K. Kikuchi, Y. Matsuzaki,
K. Ohuchi, H. Okano, T. Shibata, T. Shibuya, T. Shiina, K. Suzuki,<br />
T. Tani, K. Yokoyama<br />
Discussion 157<br />
Initial results from the DIII-D tokamak (<strong>IAEA</strong>-CN-47/A-III-3) 159<br />
J. Luxon, P. Anderson, F. Batty, C. Baxi, G. Bramson, N. Brooks,<br />
B. Brown, B. Burley, K.H. Burrell, R. Callis, G. Campbell, T. Carlstrom,<br />
A. Colleraine, J. Cummings, J. Davis, J. DeBoo, S. Ejima,<br />
R. Evanko, H. Fukumoto, R. Gallix, J. Gillel<strong>and</strong>, T. Glad, P. Gohil,<br />
A. Gootgeld, R.J. Groebner, S. Hanai, J. Haskovec, E. Heckman,<br />
M. Heiberger, F.J. Helton, P. Henline, D. Hill, D. Hoffman,<br />
E. Hoffmann, R. Hong, N. Hosogane, C. Hsieh, G.L. Jackson, G. Jahns,<br />
G. Janeschitz, E. Johnson, A. Kellman, J.S. Kim, J. Kohli, A. Langhorn,<br />
L. Lao, P. Lee, S. Lightner, J. Lohr, M. Mahdavi, M. Mayberry,<br />
B. McHarg, T. McKelvey, R. Miller, C.P. Moeller, D. Moore, A. Nerem,<br />
P. Noll, T. Ohkawa, N. Ohyabu, T. Osborne, D. Overskei, P. Petersen,<br />
T. Petrie, J. Phillips, R. Prater, J. Rawls, E. Reis, D. Remsen,<br />
P. Riedy, P. Rock, K. Schaubel, D. Schissel, J. Scoville, R. Seraydarian,<br />
M. Shimada, T. Shoji, B. Sleaford, J. Smith, Jr., P. Smith, T. Smith,<br />
R.T. Snider, R.D. Stambaugh, R. Stav, H. St. John, R. Stockdale,<br />
E.J. Strait, R. Street, T.S. Taylor, J. Tooker, M. Tupper, S.K. Wong,<br />
S. Yamaguchi<br />
Discussion 168<br />
Pellet injection results during TFTR Ohmic <strong>and</strong> neutral beam heating<br />
experiments (<strong>IAEA</strong>-CN-47/A-III-4) 171<br />
G.L. Schmidt, S.L. Milora, V. Arunasalam, M.G. Bell, M. Bitter,<br />
C.E. Bush, S.K. Combs, H.F. Dylla, P.C. Efthimion, E. Fredrickson,<br />
R.J. Goldston, B. Grek, L.R. Grisham, G. Hammett, R.J. Hawryluk,<br />
W.W. Heidbrink, H.W. Hendel, K.W. Hill, H. Hsuan, D.W. Johnson,<br />
L.C. Johnson, P.H. LaMarche, R. Little, D.K. Mansfield, D.C. McCune,<br />
K. McGuire, D.M. Meade, S.S. Medley, D. Mueller, W. Morris,<br />
E.B. Nieschmidt, J. O'Rourke, D.K. Owens, H. Park, A.T. Ramsey,<br />
M.H. Redi, J. Schivell, D. Schuresko, T. Senko, S. Sesnic,<br />
F.J. Stauffer, B.C. Stratton, G.D. Tait, G. Taylor, J.R. Timberlake,<br />
H.H. Towner, M. Ulrickson, R. Wiel<strong>and</strong>, J.B. Wilgen, M. Williams,<br />
M.C. Zarnstorff, S.J. Zweben<br />
Discussion 177<br />
Fast ion losses <strong>and</strong> plasma confinement in TFR during neutral<br />
beam injection (<strong>IAEA</strong>-CN-47/A-III-5) 179<br />
Equipe TFR<br />
Discussion 185<br />
Particle <strong>and</strong> thermal transport, <strong>and</strong> resonant field experiments in TEXT<br />
(<strong>IAEA</strong>-CN-47/A-III-6) 187<br />
A.J. Wootton, R.D. Bengtson, J.A. Boedo, R.V. Bravenec, K.L. Empson,
K.W. Gentle, W.L. Hodge, C.C. Klepper, J. Porter, A. Macmahon,<br />
S.C. McCool, W.H. Miner, D.M. Patterson, P.E. Phillips, B. Richards,<br />
C.P. Ritz, T.L Rhodes, D.W. Ross, W.L. Rowan, J.C. Wiley,<br />
D.L. Brower, S.K. Kim, N.C. Luhmann, W.A. Peebles,<br />
J.S. DeGrassie, T.E. Evans, G.L. Jackson, N. Ohyabu, P.H. Diamond,<br />
T.S. Hahm, P.W. Terry, Shaping Fan, Yexi He, J.C. Forster,<br />
R.L. Hickok, P.M. Schoch, G. Haas, F. Karger, Xuehua Yu,<br />
Shaobai Zheng, R. C. Isler<br />
Discussion 194<br />
Impurity production mechanisms <strong>and</strong> behaviour during additional heating<br />
in JET (<strong>IAEA</strong>-CN-47/A-IV-l) 197<br />
K. Behringer, A. Boileau, F. Bombarda, G.B. Denne, W. Engelhardt,<br />
M.J. Forrest, G. Fussmann, R. Giannella, N.A. Gottardi,<br />
M. von Hellermann, L. Horton, H. Jacket, C. Jupen, E. Kdllne,<br />
K.D. Lawson, G. Magyar, G.M. McCracken, P.D. Morgan, E.R. Miiller,<br />
N.J. Peacock, J. Ramette, B. Saoutic, M.F. Stamp, H.P. Summers,<br />
G. Tallents, A. Weller<br />
Discussion 205<br />
Impurity <strong>and</strong> particle transport <strong>and</strong> control in TFTR<br />
(<strong>IAEA</strong>-CN-47/A-IV-2) 207<br />
K.W. Hill, V. Arunasalam, M.G. Bell, M. Bitter, W.R. Blanchard,<br />
N.L Bretz, R. Budny, C.E. Bush, S.A. Cohen, S.K. Combs,<br />
S.L. Davis, D.L. Dimock, H.F. Dylla, P.C. Efthimion, L.C. Emerson,<br />
A.C. Engl<strong>and</strong>, H.P. Eubank, R.J. Fonck, E. Fredrickson, H.P. Furth,<br />
G. Gammel, R.J. Goldston, B. Grek, L.R. Grisham, G. Hamrnett,<br />
R.J. Hawryluk, W. W. Heidbrink, H. W. Hendel, E. Hinnov, S. Hiroe,<br />
H. Hsuan, R.A. Hulse, K.P. Jaehnig, D. Jassby, F.C. Jobes,<br />
D.W. Johnson, L.C. Johnson, R. Kaita, R. Kamperschroer, S.M. Kaye,<br />
S.J. Kilpatrick, R.J. Knize, H. Kugel, P.H. LaMarche, B. LeBlanc,<br />
C.H. Ma, D.M. Manos, D.K. Mansfield, R.T. McCann, M.P. McCarthy,<br />
D.C. McCune, K. McGuire, D.H. McNeill, D.M. Meade, S.S. Medley,<br />
D.R. Mikkelsen, S.L. Milora, W. Morris, D. Mueller, V. Mukhovatov,<br />
E.B. Nieschmidt, J. O'Rourke, D.K. Owens, H. Park, N. Pomphrey,<br />
B. Prichard, A.T. Ramsey, M.H. Redi, A.L. Roquemore,<br />
P.H. Rutherford, N.R. Sauthoff, G. Schilling, J. Schivell,<br />
G.L. Schmidt, S.D. Scott, S. Sesnic, M. Shimada, J.C. Sinnis,<br />
F.J. Stauffer, J. Strachan, B.C. Stratton, G.D. Tait, G. Taylor,<br />
J.R. Timberlake, H.H. Towner, M. Ulrickson, V. Vershkov,<br />
S. Von Goeler, F. Wagner, R. Wiel<strong>and</strong>, J.B. Wilgen, M. Williams,<br />
K.L. Wong, S. Yoshikawa, R. Yoshino, K.M. Young, M.C. Zarnstorff,<br />
V.S. Zaveryaev, S.J. Zweben<br />
Discussion 216
Impurity <strong>and</strong> MHD behaviour in JT-60 divertor discharges<br />
(<strong>IAEA</strong>-CN-47/A-IV-3) 217<br />
JT-60 Team: T. Abe, H. Aikawa, H. Akaoka, H. Akasaka, M. Akiba,<br />
N. Akino, T. Akiyama, T. Ando, K. Annoh, N. Aoyagi, K. Arakawa,<br />
M. Araki, K. Arimoto, M. Azumi, S. Chiba, M. Dairaku, N. Ebiswa,<br />
T. Fujii, T. Fukuda, H. Furukawa, K. Hamamatsu, K. Hayashi,<br />
M. Hara, K. Haraguchi, H. Hiratsuka, T. Hirayama, S. Hiroki,<br />
K. Hiruta, M. Honda, H. Horiike, R. Hosoda, N. Hosogane, Y. Iida,<br />
T. Iijima, K. Ikeda, Y. Ikeda, T. Imai, T. Inoue, N. Isaji, M. Isaka,<br />
S. Ishida, N. Itige, T. Ito, Y. Ito, A. Kaminaga, M. Kawai,<br />
Y. Kawamata, K. Kawasaki, K. Kikuchi, M. Kikuchi, H. Kimura,<br />
T. Kimura, H. Kishimoto, K. Kitahara, S. Kitamura, A. Kitsunezaki,<br />
K. Kiyono, N. Kobayashi, K. Kodama, Y. Koide, T. Koike,<br />
M. Komata, I. Kondo, S. Konoshima, H. Kubo, S. Kunieda,<br />
S. Kurakata, K. Kurihara, M. Kuriyama, T. Kuroda, M. Kusaka,<br />
Y. Kusama, S. Maehara, K. Maeno, S. Mase, S. Matsuda,<br />
M. Matsukawa, T. Matsukawa, M. Matsuoka, N. Miya, K. Miyati,<br />
Y. Miyo, K. Mizuhashi, M. Mizuno, R. Murai, Y. Murakami, M. Muto,<br />
M. Nagami, A. Nagashima, K. Nagashima, T. Nagashima, S. Nagaya,<br />
H. Nakamura, Y. Nakamura, M. Nemoto, Y. Neyatani, S. Niikura,<br />
H. Ninomiya, T. Nishitani, H. Nomata, K. Obara, N. Ogiwara,<br />
Y. Ohara, K. Ohasa, T. Ohga, H. Ohhara, M. Ohkubo, T. Ohshima,<br />
K. Ohta, M. Ohta, M. Ohtaka, Y. Ohuchi, A. Oikawa, H. Okumura,<br />
Y. Okumura, K. Omori, S. Omori, Y. Omori, T. Ozeki, M. Saigusa,<br />
K. Sakamoto, A. Sakasai, S. Sakata, M. Satou, M. Sawahata,<br />
M. Seimiya, M. Seki, S. Seki, K. Shibanuma, R. Shimada, K. Shimizu,<br />
M. Shimizu, Y. Shimomura, S. Shinozaki, H. Shirai, H. Shirakata,<br />
M. Shitomi, K. Suganuma, T. Sugie, T. Sugiyama, H. Sunaoshi,<br />
K. Suzuki, M. Suzuki, M. Suzuki, N. Suzuki, S. Suzuki, Y. Suzuki,<br />
H. Takahashi, M. Takahashi, S. Takahashi, T. Takahashi,<br />
M. Takasaki, M. Takatsu, A. Takeshita, H. Takeuchi, S. Tamura,<br />
S. Tanaka, K. Tani, M. Terakado, T. Terakado, K. Tobita,<br />
T. Tokutake, T. Totsuka, N. Toyoshima, H. Tsuda, T. Tsugita, S. Tsuji,<br />
Y. Tsukahara, M. Tsuneoka, K. Uehara, M. Umehara, Y. Vramoto,<br />
H. Usami, K. Ushigusa, K. Usui, J. Yagyu, K. Yamada, M. Yamamoto,<br />
0. Yamashita, Y. Yamashita, K. Yano, T. Yasukawa, K. Yokokura,<br />
H. Yokomizo, H. Yoshida, M. Yoshikawa, Y. Yoshinari, R. Yoshino,<br />
1. Yonekawa, K. Watanabe<br />
Discussion 224<br />
Density limit <strong>and</strong> impurity transport investigations in<br />
DITE tokamak (<strong>IAEA</strong>-CN-47/A-IV-4) 227<br />
J. Allen, G.E. Austin, K.B. Axon, R. Barnsley, M. Dunstan,<br />
D.N. Edwards, K.D. Evans, S.J. Fielding, D.H.J. Goodall,
W. Han, N.C. Hawkes, J. Hugill, P.C. Johnson,<br />
G.M. McCracken, G.F. Matthews, W. Millar, N.J. Peacock,<br />
C.S. Pitcher, J. Pritchard, A. Sykes, M.F. Turner, J.P. Webber<br />
Discussion 235<br />
Studies of edge plasma phenomena in T-10<br />
(<strong>IAEA</strong>-CNW/A-IV-5) 237<br />
K.F. Alex<strong>and</strong>er, L. Dietrich, H. Grote, K. Gunther,<br />
J. Lingertat, E.L. Berezovskij, A. V. Chankin, V.M. Chicherov,<br />
S.E. Lysenko, V.A. Medvedev, A.Yu. Pigarov, V.I. Pistunovich,<br />
S. V. Popovichev, V. Vershkov<br />
Discussion 246<br />
ALT-I pump limiter behaviour <strong>and</strong> edge plasma flows during biasing <strong>and</strong><br />
ICRF heating in the TEXTOR tokamak (<strong>IAEA</strong>-CN-47/A-IV-6) 249<br />
R.W. Conn, D.M. Goebel, W.K. Leung, G.A. Campbell, B. LaBombard,<br />
A.K. Prinja, W.L. Hsu, G.J. Thomas, K.H. Dippel, K.H. Finken,<br />
R. Reiter, G.H. Wolf, H.L. Bay, G. Bertschinger, W. Bieger, P. Bogen,<br />
W. Brussau, Y. Cao, H.G. Esser, G. Fuchs, B. Giesen, E. Graffinann,<br />
H. Hartwig, E. Hintz, F. Hoenen, K. Hothker, A. Kaleck, H. Kever,<br />
L. Kdnen, M. Korten, L. Li, Y.T. Lie, A. Pospieszczyk, A. Rogister,<br />
G. Ross, D. Rusbttldt, U. Samm, J. Schluter, B. Schweer, H. Soltwisch,<br />
F. Waelbroeck, G. Waidmann, P. Wienhold, J. Winter, R. Yamauchi,<br />
T. Delvigne, P. Descamps, F. Durodie, M. Jadoul, R. Koch,<br />
D. Lebeau, A.M. Messiaen, D.I.C. Pearson, P.E. V<strong>and</strong>enplas,<br />
R. Van Nieuwenhove, G. Van Oost, G. Van Wassenhove, R.R. Weynants<br />
Discussion 261<br />
Current density profiles in the TEXTOR tokamak (<strong>IAEA</strong>-CN-47/A-V-1) ... 263<br />
H. Soltwisch, W. Stodiek, J. Manickam, J. Schluter<br />
Discussion 272<br />
Stability <strong>and</strong> confinement studies in the Princeton Beta Experiment (PBX)<br />
(<strong>IAEA</strong>-CN47/A-V-2) 275<br />
M. Okabayashi, K. Bol, M. Chance, P. Couture, H. Fishman,<br />
R.J. Fonck, G. Gammel, W.W. Heidbrink, K. Ida, K.P. Jaehnig,<br />
G. Johns, R. Kaita, S.M. Kaye, H. Kugel, B. LeBlanc, J. Manickam,<br />
W. Morris, G.A. Navratil, N. Ohyabu, S. Paul, E. Powell, M. Reusch,<br />
S. Sesnic, H. Takahashi<br />
Discussion 290<br />
Stabilization of the tearing mode (<strong>IAEA</strong>-CN-47/A-V-3) 291<br />
T.C. Hender, D.C. Robinson, J.A. Snipes<br />
Discussion 298<br />
Experimental <strong>and</strong> theoretical studies of circular cross-section high beta<br />
tokamaks (<strong>IAEA</strong>-CN-47/A-V-4) 299<br />
G.A. Navratil, Y. Baransky, A. Bhattacharjee, C.K. Chu, A.V. Deniz,<br />
A.A. Grossman, A. Holl<strong>and</strong>, T. Ivers, X.L. Li, T.C. Marshall,
M.E. Mauel, S. Sabbagh, A.K. Sen, J. Van Dam, X.-H. Wang,<br />
M. Hughes, M. Phillips, A.M.M. Todd<br />
Discussion 308<br />
Disruption control experiments using local modular<br />
multipole field coils (<strong>IAEA</strong>-CN-47/A-V-5) 309<br />
K. Yamazaid, K. Kawahata, Y. Abe, R. Akiyama, T. Amano, R. Ando,<br />
Y. Hamada, S. Hirokura, K. Ida, E. Kako, O. Kaneko, Y. Kawasumi,<br />
S. Kitagawa, T. Kuroda, K. Masai, K. Matsuoka, A. Mohri,<br />
M. Mugishima, N. Noda, I. Ogawa, Y. Ogawa, K. Ohkubo, Y. Oka,<br />
K. Sakurai, M. Sasao, K. Sato, K.N. Sato, S. Tanahashi, Y. Taniguchi,<br />
K. Toi, T. Watari<br />
Discussion 316<br />
Studies of MHD modes <strong>and</strong> high frequency fluctuations on the<br />
HT-6B <strong>and</strong> HT-6M tokamaks (<strong>IAEA</strong>-CN-47/A-V-6) 317<br />
Jikang Xie, Jiayu Chen, Wenkang Guo, Yuping Huo, HT-6B Group,<br />
HT-6M Group<br />
Anomalous transport in JET plasmas (<strong>IAEA</strong>-CN-47/A-VI-1-1) 325<br />
D.F. Diichs, T.E. Stringer, A. Taroni, M. Brusati, N.A. Gottardi,<br />
T. Hells ten, F. Tibone<br />
Microinstability based models for confinement properties <strong>and</strong> ignition<br />
criteria in tokamaks (<strong>IAEA</strong>-CN-47/A-VI-1-2) 337<br />
W.M. Tang, CM. Bishop, B. Coppi, S.M. Kaye, F.W. Perkins,<br />
M.H. Redi, G. Rewoldt<br />
Drift wave models of tokamak confinement (<strong>IAEA</strong>-CN-47/A-VI-1-3) 345<br />
R.E. Waltz, R.R. Dominguez, S.K. Wong, P.H. Diamond, G.S. Lee,<br />
T.S. Hahm, N. Mattor<br />
Discussion on papers <strong>IAEA</strong>-CN-47/A-VI-1 -1 to A-VI-1-3 355<br />
MHD stability <strong>and</strong> transport of beam heated ASDEX discharges<br />
in the vicinity of the beta limit (<strong>IAEA</strong>-CN-47/A-VI-2) 357<br />
O. Gruber, G. Becker, G. von Gierke, K. Grassie, O. Kliiber,<br />
M. Kornherr, K. Lackner, J.K. Lee, H.P. Zehrfeld, H.S. Bosch,<br />
H. Brocken, A. Eberhagen, G. Fussmann, O. Gehre, J. Gernhardt,<br />
E. Glock, G. Haas, J. Hofinann, A. Izvozchikov, G. Janeschitz,<br />
F. Karger, M. Kaufinann, M. Keilhacker, M. Lenoci, G. Lisitano,<br />
F. Mast, H.M. Mayer, K. McCormick, D. Meisel, V. Mertens,<br />
E.R. Miiller, H. Murmann, H. Niedermeyer, W. Poschenrieder,<br />
H. Rapp, H. Riedler, H. Rdhr, J. Roth, F. Ryter, F. Schneider,<br />
C. Setzensack, G. Siller, P. Smeulders, F.X. Soldner, E. Speth,<br />
K.-H. Steuer, O. Vollmer, F, Wagner, D. Zasche<br />
Discussion 371<br />
Beta limit disruptions (<strong>IAEA</strong>-CN-47/A-VI-3) 373<br />
Mingsheng Chu, E.J. Strait, J.K. Lee, L. Lao, R.D. Stambaugh,<br />
K.H. Burrell, R.J. Groebner, J.M. Greene, F.J. Helton, J.Y. Hsu,
J.S. Kim, H. St. John, R.T. Snider, T.S. Taylor<br />
Discussion 384<br />
Sawteeth <strong>and</strong> temperature profiles in tokamaks (<strong>IAEA</strong>-CN-47/A-VI-4) 387<br />
D.A. Boyd, R.E. Denton, J.Q. Dong, J.F. Drake, P.N. Guzdar,<br />
A.B. Hassam, R.G. Kleva, Y.C. Lee, C.S. Liu, F.J. Stauffer<br />
Discussion 398<br />
First results from the HL-1 tokamak (<strong>IAEA</strong>-CN-47/A-VII-l) 399<br />
HL-1 Tokamak Group<br />
Tokamak current drive via AC magnetic helicity injection<br />
(<strong>IAEA</strong>-CN-47/A-VII-2) 407<br />
P.M. Bellan, P.C. Liewer, J.M. Finn, T.M. Antonsen, Jr.<br />
Study of enhanced confinement <strong>and</strong> q = 2 disruptive modes with fast<br />
rising current in the STOR-1M tokamak (<strong>IAEA</strong>-CN-47/A-VII-3) 413<br />
H. Kuwahara, O. Mitarai, E.J.M. Van Heesch, M. Emaami,<br />
A.H. Sarkissian, S. W. Wolfe, A. Hirose, KM. Skarsgard<br />
Coherent <strong>and</strong> turbulent fluctuations in TFTR (<strong>IAEA</strong>-CN-47/A-VII-4) 421<br />
K. McGuire, V. Arunasalam, M.G. Bell, M. Bitter, W.R. Blanchard,<br />
N.L. Bretz, R. Budny, C.E. Bush, J.D. Callen, M. Chance, S.A. Cohen,<br />
S.K. Combs, S.L. Davis, D.L. Dimock, H.F. Dylla, P.C. Efthimion,<br />
L.C. Emerson, A.C. Engl<strong>and</strong>, H.P. Eubank, R.J. Fonck, E. Fredrickson,<br />
H.P. Furth, G. Gammel, R.J. Goldston, B. Grek, L.R. Grisham, G. Hammett,<br />
R.J. Hawryluk, W.W. Heidbrink, H.W. Hendel, K.W. Hill, E. Hinnov,<br />
S. Hiroe, H. Hsuan, R.A. Hulse, K.P. Jaehnig, D. Jassby, F.C. Jobes,<br />
D.W. Johnson, L.C. Johnson, R. Kaita, R. Kamperschroer, S.M. Kaye,<br />
S.J. Kilpatrick, R.J. Knize, H. Kugel, P.H. LaMarche, B. LeBlanc,<br />
R. Little, C.H. Ma, J. Manickam, D.M. Manos, D.K. Mansfield,<br />
R.T. McCann, M.P. McCarthy, D.C. McCune, D.H. McNeill,<br />
D.M. Meade, S.S. Medley, D.R. Mikkelsen, S.L Milora, D. Monticello,<br />
W. Morris, D. Mueller, E.B. Nieschmidt, J. O'Rourke, D.K. Owens,<br />
H. Park, W. Park, N. Pomphrey, B. Prichard, A.T. Ramsey,<br />
M.H. Redi, A.L. Roquemore, P.H. Rutherford, N.R. Sauthoff,<br />
G. Schilling, J. Schivell, G.L. Schmidt, S.D. Scott, S. Sesnic,<br />
J.C. Sinnis, F.J. Stauffer, B.C. Stratton, G.D. Tail, G. Taylor,<br />
J.R. Timberlake, H.H. Towner, M. Ulrickson, S. Von Goeler,<br />
F. Wagner, R. Wiel<strong>and</strong>, J.B. Wilgen, M. Williams, K.L. Wong,<br />
S. Yoshikawa, KM. Young, M.C. Zarnstorff, S.J. Zweben<br />
Sawteeth <strong>and</strong> disruptions in JET (<strong>IAEA</strong>-CN^7/A-VII-5) 433<br />
D.J. Campbell, P. A. Duperrex, A.W. Edwards, R.D. Gill,<br />
C.W. Gowers, R. Granetz, M. Hugon, P.J. Lomas, N. Lopes-Cardozo,<br />
M. Malacarne, M.F. Nave, D.C. Robinson, F.C. Schuller,<br />
P. Smeulders, J.A. Snipes, P.E. Stott, G. Tonetti, B.J. Tubbing,<br />
A. Welter, J.A. Wesson
PLASMA HEATING AND CURRENT DRIVE<br />
(Session F)<br />
Radiofrequency heating on JET (<strong>IAEA</strong>-CN-47/F-I-1) 449<br />
JET Team: H. Altmann, R.J. Anderson, J. Arbez, W. Bailey,<br />
D.V. Bartlett, B. Beaumont, G. Beaumont, K. Behringer, P. Bertoldi,<br />
E. Bertolini, C.H. Best, V. Bhatnagar, R.J. Bickerton, A. Boileau,<br />
F. Bombarda, T. Bonicelli, S. Booth, A. Boschi, G. Bosia, M. Botman,<br />
H. Brelen, H. Brinkschulte, M.L. Browne, M. Brusati, T. Budd,<br />
M. Bures, P. Butcher, H. Buttgereit, D. Cacaut, C. Caldwell-Nichols,<br />
J.D. Callen, D.J. Campbell, J. Carwardine, G. Celentano,<br />
CD. Challis, A. Cheetham, J.P. Christiansen, C. Christodoulopoulos,<br />
P. Chuilon, R. Claesen, J.P. Coad, S.A. Cohen, M. Cooke, J.G. Cordey,<br />
W. Core, S. Corti, A.E. Costley, G.A. Cornell, M. Cox, C. David,<br />
J. Dean, L. de Kock, E. Deksnis, G.B. Denne, G. Deschamps,<br />
K.J. Dietz, J. Dobbing, S.E. Dorling, D.F. Duchs, G. Duesing,<br />
P.A. Duperrex, H. Duquenoy, A.W. Edwards, J. Ehrenberg,<br />
W. Engelhardt, S.K. Erents, F. Erhorn, B.T. Eriksson, M. Evrard,<br />
H. Falter, N. Foden, M.J. Forrest, C. Froger, K. Fullard,<br />
G. Fussmann, M. Gadeberg, A. Galetsas, A. Gallacher, D. Gambier,<br />
R. Giannella, A. Giannelli, A. Gibson, R.D. Gill, A. Goede,<br />
A. Gondhalekar, C. Gordon, C. Gormezano, N.A. Gottardi,<br />
C.W. Gowers, R. Granetz, B. Green, S. Gregoli, F.S. Griph,<br />
R. Haange, J.H. Hamnen, C.J. Hancock, P.J. Harbour, N.C. Hawkes,<br />
P. Haynes, T. Hellsten, J.L. Hemmerich, R. Hemsworth, F. Hendriks,<br />
R.F. Herzog, L. Horton, J. How, M. Huart, A. Hubbard, J. Hugill,<br />
M. Hugon, M. Huguet, B. Ingram, H. Jackel, J. Jacquinot,<br />
Z. Jankowicz, O.N. Jarvis, E.M. Jones, P. Jones, T.T.C. Jones,<br />
C. Jupen, E. Kdllne, J. Kallne, O. Kaneko, A. Kaye, B.E. Keen,<br />
M. Keilhacker, G. Kinahan, S. Kissel, A. Konstantellos, M. Kovanen,<br />
U. Kuphnapfel, P. Kupschus, P. Lallia, J.R. Last, L. Lauro-Taroni,<br />
K.D. Lawson, E. Lazzaro, R.C. Lobel, P.J. Lomas,<br />
N. Lopes-Cardozo, M. Lorenz-Gottardi, C. Lowry, G. Magyar,<br />
D. Maisonnier, M. Malacarne, V. Marchese, P. Massmann,<br />
G.M. McCracken, P. McCullen, M.J. Mead, P. Meriguet, V. Merlo,<br />
V. Mertens, S. Mills, P. Millward, A. Moissonnier, P.L. Mondino,<br />
D. Moreau, P.D. Morgan, E.R. Mailer, D. Murmann, G. Murphy,<br />
M.F. Nave, L. Nickesson, P. Nielsen, P. Noll, S. Nowak, W. Obert,<br />
M. Olsson, J. O'Rourke, M.G. Pacco, J. Paillere, S. Papastergiou,<br />
J. Partridge, D. Pasini, N.J. Peacock, M. Pescatore, J. Plancoulaine,<br />
J.-P. Pqffe, R. Prentice, T. Raimondi, J. Ramette, C. Raymond,<br />
P.H. Rebut, J. Removille, W. Riediker, R. Roberts, D.C. Robinson,<br />
A. Rolfe, R.T. Ross, G. Rupprecht, R. Rushton, H.C. Sack,
G. Sadler, J. Saffert, N. Salmon, F. S<strong>and</strong>, A. Santagiustina,<br />
R. Saunders, M. Schmid, F. C. Schuller, K. Selin, R. Shaw, A. Sibley,<br />
D. Sigournay, R. Sillen, F. Simonet, R. Simonini, P. Smeulders,<br />
J.A. Snipes, K. Sonnenberg, L. Sonnerup, M.F. Stamp, C.A. Steed,<br />
D. Stork, P.E. Stott, T.E. Stringer, D.R. Summers, H.P. Summers,<br />
A.J. Tagle, G. Tallents, A. Tanga, A. Taroni, A. Terrington, A. Tesini,<br />
P.R. Thomas, E. Thompson, K. Thomsen, F. Tibone, R. Tivey,<br />
T.N. Todd, P. Trevalion, M. Tschudin, B.J. Tubbing, P. Twynam,<br />
E. Usselmann, H. Van der Beken, J.E. Van Montfoort,<br />
M. von Hellermann, J. von Seggern, T. Wade, C. Walker,<br />
B.A, Wall<strong>and</strong>er, M. Walravens, K. Walter, M.L. Watkins,<br />
M. Watson, D. Webberley, A. Wetter, J.A. Wesson, J. Wilks,<br />
T. Winkel, C. Woodward, M. Wykes, D. Young, L. Zannelli, J. W. Zwart<br />
Discussion 459<br />
Ion cyclotron heating <strong>and</strong> lower hybrid experiments on ASDEX<br />
(<strong>IAEA</strong>-CN-47/F-I-2) 461<br />
K. Steinmetz, F.X. Soldner, D. Eckhartt, G. Janeschitz,<br />
F. Leuterer, F. Mast, K, McCormick, J.-M. Noterdaeme, C. Setzensack,<br />
F. Wagner, F. Wesner, I. Baumler, G. Becker, H.S. Bosch,<br />
M. Brambilla, F. Braun, H. Brocken, H. Derfler, A. Eberhagen,<br />
H.-U. Fahrbach, G. Fussmann, R. Fritsch, O. Gehre, J. Gernhardt,<br />
G. von Gierke, E. Glock, O. Gruber, G. Haas, J. Hoftnann,<br />
F. Hofineister, K. Hubner, A. Izvozchikov, F. Karger, M. Keilhacker,<br />
O. Kluber, M. Kornherr, K. Lackner, M. Lenoci, G. Lisitano,<br />
E. Van Mark, H.M. Mayer, D. Meisel, V. Mertens, E.R. Mutter,<br />
E. Munich, H. Murmann, H. Niedermeyer, Z.A. Pietrzyk, W. Poschenrieder,<br />
S. Puri, H. Rapp, H. Riedler, H. Rohr, J. Roth, F. Ryter, K.H. Schmitter,<br />
F. Schneider, G. Siller, P. Smeulders, E. Speth, K.-H. Steuer, T. Vien,<br />
0. Vollmer, H. Wedler, D. Zasche, M. Zouhar<br />
Discussion 474<br />
Ion Bernstein wave heating experiments on PLT (<strong>IAEA</strong>-CN-47/F-I-3) 477<br />
M. Ono, P. Beiersdorfer, R. Bell, S. Bernabei, A. Cavallo, A. Chmyga,<br />
S.A. Cohen, P. Colestock, G. Gammel, G. Greene, J. Hosea, R. Kaita,<br />
1. Lehrman, G. Mazzitelli, E. Mazzucato, D.H. McNeil!, M. Mori,<br />
K. Sato, J. Stevens, S. Suckewer, J.R. Timberlake, V. Vershkov,<br />
J.R. Wilson, A. Wouters<br />
Discussion 484<br />
Confinement studies on TEXTOR with high power, long pulse ICRH<br />
(<strong>IAEA</strong>-CN-47/F-I-4) 485<br />
P.E. V<strong>and</strong>enplas, T. Delvigne, P. Descamps, F. Durodie, M. Jadoul,<br />
R. Koch, D. Lebeau, A.M. Messiaen, D.I.C. Pearson,<br />
R. Van Nieuwenhove, G. Van Oost, G. Van Wassenhove, R.R. Weynants,<br />
H.L. Bay, G. Bertschinger, W. Bieger, P. Bogen, W. Brussau,
G.A. Campbell, Y. Cao, R.W. Conn, H. Conrads, K.H. Dippel,<br />
H.G. Esser, K.H. Finken, G. Fuchs, B. Giesen, D.M. Goebel,<br />
E. Graffmann, H. Hartwig, E. Hintz, F. Hoenen, K. Hothker,<br />
W.L. Hsu, A. Kaleck, H. Kever, L. Konen, M. Korten, W.K. Leung, L. Li,<br />
Y. T. Lie, A. Pospieszczyk, D. Reiter, A. Rogister, G. Ross, D. Rusbuldt,<br />
U. Samm, J. Schluter, B. Schweer, H. Soltwisch, G.J. Thomas,<br />
F. Waelbroeck, G. Waidmann, P. Wienhold, J. Winter, G.H. Wolf<br />
Experiments on ICRF heating <strong>and</strong> fast wave current drive in JIPP T-IIU<br />
(<strong>IAEA</strong>-CN-47/F-I-5) 495<br />
T. Watari, K. Ohkubo, R. Akiyama, R. Ando, D. Eckhartt, Y. Hatnada,<br />
S. Hirokura, K. Ida, E. Kako, O. Kaneko, K. Kawahata, Y. Kawasumi,<br />
S. Kitagawa, T. Kuroda, K. Masai, K. Matsuoka, A. Mohri, S. Morita,<br />
M. Mugishima, N. Noda, I. Ogawa, Y. Ogawa, Y. Oka, M. Sakamoto,<br />
K. Sakurai, M. Sasao, K. Sato, K.N. Sato, S. Tanahashi, Y. Taniguchi,<br />
T. Tetsuka, K. Toi, K. Yamazaki<br />
Discussion 501<br />
Electron heating <strong>and</strong> MHD modes during lower hybrid current drive<br />
on PLT (<strong>IAEA</strong>-CN-47/F-II-l) 503<br />
S. Bernabei, R. Bell, A. Cavallo, T.K. Chu, P. Colestock, J. Felt,<br />
W. Hooke, J. Hosea, F.C. Jobes, E. Mazzucato, E. Meservey, R. Motley,<br />
J.A. Murphy, M. Ono, R. Pinsker, J. Stevens, S. Von Goeler, J.R. Wilson<br />
Radiofrequency heating <strong>and</strong> current drive experiments on Alcator C<br />
<strong>and</strong> Versator II (<strong>IAEA</strong>-CN-47/F-II-2) 509<br />
M. Porkolab, P. Bonoli, Kuoin Chen, C. Fiore, R. Granetz, D. Griffin,<br />
D. Gwinn, S. Knowlton, B. Lipschultz, S.C. Luckhardt, E. Marmar,<br />
M. Mayberry, F.S. McDermott, J. Moody, R. Parker, J. Rice,<br />
Y. Takase, J. Terry, S. Texter, S. Wolfe<br />
Discussion 523<br />
Current drive by lower hybrid waves at 3.7 GHz in Petula B<br />
(<strong>IAEA</strong>-CN-47/F-II-3) 525<br />
F. Parlange, D. Van Houtte, H. Bottollier-Curtet, G. Briffod,<br />
P. Chabert, M. Clement, C. David, A. Girard, C. Gormezano, W. Hess,<br />
M. Hesse, G.T. Hoang, G. Ichtchenko, J.M. Rax, F. Ryter, J.C. Vallet<br />
Discussion 531<br />
Experiments on current drive <strong>and</strong> plasma heating by LH <strong>and</strong> EC waves<br />
in the T-7 tokamak (<strong>IAEA</strong>-CN-47/F-II-4) 533<br />
V.V. Alikaev, A.A. Borshchegovskij, V.V. Chist'akov, Yu.A. Gorelov,<br />
V.I. Win, D.P. Ivanov, N.V. Ivanov, A.M. Kakurin, P.P. Khvostenko,<br />
A.Ya. Kislov, V.A. Kochin, P.E. Kovrov, K.I. Likin, Yu.S. Maksimov,<br />
I.B. Semenov, A.F. Shigaev, Yu.A. Sokolov, N.L. Vasin, V.V. Volkov,<br />
J. batlov, V. Kopecky, L. KrySka
Electron cyclotron heating of lower hybrid current driven plasma in the<br />
JFT-2M tokamak (<strong>IAEA</strong>-CN-47/F-II-5) 545<br />
T. Yamamoto, A. Funahashi, K. Hoshino, S. Kasai, T. Kawakami,<br />
H. Kawashima, T. Matoba, T. Matsuda, H. Matsumoto, Y. Miura,<br />
M. Mori, K. Odajima, H. Ogawa, T. Ogawa, H. Ohtsuka, S. Sengoku,<br />
T. Shoji, N. Suzuki, H. Tamai, Y. Uesugi, T. Yamauchi, M. Hasegawa,<br />
S. Takada, K. Hasegawa, A. Honda, I. Ishibori, T. Kashimura,<br />
Y. Kashiwa, M. Kazawa, K. Kikuchi, Y. Matsuzaki, K. Ohuchi,<br />
H. Okano, T. Shibata, T. Shibuya, T. Shiina, K. Suzuki,<br />
T. Tani, K. Yokoyama<br />
Discussion 551<br />
Electron cyclotron <strong>and</strong> lower hybrid current drive experiments in the<br />
WT-2 <strong>and</strong> WT-3 tokamaks (<strong>IAEA</strong>-CN-47/F-II-6) 553<br />
S. Tanaka, Y. Terumichi, T. Maekawa, M. Nakamura, T. Cho, A. Ando,<br />
K. Ogura, H. Tanaka, M. Iida, S. Ide, K. Oho, S. Ozaki, R. Itatani,<br />
H. Abe, Y. Yasaka, M. Fukao, K. Ishii, A. Mohri, S. Kubo<br />
Discussion 562<br />
Improvement of current drive <strong>and</strong> confinement by combination of<br />
LHCD <strong>and</strong> NBI heating in JT-60 (<strong>IAEA</strong>-CN-47/F-II-7) 563<br />
JT-60 Team: T. Abe, H. Aikawa, H. Akaoka, H. Akasaka, M. Akiba,<br />
N. Akino, T. Akiyama, T. Ando, K. Annoh, N. Aoyagi, K. Arakawa,<br />
M. Araki, K. Arimoto, M. Azumi, S. Chiba, M. Dairaku, N. Ebiswa,<br />
T. Fujii, T. Fukuda, H. Furukawa, K. Hamamatsu, K. Hayashi,<br />
M. Hara, K. Haraguchi, H. Hiratsuka, T. Hirayama, S. Hiroki,<br />
K. Hiruta, M. Honda, H. Horiike, R. Hosoda, N. Hosogane, Y. Iida,<br />
T. Iijima, K. Ikeda, Y. Ikeda, T. Imai, T. Inoue, N. Isaji, M. Isaka,<br />
S. Ishida, N. Itige, T. ho, Y. Ito, A. Kaminaga, M. Kawai,<br />
Y. Kawamata, K. Kawasaki, K. Kikuchi, M. Kikuchi, H. Kimura,<br />
T. Kimura, H. Kishimoto, K. Kitahara, S. Kitamura, A. Kitsunezaki,<br />
K. Kiyono, N. Kobayashi, K. Kodama, Y. Koide, T. Koike,<br />
M. Komata, I. Kondo, S. Konoshima, H. Kubo, S. Kunieda,<br />
S. Kurakata, K. Kurihara, M. Kuriyama, T. Kuroda, M. Kusaka,<br />
Y. Kusama, S. Maehara, K. Maeno, S. Mase, S. Matsuda,<br />
M. Matsukawa, T. Matsukawa, M. Matsuoka, N. Miya, K. Miyati,<br />
Y. Miyo, K. Mizuhashi, M. Mizuno, R, Murai, Y. Murakami, M. Muto,<br />
M. Nagami, A. Nagashima, K. Nagashima, T. Nagashima, S. Nagaya,<br />
H. Nakamura, Y. Nakamura, M. Nemoto, Y. Neyatani, S. Niikura,<br />
H. Ninomiya, T. Nishitani, H. Nomata, K. Obara, N. Ogiwara,<br />
Y. Ohara, K. Ohasa, T. Ohga, H. Ohhara, M. Ohkubo, T. Ohshima,<br />
K. Ohta, M. Ohta, M. Ohtaka, Y. Ohuchi, A. Oikawa, H. Okumura,<br />
Y. Okumura, K. Omori, S. Omori, Y. Omori, T. Ozeki, M. Saigusa,<br />
K. Sakamoto, A. Sakasai, S. Sakata, M. Satou, M. Sawahata,<br />
M. Seimiya, M. Seki, S. Seki, K. Shibanuma, R. Shimada, K. Shimizu,
M. Shimizu, Y. Shimomura, S. Shinozaki, H. Shirai, H. Shirakata,<br />
M. Shitomi, K. Suganuma, T. Sugie, T. Sugiyama, H. Sunaoshi,<br />
K. Suzuki, M. Suzuki, M. Suzuki, N. Suzuki, S. Suzuki, Y. Suzuki,<br />
H. Takahashi, M. Takahashi, S. Takahashi, T. Takahashi,<br />
M. Takasaki, M. Takatsu, A. Takeshita, H. Takeuchi, S. Tamura,<br />
S. Tanaka, K. Tani, M. Terakado, T. Terakado, K. Tobita,<br />
T. Tokutake, T. Totsuka, N. Toyoshima, H. Tsuda, T. Tsugita, S. Tsuji,<br />
Y. Tsukahara, M. Tsuneoka, K. Uehara, M. Umehara, Y. Uramoto,<br />
H. Usami, K. Ushigusa, K. Usui, J. Yagyu, K. Yamada, M. Yamamoto,<br />
0. Yamashita, Y. Yamashita, K. Yano, T. Yasukawa, K. Yokokura,<br />
H. Yokomizo, H. Yoshida, M. Yoshikawa, Y. Yoshinari, R. Yoshino,<br />
1. Yonekawa, K. Watanabe<br />
Discussion 573<br />
Current drive, confinement <strong>and</strong> instability control experiments with ECRH<br />
on the CLEO tokamak (<strong>IAEA</strong>-CN-47/F-III-2) 575<br />
D.C. Robinson, N.R. Ainsworth, P.R. Collins, A.N. Dellis, T. Edlington,<br />
P. Haynes, S. Iyengar, I. Johnson, B. Lloyd, M. O'Brien,<br />
B.J. Parham, A.C. Rivtere, D.F.H. Start, T.N. Todd<br />
Discussion 585<br />
Confinement in electron cyclotron heating experiments on Doublet III<br />
(<strong>IAEA</strong>-CN-47/F-IH-3) 587<br />
R. Prater, S. Ejima, R.W. Harvey, A.J. Lieber, K. Matsuda,<br />
C.P. Moeller, <strong>and</strong> the Doublet III Physics Group<br />
Discussion 597<br />
Electron cyclotron heating on TFR (<strong>IAEA</strong>-CN-47/F-III-4) 599<br />
H.P.L. de Esch, J.A. Hoekzema, W.J. Schroder, E. Westerhof,<br />
W. Kooijman, R. W. Polman, T.J. Schep, <strong>and</strong> Equipe TFR<br />
Discussion 606<br />
Investigation of plasma formation regimes for ICRF heating experiments<br />
in the TUMAN-3 tokamak with magnetic compression<br />
(<strong>IAEA</strong>-CN-47/F-III-5) 607<br />
L.G. Askinasi, N.E. Bogdanova, V.E. Golant, S.G. Goncharov,<br />
M.P. Gryaznevich, V.V. D'yachenko, A. Izvozchikov, E.R. Its,<br />
S.V. Krikunov, S.V. Lebedev, B.M. Lipin, I.P. Pavfov, G.T. Razdobarin,<br />
V. V. Rozhdestvenskij, N. V. Sakharov, M.A. Khalilov, F. V. Chernyshev,<br />
K.G. Shakhovets, O.N. Shcherbinin, S.E. Bender, Yu.A. Kostsov,<br />
R.N. LitunovsMj, O.A. Minyaev, E.N. Rumyantsev, P.P. Teplov<br />
Discussion 615<br />
Alfven wave heating <strong>and</strong> current profile modification in TCA<br />
(<strong>IAEA</strong>-CN-47/F-III-6) 617<br />
G. Besson, G.A. Collins, B.P. Duval, C. Hollenstein, A.A. Howling,<br />
B. Joye, J.B. Lister, J.-M. Moret, F. Ryter, C.W. Simm, H. Weisen<br />
Discussion 625
Analysis of ICRF heating <strong>and</strong> current drive in tokamaks<br />
(<strong>IAEA</strong>-CN-47/F-IV-l) 627<br />
A. Fukuyama, T. Morishita, Y. Kishimoto, K. Hamamatsu,<br />
S.-I. Itoh, K. Itoh<br />
Double helix (f X 6) current drive in the RF tokamak device RYTHMAC<br />
(<strong>IAEA</strong>-CN^7/F-IV-2) 635<br />
M.J. Dutch, A.L McCarthy<br />
Dependence of power absorbed in a plasma on Alfve'n heating antenna<br />
parameters (<strong>IAEA</strong>-CN-47/F-IV-3) 645<br />
A.G. Kirov, V.P. Sidorov, A.G. Elfimov, S.N. Lozovskij, L.F. Ruchko,<br />
K. G. Komoshvili, V. V. Onishchenko, V. V. Dorokhov, A. V. Sukachev,<br />
V.D. Samushia, L.Ya. Malykh, N.L. Gulasaryan, D.A. Vojtenko<br />
Recent advances in the theory <strong>and</strong> modelling of RF heating in<br />
inhomogeneous plasmas (<strong>IAEA</strong>-CN-47/F-IV-4) 653<br />
D.G. Swanson, S. Cho, C.K. Phillips, D.Q. Hwang, W. Houlberg,<br />
L. Hively<br />
Electron cyclotron current drive <strong>and</strong> supra-thermal generation in<br />
large tokamaks (<strong>IAEA</strong>-CN-47/F-IV-5) 659<br />
T.J. Schep, R. W. Polman, E. Westerhof, L. Klieb<br />
Chairmen of Sessions <strong>and</strong> Secretariat of the Conference 669
Session A-I<br />
Session A-II<br />
Session A-III<br />
Session A-IV<br />
Session A-V<br />
Session A-VI<br />
Session A<br />
ARTSIMOVICH MEMORIAL LECTURE<br />
AND<br />
TOKAMAK EXPERIMENTS<br />
Chairmen of Sessions<br />
S. MORI<br />
D.M. MEADE<br />
J.B. LISTER<br />
M. KEILHACKER<br />
R.A. GROSS<br />
L.E. ZAKHAROV<br />
Papers A-VI-1-1, A-VI-1-2 <strong>and</strong> A-VI-1-3<br />
were presented by D.F. Diichs as Rapporteur<br />
Session A-VII (Posters)<br />
Japan<br />
USA<br />
Switzerl<strong>and</strong><br />
JET<br />
USA<br />
USSR
ARTSIMOVICH MEMORIAL LECTURE<br />
J.F. CLARKE<br />
Associate Director for Fusion Energy,<br />
Office of Energy Research,<br />
United States Department of Energy,<br />
Washington, D.C.,<br />
United States of America<br />
Mr. Chairman, Ladies <strong>and</strong> Gentlemen,<br />
<strong>IAEA</strong>-CN-47/A-0<br />
I want to thank the International Atomic Energy Agency (<strong>IAEA</strong>) for asking me<br />
to give this address. I consider it an honour to be here, to be speaking to you —<br />
scientists of many races <strong>and</strong> nationalities united by a common effort to provide fusion<br />
power to the world. I am especially pleased to join you in honouring the memory of<br />
Lev Artsimovich, a man who contributed so much to the achievement of our goal.<br />
This occasion is particularly meaningful to me, because it marks the 25th<br />
anniversary of my own involvement in fusion research. In 1961, as a young doctoral<br />
c<strong>and</strong>idate in physics at MIT, I was fortunate enough to be offered the opportunity<br />
to choose my field of study under masters of almost all of the disciplines of physics.<br />
For a young man, the choice was bewildering. After much thought, I finally settled<br />
on a field for a most unscientific reason. That field was the relatively undeveloped<br />
— <strong>and</strong> at the time unprestigeous — field of plasma physics. The reason for my choice<br />
was a simple one. I learned that plasma physics might hold the key to unlimited<br />
energy for the people of the world. That possibility engaged the enthusiasm of a<br />
young man. I have never regretted that decision. Over the years, the science of<br />
plasma physics has grown into a major scientific field <strong>and</strong> has provided all of the<br />
professional satisfaction <strong>and</strong> excitement a scientist could desire. Moreover, my<br />
primary motivation for choosing plasma physics — the benefit that might one day<br />
flow from the science — has been strengthened as the reality of the promised<br />
contribution to the future well-being of humanity has become more certain.<br />
I believe that this motivation is a distinguishing characteristic that unites fusion<br />
scientists. It is widely recognized that all scientists are united by their common<br />
professional endeavours. This is certainly true in fusion research. However, in<br />
working with fusion scientists <strong>and</strong> engineers from many countries, I have found a<br />
stronger bond than merely sharing scientific skills — a bond that comes from<br />
applying those skills in the service of humanity.<br />
This lecture honours the memory of one of our fraternity. A man who exemplified<br />
dedication to this higher purpose. Lev Artsimovich will always be remembered<br />
as a giant in the development of fusion power. His scientific contributions were<br />
certainly important, <strong>and</strong> yet, his stature rests on more than this. He was a giant
4 CLARKE<br />
because of his wisdom, courage, skill, <strong>and</strong>, most of all, his dedication to our common<br />
purpose.<br />
Fortunately, he was not alone in these qualities. Throughout the history of<br />
fusion development there have been a number of scientist/statesmen who shared the<br />
dream of harnessing fusion power, but who also saw the task was beyond the<br />
capability of their own laboratory. More importantly, these men had the wisdom to<br />
see that — in practical if not in absolute sense — the task was possibly beyond the<br />
capability of their own nation.<br />
Over the years, men like Igor Kurchatov, Lev Artsimovich, Evgenij Velikhov,<br />
Edward Teller, David Rose, Hans Otto Wiister, Donato Palumbo, Koji Husimi,<br />
Tatsuoki Miyajima, <strong>and</strong> others have advocated international co-operation in the<br />
development of fusion power. Moreover, they had the courage to act to make<br />
co-operation possible. In honouring these men for their wisdom, we must not ignore<br />
their courage. Advocating co-operation takes wisdom. Acting upon it takes courage.<br />
I really began to appreciate the degree of courage required of them as I prepared<br />
for this address. Since Artsimovich is identified with international co-operation in<br />
fusion, I began to reflect on the very first international meeting on fusion. It took<br />
place at Harwell in Great Britain, in 1956 — thirty years ago. The date is important.<br />
It was a time of great political tension <strong>and</strong> rivalry in the world. I have only to mention<br />
the places: Indochina, Korea, Formosa, Berlin, Hungary, <strong>and</strong> Suez, to recall the<br />
occasions of confrontation. To heighten the tension — if that were possible — the<br />
major world powers had developed <strong>and</strong> were racing to deploy the new military<br />
technologies of the hydrogen bomb <strong>and</strong> the ICBMs, <strong>and</strong> the world was on the verge<br />
of the space race with the Soviet preparations to launch Sputnik. In a small way,<br />
fusion research mirrored these tensions <strong>and</strong> rivalries. National programmes worked<br />
in rivalry <strong>and</strong> secrecy to achieve the first fusion reaction <strong>and</strong> thereby obtain for their<br />
country a significant technological advantage — unlimited, economical energy or,<br />
perhaps, even some military advantage. On an even more human scale, key figures<br />
within national programmes struggled to exp<strong>and</strong> their own laboratory's share in a<br />
programme that they believed would surely make them Nobel Laureates.<br />
Fortunately, then as now, the leaders of the major nations were seeking ways<br />
to improve relations <strong>and</strong> reduce tensions, <strong>and</strong> scientists/statesmen were at the<br />
forefront of the initiatives. In 1953, President Eisenhower made his Atoms for Peace<br />
proposal at the United Nations. By 1954, the United States <strong>and</strong> the Soviet Union had<br />
agreed to consider exchanging atomic energy information, <strong>and</strong> by 1955, the first<br />
Geneva Conference on the Peaceful Uses of Atomic Energy was held. At this Conference,<br />
Homi Bhabha of India first alerted the world at large to the potential of fusion<br />
research. In 1956, Igor Kurchatov took the next step by openly discussing Soviet<br />
fusion work while visiting Great Britain. The result was that by 1958, the time of<br />
the Second Geneva Conference on the Peaceful Uses of Atomic Energy, the situation<br />
of secrecy <strong>and</strong> rivalry in fusion had changed. The papers of Artsimovich, Teller,<br />
Biermann, Thonemann, <strong>and</strong> Alfven summarized previously hidden research in<br />
fusion. As a result of these events, the European Countries, the United States, <strong>and</strong><br />
the Soviet Union agreed to open magnetic fusion research.
<strong>IAEA</strong>-CN-47/A-0 5<br />
Historians of the period record many political factors leading to the change.<br />
However, I believe it was mainly a result of the wisdom, courage, <strong>and</strong> dedication<br />
of both national political leaders <strong>and</strong> the scientific leaders in the national fusion<br />
programmes. The scientific leaders realized that fusion would be achieved most<br />
directly by uniting the scientific talents of the world. The political leaders recognized<br />
that co-operation on fusion — an effort in the interest of all mankind — could help<br />
to reduce world tension <strong>and</strong> rivalry. They had the courage to take the risk <strong>and</strong> try<br />
to establish international co-operation in fusion in spite of political tension <strong>and</strong> voices<br />
of caution in their own countries. They had the wisdom to create useful co-operative<br />
mechanisms, such as the <strong>IAEA</strong>, <strong>and</strong> the dedication to live up to these commitments<br />
for almost three decades.<br />
It is well to reflect on our beginnings <strong>and</strong> to realize that our scientific success<br />
today rests on a remarkable foundation. It is simply that in fusion research, national<br />
political leaders <strong>and</strong> fusion scientific leaders have been able to transcend their own<br />
parochial interests in an effort to achieve a plentiful supply of energy for future<br />
generations.<br />
Today, we have a situation similar in many ways to that which existed in 1958.<br />
Political tensions are high <strong>and</strong> the power <strong>and</strong> number of modern weapons has raised<br />
the premium on reducing those tensions. On a political level, world leaders are<br />
struggling with major issues, such as nuclear disarmament. As in the 1950s, they are<br />
also looking toward co-operation on fusion as a means to reduce tensions <strong>and</strong> increase<br />
underst<strong>and</strong>ing. Recently, Andronik Petrosyants, Chairman of the Soviet State<br />
Committee on the Utilization of Atomic Energy, acknowledge this when he said that,<br />
in the view of the Soviet Union, scientific co-operation has great political significance<br />
in that it helps to strengthen peace <strong>and</strong> lessens the danger of new global war.<br />
On the scientific level, fusion leaders are beginning to realize that in order to<br />
exploit our successes <strong>and</strong> complete the development of fusion power, a new degree<br />
of collaboration may be necessary that will allow us to build facilities that go beyond<br />
the resources available in any one national programme.<br />
These factors led to the discussion of fusion at the Geneva Summit <strong>and</strong> at the<br />
recent Reykjavik meeting. The Reagan-Gorbachev initiative to exp<strong>and</strong> fusion<br />
co-operation <strong>and</strong> the positive reactions of other world leaders to the initiative have<br />
provided the political m<strong>and</strong>ate <strong>and</strong> opportunity to accelerate progress in our field. It<br />
urges us to combine our resources in new ways for mutual benefit. The issue for us<br />
to decide is "How should we, the international fusion community, respond to this<br />
opportunity?"<br />
I would like to discuss this question in the remainder of this lecture. First, it<br />
is clear that there is a technical imperative for closer co-operation. This was clearly<br />
recognized by Artsimovich from the very beginning. At Geneva, in 1958, he said:<br />
' 'This problem (of fusion) seems to have been created especially for the purpose of<br />
developing close co-operation between scientists <strong>and</strong> engineers of various countries,<br />
working at this problem according to a common plan, <strong>and</strong> continuously exchanging<br />
the results of their calculations, experiments, <strong>and</strong> engineering developments." In the
6 CLARKE<br />
years since these words were uttered, the nations of the world have developed a<br />
remarkable degree of co-operation in fusion. The most outst<strong>and</strong>ing example is, of<br />
course, the common fusion programme developed by the European Communities.<br />
Within the European Atomic Energy Community, the words of Artsimovich have<br />
been borne out to the letter, <strong>and</strong> the obvious benefits are clearly evident in the<br />
achievements of the JET facility.<br />
On the wider international scene, numerous co-operative projects <strong>and</strong><br />
exchanges have also advanced the field. We have created effective mechanisms for<br />
co-operation through the International Atomic Energy Agency, the International<br />
Energy Agency (IEA), the US A/ Japan <strong>and</strong> the USA/USSR bilateral agreements in<br />
fusion, <strong>and</strong>, most recently, the Fusion Working Group of the Economic Summit<br />
countries. Although fusion co-operation outside of the European Summit countries.<br />
Although fusion co-operation outside of the European Communities has not reached<br />
the stage of working to a common plan described by Artsimovich, there has been<br />
significant movement in that direction over the last few years.<br />
The science of fusion is by no means finished. The remaining scientific steps<br />
will require new, expensive facilities <strong>and</strong> equally expensive operation of these<br />
facilities. The relatively new technology research will require perhaps more<br />
expensive facilities. If it existed, the common plan envisioned by Artsimovich would<br />
allow this work to be shared, duplication to be avoided, <strong>and</strong> the available technical<br />
expertise in the world to be used to best advantage. The practical benefit of this was<br />
recognized by Donato Palumbo in his 1980 Artsimovich Lecture. He questioned<br />
whether each of the four big programmes could proceed individually to address next<br />
generation fusion issues, <strong>and</strong> at the same time continue other necessary activities<br />
along a wider front. A common plan would allow a broader attack on these difficult<br />
problems within available resources. With this in mind, the Heads of State of the<br />
Economic Summit nations set up the Fusion Working Group (FWG) to examine the<br />
fusion development plans of participating countries, in an effort to identify opportunities<br />
for working to a common plan.<br />
The Fusion Working Group has agreed that the remaining problems of fusion<br />
can be summarized by four critical issues. These issues are: improving magnetic<br />
confinement concepts to make them more amenable to practical application,<br />
investigating the scientific problems associated with a burning plasma, developing<br />
materials suitable for fusion reactors, <strong>and</strong> solving the problems of fusion nuclear<br />
technology. The work of the FWG in joint planning to resolve the four critical issues<br />
is not finished, but already its practical effects are evident.<br />
The FWG has examined national plans for addressing the burning plasma issue.<br />
They concluded that a machine like the European NET, or the Japanese FER, is<br />
needed in the late 1990s to complete the scientific base <strong>and</strong> to address the technical<br />
feasibility of fusion. They concluded that it was valuable <strong>and</strong> feasible to attempt a<br />
short pulse ignition experiment in the early 1990s to gain realistic operating<br />
experience with a burning fusion plasma. The United States of America has taken on<br />
this latter task <strong>and</strong> has produced a conceptual design for a Compact Ignition Device
<strong>IAEA</strong>-CN-47/A-0 7<br />
(CIT) which, depending on details of funding, will operate as early as 1993. The<br />
Europeans <strong>and</strong> Japanese have continued to develop designs for a facility with the<br />
broader technical aim that might be ready for construction decisions at about the time<br />
CIT is completed.<br />
The FWG has also examined the national plans in fusion nuclear technology <strong>and</strong><br />
materials. In the latter area, their deliberations were aided greatly by a detailed study<br />
of the IEA members' fusion materials programmes by an IEA Blue Ribbon Panel,<br />
chaired by Professor Amelinckx of Belgium. In both areas, it was found that a<br />
co-ordinated international programme was possible <strong>and</strong> desirable.<br />
Finally, in a recent meeting of the Co-ordinating Committee of the USA/USSR<br />
Co-operative Agreement on the Peaceful Uses of Atomic Energy, it was agreed to<br />
begin the process of joint planning in order to improve the co-ordination of the US<br />
<strong>and</strong> the USSR fusion programmes.<br />
So, in small steps, using all the mechanisms of co-operation established over<br />
the years since Artsimovich made his statement in 1958, we appear to be moving<br />
toward his common plan. However, the movement is not without difficulty. I have<br />
already remarked on the courage of Artsimovich in making this proposal, considering<br />
the time at which it was made. The courage dem<strong>and</strong>ed of us is becoming more<br />
evident as we face the difficulty of actually implementing his proposal on a<br />
world scale.<br />
The difficulty is not technical. The above examples show that technical agreement<br />
can be reached if we wish to do so. The real difficulty was well described by<br />
Hans-Otto WUster in testimony to the US Congress in 1985 on the process of<br />
achieving a unified European fusion programme. He noted that international collaboration<br />
on the scale achieved in Europe is the result of the general insight that, because<br />
of resource limitations, research in separate nations could not be as successful as a<br />
joint effort. As Wiister so pungently remarked, "After all, if you have a common<br />
aim <strong>and</strong> want to do something, youd will find a way to give in to reason." If the<br />
world fusion programme has lagged behind the European Communities in achieving<br />
a common plan, it is probably due to lack of agreement on the necessity to work more<br />
closely together to achieve a common aim within our total financial <strong>and</strong> human<br />
resources. Reaching agreement on the necessity of working together is difficult,<br />
because it involves many non-technical factors. It involves the personal ambitions of<br />
scientists, as well as institutional ambitions of laboratories. The dedication to a common<br />
aim must be very strong to motivate an appropriate balance between such ambitions<br />
<strong>and</strong> more efficient pursuit of our common goal.<br />
In considering how the fusion community should respond to the opportunity<br />
presented by the Geneva Summit, we need to look more closely at this question. What<br />
aim do we have in common <strong>and</strong> is it necessary that it be achieved jointly? The<br />
heightened necessity for co-operation was perceived as long ago as 1977. David Rose<br />
— a man who can justly be called the father of fusion technology — became<br />
concerned about the possibility of reaching the goal of fusion power. His worry was<br />
not primarily technical, although he recognized — perhaps more clearly than anyone
8 CLARKE<br />
at the time — the real technical problems that would have to be overcome to<br />
demonstrate the scientific <strong>and</strong> technical feasibility of fusion. No, he foresaw that the<br />
solution of these problems would require large, expensive facilities. He knew that<br />
these would also take a long time to plan, <strong>and</strong> operate. Finally, he knew that the<br />
practical benefit of fusion would be in doubt until the end of this expensive <strong>and</strong> long<br />
term programme. His worry was that national governments would be reluctant to<br />
spend such large sums for these facilities — let alone even more for larger, but<br />
essential support programmes — without clearer indication that fusion will work <strong>and</strong><br />
be more attractive than fission breeders or bulk solar power. His conclusion was that<br />
a world fusion programme conducted according to a common plan was needed if<br />
these facilities were to be built.<br />
His arguments defining the necessity of intensified co-operation led Director<br />
General Sigvard Eklund, of the <strong>IAEA</strong>, to request the views of member governments<br />
on the possibility of greater collaboration, <strong>and</strong>, in particular, their consideration of<br />
how to take the major step after JET, JT-60, T-15, <strong>and</strong> TFTR — the step that would<br />
complete the scientific base <strong>and</strong> demonstrate the technical feasibility of fusion. In<br />
response, very much in the tradition of Artsimovich, Academician Velikhov<br />
proposed that a joint group with participants from the European Communities, Japan,<br />
the United States, <strong>and</strong> the USSR should be formed to investigate a project to build<br />
a tokamak reactor experiment.<br />
This proposal led, in 1978, to the organization of the INTOR Workshop. Over<br />
the last eight years, this Workshop, under the leadership of Sigeru Mori, Giinter,<br />
Grieger, Weston Stacey <strong>and</strong> Boris Kadomtsev, has clarified the nature <strong>and</strong> magnitude<br />
of a facility that could complete the scientific base <strong>and</strong> address the technical<br />
feasibility of fusion. Through their pioneering efforts <strong>and</strong> the steadfast support of the<br />
<strong>IAEA</strong>, we have developed a worldwide appreciation of the key role in fusion<br />
development <strong>and</strong> the technical requirements of such a facility. The INTOR work has<br />
been the essential ingredient in creating a world consensus on a major step in fusion.<br />
During the past year, discussions based largely on the INTOR work have taken<br />
place among the Economic Summit nations within the framework of the Fusion<br />
Working Group, between the USA <strong>and</strong> the USSR in bilateral meetings, <strong>and</strong> among<br />
key figures from all the world's major fusion programmes in the Director General's<br />
International Fusion Research Council. All parties have reached a consensus that a<br />
device of the INTOR type, generally known as an Experimental or Engineering Test<br />
Reactor (ETR), is the common midterm goal of the world's fusion programmes. As<br />
a result, we finally seem to have arrived at agreement on the common aim that Wiister<br />
referred to.<br />
However, it remains to be seen whether we will find a way to give in to reason.<br />
During the development of the ETR concept through the INTOR Workshop, all the<br />
participating nations put a considerable, if not principal, effort on defining their own<br />
national versions of this next step — NET in Europe, FER in Japan, OTR in the<br />
Soviet Union, <strong>and</strong> FED, or more recently TIBER, in the United States. Having come<br />
so far <strong>and</strong> having surmounted so many problems in international collaboration, one
<strong>IAEA</strong>-CN-47/A-0 9<br />
could take comfort in the thought that the passage of time will allow a coalescence<br />
of these technical approaches. And yet, I cannot ignore the sense that history is<br />
pressing upon us to make a decision on how we wish to take this next critical step<br />
in fusion development. We should all recall Professor Husimi's gentle reminder in<br />
his 1982 Artsimovich memorial lecture, "...the public has for a long time been<br />
eagerly waiting to see the production of fusion energy". I am also spurred in a not<br />
so gentle way by the knowledge that the world has spent between the equivalent of<br />
US $15 billion <strong>and</strong> US $20 billion dollars to date in the quest for that production of<br />
fusion energy. Once we have the technical capability, every year that we avoid a<br />
decision to move forward to the next step adds roughly another billion dollars to that<br />
total. For this reason, I believe we must take every opportunity to move forward as<br />
soon as the technical capability becomes available.<br />
Based on recent technical progress, I suspect the technical capability to build<br />
an ETR can be attained within a few years. Therefore, it seems reasonable that we<br />
should use the opportunity presented by the Geneva initiative to move as far as<br />
possible in preparing for an ETR. If the existence of five different technical<br />
approaches prevents near term agreement on a common project, we should consider<br />
taking the steps necessary to coalesce those technical approaches. If we lack the<br />
complete technical base to support commitment to construction, let us consider<br />
co-ordinating the research of our programmes to provide the missing information.<br />
Preparing one design <strong>and</strong> co-operating to prepare a sound technical base would not<br />
guarantee that an ETR would be built in common. However, it should help guarantee<br />
both that it would be built <strong>and</strong> that whatever nation or group of nations undertook<br />
the project would have a maximum chance at success.<br />
Political leaders seem to recognize the need for collaboration in such tasks. In<br />
the recent meeting in Reykjavik, President Reagan <strong>and</strong> General Secretary Gorbachev<br />
agreed on a renewed effort to reach agreement on specific actions in exp<strong>and</strong>ing fusion<br />
co-operation. I am very pleased that on October 30, the United States transmitted a<br />
formal proposal to the Economic Summit Nations <strong>and</strong> the Soviet Union. The proposal<br />
was to join together to prepare a conceptual design report (CDR) for an ETR. It<br />
recommended that we adopt the suggestion of Director General Hans Blix that we<br />
build on the INTOR process to carry out the work. It also advocated that the research<br />
<strong>and</strong> development necessary to support the CDR be undertaken co-operatively through<br />
existing agreements. The proposal indicated that the United States was prepared to<br />
commit sufficient resources to accomplish this task within three years. If accepted,<br />
this proposal could lead to a major focusing on world resources on preparing for an<br />
ETR — the most widely accepted element on a common fusion plan.<br />
Lev Artsimovich offered us the vision of scientists in all nations working<br />
together on the fusion problem according to a common plan. Just as the vision of a<br />
world served by fusion power engaged the enthusiasm of a young man twenty-five<br />
years ago, the vision of a world united in a common fusion effort engages the<br />
enthusiasm of an older man today. However — perhaps because of age — it is an<br />
enthusiasm tempered by realism. Without in the least minimizing the difficulty of the
10 CLARKE<br />
remaining problems of fusion science <strong>and</strong> technology, I would suggest that<br />
attempting to merge our futures in a common plan may be a more difficult task. I<br />
do not know if we can succeed. But then Artsimovich did not know that we would<br />
ever overcome the difficult scientific problems to reach reactor-grade plasma conditions<br />
in a tokamak. He persevered in spite of the scientific difficulty <strong>and</strong> uncertainty.<br />
I believe we, too, should persevere in spite of the human difficulty <strong>and</strong> uncertainty.<br />
Lev Artsimovich <strong>and</strong> Hans-Otto Wiister would surely have recognized the difficulties<br />
that must be overcome. Remembering what they attempted in their lives, I am<br />
tempted to think they might have advised us in words similar to those of Professor<br />
Husimi in his 1982 Artsimovich lecture: "Difficulty does not cause despair;<br />
difficulty invites courage, particularly when the goal is splendid."
RECENT EXPERIMENTS IN JT-60<br />
<strong>IAEA</strong>-CN-47/A-M<br />
JT-60 TEAM<br />
(Presented by M. Yoshikawa)<br />
T. Abe, H. Aikawa, H. Akaoka, H. Akasaka, M. Akiba, N. Akino, T. Akiyama,<br />
T. Ando, K. Annoh, N. Aoyagi, K. Arakawa, M. Araki, K. Arimoto, M. Azumi,<br />
S. Chiba, M. Dairaku, N. Ebiswa, T. Fujii, T. Fukuda, H. Furukawa,<br />
K. Hamamatsu, K. Hayashi, M. Hara, K. Haraguchi, H. Hiratsuka, T. Hirayama,<br />
S. Hiroki, K. Hiruta, M. Honda, H. Horiike, R. Hosoda, N. Hosogane, Y. Iida,<br />
T. Iijima, K. Ikeda, Y. Ikeda, T. Imai, T. Inoue, N. Isaji, M. Isaka, S. Ishida,<br />
N. Itige, T. Ito, Y. Ito, A. Kaminaga, M. Kawai, Y. Kawamata, K. Kawasaki,<br />
K. Kikuchi, M. Kikuchi, H. Kimura, T. Kimura, H. Kishimoto, K. Kitahara,<br />
S. Kitamura, A. Kitsunezaki, K. Kiyono, N. Kobayashi, K. Kodama, Y. Koide,<br />
T. Koike, M. Komata, I. Kondo, S. Konoshima, H. Kubo, S. Kunieda,<br />
S. Kurakata, K. Kurihara, M. Kuriyama, T. Kuroda, M. Kusaka, Y. Kusama,<br />
S. Maehara, K. Maeno, S. Mase, S. Matsuda, M. Matsukawa, T. Matsukawa,<br />
M. Matsuoka, N. Miya, K. Miyati, Y. Miyo, K. Mizuhashi, M. Mizuno, R. Murai,<br />
Y. Murakami, M. Muto, M. Nagami, A. Nagashima, K. Nagashima,<br />
T. Nagashima, S. Nagaya, H. Nakamura, Y. Nakamura, M. Nemoto, Y. Neyatani,<br />
S. Niikura, H. Ninomiya, T. Nishitani, H. Nomata, K. Obara, N. Ogiwara,<br />
Y. Ohara, K. Ohasa, T. Ohga, H. Ohhara, M. Ohkubo, T. Ohshima, K. Ohta,<br />
M. Ohta, M. Ohtaka, Y. Ohuchi, A. Oikawa, H. Okumura, Y. Okumura,<br />
K. Omori, S. Omori, Y. Omori, T. Ozeki, M. Saigusa, K. Sakamoto, A. Sakasai,<br />
S. Sakata, M. Satou, M. Sawahata, M. Seimiya, M. Seki, S. Seki, K. Shibanuma,<br />
R. Shimada, K. Shimizu, M. Shimizu, Y. Shimomura, S. Shinozaki, H. Shirai,<br />
H. Shirakata, M. Shitomi, K. Suganuma, T. Sugie, T. Sugiyama, H. Sunaoshi,<br />
K. Suzuki, M. Suzuki, M. Suzuki, N. Suzuki, S. Suzuki, Y. Suzuki,<br />
H. Takahashi', M. Takahashi, S. Takahashi, T. Takahashi, M. Takasaki,<br />
M. Takatsu, A. Takeshita, H. Takeuchi, S. Tamura, S. Tanaka, K. Tani,<br />
M. Terakado, T. Terakado, K. Tobita, T. Tokutake, T. Totsuka, N. Toyoshima,<br />
H. Tsuda, T. Tsugita, S. Tsuji, Y. Tsukahara, M. Tsuneoka, K. Uehara,<br />
M. Umehara, Y. Uramoto, H. Usami, K. Ushigusa, K. Usui, J. Yagyu,<br />
K. Yamada, M. Yamamoto, O. Yamashita, Y. Yamashita, K. Yano, T. Yasukawa,<br />
K. Yokokura, H. Yokomizo, H. Yoshida, M. Yoshikawa, Y. Yoshinari,<br />
R. Yoshino, I. Yonekawa, K. Watanabe<br />
Naka Fusion Energy Research Establishment,<br />
Japan Atomic Energy Research Institute,<br />
Naka-machi, Naka-gun, Ibaraki-ken,<br />
Japan<br />
Abstract<br />
RECENT EXPERIMENTS IN IT-60.<br />
The paper describes the Joule heating experiment <strong>and</strong> more recent NBI <strong>and</strong> ICRF heating <strong>and</strong><br />
LHRF current drive experiments made in JT-60 in the past three months. JT-60 is a large tokamak with<br />
a poloidal divertor using TiC as first wall material. It is currently operated at a level of Ip < 2.0 MA,<br />
1 Princeton Plasma Physics Laboratory, Princeton University, NJ, USA.<br />
11
12 JT-60 TEAM<br />
PNB < 20 MW, PIC < 1.4 MW, PLH < 1.2 MW. The plasma is characterized by a wide range of<br />
operational parameters: 0.1 x 10 19 cm" 3 < ne < 9.7 X 10 19 m" 3 <strong>and</strong> qeff > 2.2 <strong>and</strong> by a very<br />
low impurity content, Zrff a 1.5, <strong>and</strong> Prad >5%. The energy confinement time is about 0.5 s for Joule<br />
heated plasmas at high densities <strong>and</strong> 0.12 s for NB heated plasmas at high heating power. In the LHRF<br />
experiment an LH driven current up to 1.5 MA is obtained, <strong>and</strong> a synergetic effect of LH current drive<br />
<strong>and</strong> NB heating to enhance current drive <strong>and</strong> heating efficiency is observed. In the ICRF experiment,<br />
the heating has an efficiency of 0.18 J-W" 1 <strong>and</strong> is found to reduce the hydrogen recycling.<br />
1. INTRODUCTION<br />
JT-60 is a long pulse tokamak device with a plasma of circular cross-section <strong>and</strong><br />
a poloidal divertor placed radially outside. Three means of intense heating, NBI,<br />
LHRF, <strong>and</strong> ICRF are provided, the latter two of which can also be used for studying<br />
RF current drive. The main parameters of JT-60 are listed in Table I. The operation<br />
of JT-60 was started in April 1985; it was shut down in July 1985 for the installation<br />
of heating systems. After the Joule heating experiment, which took about five<br />
months, the heating <strong>and</strong> current drive experiments were started in August 1986.<br />
The present paper reviews the present status of the JT-60 experiment on Joule<br />
heating [1-4], NBI <strong>and</strong> ICRF heating, <strong>and</strong> LHRF current drive. The status of JT-60<br />
will be described in the next section, <strong>and</strong> experimental results will be presented <strong>and</strong><br />
discussed in later sections.<br />
2. STATUS OF JT-60<br />
In this section, we present technical features of JT-60, in particular, those<br />
relevant to the description of experimental results. Detailed technical descriptions of<br />
JT-60 are provided in Refs [3-5]. Table I compares the designed <strong>and</strong> the achieved<br />
values of the main parameters <strong>and</strong> shows that JT-60 is now being operated near its<br />
maximum performance although more conditioning is required to raise the power<br />
h<strong>and</strong>ling capability of the RF launchers.<br />
The cross-section of the vacuum vessel is shown in Fig. 1. The toroidal limiters,<br />
divertor plates, in-board armour plates, <strong>and</strong> the protective plates of the divertor coils<br />
are made of molybdenum coated with TiC of 20 jum thickness. Protective plates<br />
elsewhere are made of Inconel 625, coated with TiC of the same thickness. Since no<br />
large horizontal ports are available on the vacuum vessel, profile measurements rely<br />
heavily on the four large ports at an angle of ±4° with the midplane as well as on<br />
the array of vertical ports.<br />
To block the backflow of discharge gas compressed in the divertor chamber,<br />
the gaps between the divertor coils <strong>and</strong> the vacuum vessel are sealed, except at the<br />
pumping ports where deflecting plates are placed to guide the backflow into the<br />
pumping ports. Additional Zr-AI getter pumps of an effective total pumping speed
<strong>IAEA</strong>-CN-47/A-I-1 13<br />
TABLE I. DESIGNED AND ACHIEVED PARAMETERS OF JT-6O<br />
(a) JT-60 Parameters<br />
Major Radius<br />
Miner Radius<br />
Toroidal Field*<br />
Plasma Current<br />
Pulse Length<br />
Designed Achieved<br />
(Divertor)<br />
3.0 m 3.10 m<br />
0.95 m 0.90 m<br />
4.5 T** 4.5 T<br />
2.7 MA 2.0 MA<br />
10 s 10 s<br />
(Limiter)<br />
3.04 m<br />
0.90 m<br />
4.5 T<br />
2.0 MA<br />
10 s<br />
* At a major radius of 3 m, ** 2.1 MA with divertor<br />
(b) JT-60 NBI Parameters<br />
Total power into torus<br />
Number of beamlines<br />
Number of sources<br />
Beam energy<br />
Species power ratio*<br />
Pulse length<br />
Designed<br />
20<br />
14<br />
28<br />
75<br />
MW<br />
keV<br />
(Test)**<br />
20 MW<br />
14<br />
28<br />
-100 keV<br />
80:13:7<br />
Achieved<br />
(With plasma)<br />
20 MW<br />
14<br />
28<br />
£75 keV<br />
75:16:9<br />
2 s<br />
10 s 10 sec<br />
* H°(E): H°(E/2):H°(E/3) at 75 keV,<br />
** Each beamline tested separately in a test st<strong>and</strong><br />
(c) JT-60 RF Parameters<br />
Designed<br />
Achieved<br />
Lower Hybrid<br />
(Test)* (With plasma)<br />
Frequency<br />
1.7-2.23GH2 1.7-2.23GHZ<br />
Number of units 3<br />
3<br />
Power tubes per unit 8 klystrons 8<br />
Power at sources 24 MW 24 MW<br />
Power into torus 15 MW _<br />
Power into plasma 7.5 MW -<br />
Pulse length<br />
10 s 10 s<br />
Ion Cyclotron<br />
2.0 GHz<br />
1<br />
8<br />
2.0 MW<br />
1.2<br />
-<br />
0.75 s<br />
Frequency<br />
Number'<br />
of units<br />
Power tubes<br />
Power at source<br />
Power into torus<br />
Power into plasma<br />
Pulse length<br />
110-130MH2<br />
1<br />
8 Tetrodes<br />
6 MW<br />
5 MW<br />
2.5MW<br />
10 s<br />
110-130MHZ<br />
1<br />
8<br />
6 MW<br />
-<br />
-<br />
10 s<br />
120 MHz<br />
1<br />
8<br />
1.6 MW<br />
1.4 MW<br />
-<br />
1.2 s<br />
* Each unit tested separately
14<br />
POLOIDAL FIELD COIL<br />
VACUUM VESSEL<br />
JT-60 TEAM<br />
DEFLECTION PLATE<br />
DIAGNOSTICS PORT<br />
FIG. I. Cross-section of vacuum vessel.<br />
PUMPING PORT<br />
DIVERTOR COILS<br />
DIVERTOR PLATE<br />
of 5 m 3 • s ' (H2) are connected at the divertor chamber to pump the hydrogen gas<br />
built up in the chamber.<br />
Nearly the entire diagnostic equipment manufactured is now in working order.<br />
Its availability in the experiments is quite high. A list of diagnostic equipment is given<br />
in Table II.<br />
3. OPERATIONAL CHARACTERISTICS<br />
3.1. Machine operation<br />
Figure 2 shows the time behaviour of typical divertor <strong>and</strong> limiter discharges in<br />
JT-60. In most discharges, hydrogen prefill is used since helium prefill tends to lead<br />
to a disruptive discharge during the ramp-up phase. Later in the discharge, gas feed<br />
of hydrogen or helium (as in Fig. 2) is performed through gas valves which are placed<br />
at the main vacuum vessel or at the divertor chamber. The content of hydrogen in<br />
the 'helium' discharge is not precisely known although an estimate from neutral beam<br />
shinethrough indicates that the helium ion content is higher than the hydrogen content<br />
during the NB heating. In some discharges, the plasma density is feedback controlled<br />
so as to evolve according to the instructions before the discharge.
TABLE II. DIAGNOSTICS IN JT-6O<br />
Plasma<br />
parameter<br />
Electron<br />
Density<br />
Electron<br />
Temperature<br />
Ion<br />
Temperature<br />
Impurity<br />
Radiation<br />
Flux<br />
Peripheral<br />
Plasma<br />
Divertor<br />
Plasma<br />
FIR Interferometer<br />
2-mm Interferometer<br />
Fourier Transform<br />
Spectrometer<br />
Thomson Scattering<br />
System<br />
CX Particle Analyser<br />
Active Beam Scattering<br />
System<br />
CX Recombination<br />
Spectrometer<br />
Neutron Counter<br />
VUV Spectrometer (2)<br />
Doppler Spectrometer<br />
Crystal Spectrometer<br />
Visible Spectrometer I<br />
Visible Spectrometer 11<br />
Grazing Incidence<br />
Spectrometer<br />
SX High Speed PHA<br />
PIN Diode Array<br />
Bolometer Array<br />
HX Detector<br />
Visible TV<br />
Magnetic Probes,<br />
Thermocouples<br />
Ha Diode Array<br />
FIR Interferometer<br />
Visible Spectrometer<br />
VUV Spectrometer<br />
Ho Diode Array<br />
Bolometer Array<br />
Thermocouple Array<br />
IR & Visible TV<br />
<strong>IAEA</strong>-CN-47/A-I-1 15<br />
Sub-systems<br />
3ch, CH30H Laser (118.8 *nn)<br />
lch<br />
ECE<br />
Multi-pulse Ruby/YAG Laser<br />
(6ch)<br />
E=0.1 -llOkeV, E//B<br />
200keV-3,5A, He, e =7 g<br />
(on Active Beam)<br />
E =1.5-4 MeV<br />
0.2 -500 A, Holographic Grating<br />
5 -9000 A<br />
0.6-2.7 A<br />
2000-7000A, Spectrograph,<br />
Photo-Multiplier<br />
The same as above, Rotating<br />
Mirror<br />
10-1300 A<br />
lch<br />
17ch<br />
16ch<br />
3ch<br />
61ch<br />
4ch, 3ch, lch<br />
2ch, CH3OH Laser<br />
2ch<br />
2 -1200 A, Holographic Grating<br />
4ch<br />
4ch<br />
(on Divertor Plate)<br />
2ch
16<br />
0<br />
> 3<br />
^ 2<br />
I<br />
,~0.5<br />
il<br />
O-<br />
_ 0<br />
i 4<br />
JT-60 TEAM<br />
DIVERTOR IE2229) LIMITER (E2I87I<br />
° 2<br />
x°<br />
0 0 5<br />
t (s)<br />
10 0<br />
FIG. 2. Divertor <strong>and</strong> limiter discharges with NB heating.<br />
The discharge is usually initiated as a limiter discharge. In the case of divertor<br />
experiments, it is then switched over to a divertor discharge by exciting the divertor<br />
coil current with a typical delay of a few hundred milliseconds. Feedback control is<br />
applied, with a sampling time of 1 ms, to the plasma current, <strong>and</strong> the vertical <strong>and</strong><br />
the horizontal field coil currents. The quadrupole <strong>and</strong> the divertor coil currents are<br />
either preprogrammed (as in Fig. 2) or feedback controlled with special attention to<br />
precise positioning of the separatrix magnetic surface with respect to the closest<br />
limiter <strong>and</strong> the divertor plates [1]. In some of the discharges, the intersection of the<br />
separatrix magnetic surfaces is swept over a width of several centimetres by<br />
modulating the divertor coil current to reduce the peak heat load at the divertor plates.<br />
The supplementary heating power can be applied at any desired time during the<br />
discharge. The discharge is terminated by turning off the heating power <strong>and</strong> the gas<br />
feed, <strong>and</strong> then the plasma current. In hydrogen discharges, the plasma density can<br />
be reduced simultaneously with the plasma current, while in helium discharges the
<strong>IAEA</strong>-CN-47/A-M 17<br />
density stays high until the end of the discharge because of the longer effective<br />
particle confinement time. The discharge ends as a limiter discharge such as it has<br />
been initiated.<br />
3.2. Operational regime<br />
JT-60 is rather routinely operated near its maximum rating (Table I), as<br />
required by the experimental plan. Statistically, a large fraction of experiments is<br />
made near the maximum toroidal magnetic field. The plasma current is usually varied<br />
with steps of 0.5 MA up to 2 MA.<br />
The operational regime of JT-60 divertor plasmas extends over a wide range of<br />
plasma parameters. Figures 3(a) <strong>and</strong> 3(b) show the regime for NB heated<br />
divertor (D) <strong>and</strong> limiter (L) discharges as well as for Joule heated hydrogen divertor<br />
discharges. The lower limit of qeff is about 2.2 in both NB heated <strong>and</strong> Joule heated<br />
discharges. Attempts to reduce qeff closer to 2.0 result in disruptive discharges.<br />
In Joule heated discharges efforts are made to explore the upper limits<br />
of He <strong>and</strong> the Murakami parameter neRp/BT, which are 9.7 X 10 19 m~ 3 <strong>and</strong><br />
6.6 x 10 19 m^-T" 1 , respective. The lowest limit of ne achieved is<br />
0.1 x 10 19 m" 3 . On the other h<strong>and</strong>, in NB heated discharges, no particular<br />
efforts are made to raise the upper limits of these parameters. In this sense, the<br />
respective limits of n,, <strong>and</strong> the Murakami parameter, of 8 X 10 l9 m" 3 <strong>and</strong><br />
5.2 x 10~ 19 m" 2 -T"', should not be regarded as unsurpassable limits. The lower<br />
end of fie is limited by the shinethrough power allowed by the armour plates of the<br />
vacuum vessel.<br />
Figure 3(c) is a plot of NB heated discharges in the diagram of ne versus<br />
p abs = p jouie + Pinj - Pshinethrough for both divertor (D) <strong>and</strong> limiter (L) discharges. It<br />
shows that the experiments have covered rather evenly the operational regime shown<br />
in this diagram.<br />
3.3. Global effects of the divertor<br />
A comparison of radiation losses from the main plasma as shown in Fig. 4<br />
demonstrates the dramatic effect of the divertor in reducing the radiation loss in the<br />
NB heated <strong>and</strong> the Joule heated plasmas. The radiation loss is typically 5-10% of<br />
Pabs in divertor discharges <strong>and</strong> 30-90% in limiter discharges. It shows that the<br />
divertor is particularly effective in reducing the radiation loss of the NB heated<br />
plasmas <strong>and</strong> keeps Prad/Pabs below the Joule heating value.<br />
Figure 2 shows a pronounced increase, during NB heating, of hydrogen radiation<br />
from the divertor chamber <strong>and</strong> a small change in the radiation in the main<br />
vacuum vessel. This observation indicates that the particle loss in the plasma is<br />
enhanced during NB heating <strong>and</strong> also that the lost particles are efficiently transported<br />
to the divertor chamber through the divertor throat similar to the observation made
18<br />
-<br />
-<br />
1<br />
i i<br />
1-<br />
mmRHHOOT<br />
BEZXZ S<br />
I<br />
Z<br />
I<br />
BOY CHOKE)<br />
H<br />
- -<br />
^** » - -<br />
JT-60 TEAM<br />
I<br />
""X<br />
<br />
o<br />
ne (10 l9 m- 3 )<br />
JOULE-HEATED<br />
i i i 1<br />
I<br />
I<br />
I<br />
I<br />
J<br />
I<br />
I<br />
I<br />
I<br />
9.0<br />
i i 1 1 1 1<br />
2.0 4.0 6-0 8.0<br />
i<br />
I<br />
I<br />
'*"' ^JOULE-HEATED<br />
M = ncRp/Bt(1O l9 m- 2 -T- 1 )<br />
•<br />
(a)<br />
i<br />
1 1<br />
(b)<br />
i<br />
i<br />
xx=l-0MR<br />
--<br />
OL HE<br />
i i i i i i i<br />
=<br />
-<br />
12.0<br />
-<br />
-<br />
10.0<br />
OL H<br />
OY=2-0MR<br />
i K = l .SMfl<br />
. *=l .8Mfl<br />
. «=l .SMfl<br />
,0 = 1 .OMA<br />
i =OIHER<br />
DL HE<br />
04
20<br />
(MJ)<br />
(S)<br />
2.5r<br />
2.0-<br />
1.5-<br />
1.0<br />
0.5<br />
0.4<br />
0.3<br />
0.2<br />
O.I<br />
Kinetic Stored Energy<br />
2MA<br />
I.5MA<br />
1MA<br />
Joule<br />
\joule<br />
H<br />
0<br />
D<br />
A<br />
He<br />
•<br />
•<br />
A<br />
JT-60 TEAM<br />
Energy Confinement Time<br />
r<br />
_ We +W|<br />
(He, Llmiter, t5MA) A<br />
Pabs<br />
10<br />
(MW)<br />
2MA<br />
I.5MA<br />
IMA<br />
2 MA<br />
(a)<br />
15 20<br />
H<br />
0<br />
•<br />
A<br />
(b)<br />
He<br />
•<br />
•<br />
A<br />
15 20
(S)<br />
0.2<br />
O.I<br />
1 1 r<br />
Energy Conflnemenl Time<br />
<strong>IAEA</strong>-CN-47/A.-I-l 21<br />
H<br />
O<br />
H D<br />
ne (IO l9 rrf 3 )<br />
He<br />
•<br />
He<br />
•<br />
IP<br />
2 MA<br />
I.5MA<br />
Pabs<br />
I4H7MW<br />
9-IIMW<br />
FIG. 5. Confinement in Joule heated <strong>and</strong> NB heated plasmas:<br />
(a) P^ versus W";<br />
(b) Pabs versus TE;<br />
(c) nt versus TE.<br />
in Joule heated plasmas [1, 2, 4]. With respect to heat transport through the throat<br />
to the divertor chamber, the temperature rise AT of the divertor plates is measured<br />
during NB heating by a set of thermocouples embedded in the plates. The half-width<br />
of the AT distribution across the separatrix is less than 2 cm, which corresponds to<br />
a half-width of less than about 1 cm at the divertor throat, small enough to assure<br />
unobstructed transport of heat to the divertor plates.<br />
4. ENERGY CONFINEMENT AND TRANSPORT<br />
Figure 5(a) shows the total kinetic stored energy W = We + W; + Wbeam<br />
versus Pabs in the NB heated divertor <strong>and</strong> limiter discharges, as the density is varied.<br />
It shows that the stored energy increases as an offset, linear function of Pabs up to<br />
a maximum of 2 MJ <strong>and</strong> that the energy confinement time is reduced by NB heating.<br />
This L-mode-like behaviour can also be seen in Figs 5(b) <strong>and</strong> (c), where the<br />
dependence of the energy confinement time rE on other parameters is shown. rE<br />
decreases from Joule heating values of 0.3-0.5 s, depending on the density [4], to<br />
0.1-0.12 s with NB heating <strong>and</strong> approaches an asymptotic value. It increases with<br />
fie <strong>and</strong> Ip, although the dependence is rather weak. No clear dependence on the ion<br />
mass number was observed within the experimental ambiguity, which can be understood<br />
in view of the substantial hydrogen content in the helium discharges (see<br />
Subsection 3.1). The degradation in the energy confinement in the core region is<br />
interpreted as due to the enhancement in the electron conduction since none of the
22<br />
o<br />
o ro<br />
o o<br />
N CM<br />
1.0<br />
(b) i<br />
1<br />
1 [<br />
i ®<br />
, |-10MW<br />
-<br />
1®<br />
— n V<br />
© J v<br />
,<br />
(a)<br />
JT-60 TEAM<br />
—]<br />
• i<br />
Missing<br />
P 7/C<br />
'rod<br />
fie (xl0 l9 m 3 )<br />
OA® k ) d<br />
A<br />
~ 1 • K<br />
^ ®op" ^<br />
A<br />
• er<br />
1<br />
—J j<br />
1<br />
1<br />
1<br />
1<br />
1<br />
1<br />
4- H<br />
1<br />
1<br />
1<br />
i<br />
1<br />
.<br />
i<br />
1<br />
1<br />
0.0 1.0 2.0 3.0<br />
<strong>IAEA</strong>-CN-47/A-M 23<br />
reasonably enhanced neoclassical ion, convection, <strong>and</strong> radiation losses is large<br />
enough to account for the experimentally observed values. More detailed discussions<br />
on this subject are given in a companion paper [6].<br />
A typical set of plasma parameters obtained in the NB heated plasmas is Ti(O)<br />
6 keV, Te(0) 4 keV, n, 3 x 10 19 m" 3 at Pabs 14 MW. In an attempt to improve the<br />
confinement, a limited number of discharges with H-mode characteristics are<br />
obtained. They are, however, not reproducible <strong>and</strong> need further study.<br />
In Fig. 6(a) the power losses observed in the main vacuum vessel <strong>and</strong> in the<br />
divertor chamber are compared with Pat,s. There is a good accountability between<br />
them in the NB heated plasmas as was observed earlier in the Joule heated<br />
discharges [1].<br />
5. IMPURITIES<br />
Major species of impurities that are observed spectroscopically in hydrogen<br />
divertor discharges are oxygen, carbon, titanium (from TiC coating) with <strong>and</strong> without<br />
NB heating. In some of the NB heated plasmas a molybdenum burst is observed<br />
during the NB heating, which can, in most cases, be eliminated by sweeping the<br />
separatrix magnetic surface over the divertor plates (see Subsection 3.1). The<br />
titanium ion content near the axis, estimated from the dominant Ti XXI intensity<br />
observed along the viewline through the vessel axis, decreases roughly in inverse<br />
proportion to the plasma density although the shot to shot fluctuation is fairly large.<br />
The titanium content is about 1 x 10 ~ 5 in Joule heated hydrogen divertor plasmas<br />
at iie 2 x 10 19 m" 3 <strong>and</strong> Ip 2 MA <strong>and</strong> increases to about 2 X 10 ~ 5 in NB heated<br />
plasmas with Pabs > 10 MW. These values are too small to contribute to Zeff <strong>and</strong><br />
Prad. In Joule heated hydrogen limiter plasmas, on the other h<strong>and</strong>, the titanium<br />
content is much larger, 3 X 10 ~ 4 , which is still too small to affect Zeff <strong>and</strong> may<br />
have a small contribution to Prad.<br />
The oxygen <strong>and</strong> carbon contents are not quantified by spectroscopic measurements.<br />
However, their combined effects are estimated from the energy distribution<br />
of helium scattered near the axis from the helium active beam. The amount thus<br />
estimated is equivalent to 1.2% in oxygen or, alternatively, to 2.4% in carbon in<br />
Joule heated hydrogen divertor plasmas at n,. 3.4 X 10 19 m~ 3 . With NB heating, it<br />
increases up to 1.8% <strong>and</strong> 3.6%, respectively. These values are naturally consistent<br />
with Zeff(0) as measured by the helium scattering method to be described below. No<br />
direct information is as yet available on the spatial distributions of the impurities.<br />
Zeff(0) is estimated by three methods: visible bremsstrahlung, helium active<br />
beam scattering, <strong>and</strong> resistivity analyses (assuming Spitzer resistivity; the<br />
neoclassical resistivity yields Zeff(0) below unity in hydrogen discharges).<br />
Figure 6(b) shows Zeff(0) in various kinds of discharges with <strong>and</strong> without NB<br />
heating. These methods consistently give Zeff(0) 1.5-2 for h^ > 3 X 10 19 m~ 3<br />
hydrogen divertor discharges with <strong>and</strong> without NB heating.
24<br />
2.5<br />
2.0<br />
1.5<br />
1.0<br />
0.5<br />
JT-60 TEAM<br />
•g Joule plasma<br />
1<br />
0<br />
5 10<br />
Pobs<br />
Gas puff<br />
Main 1 Div.<br />
0<br />
(2-4)x1<br />
Hydrogen<br />
Divertor<br />
1 •<br />
i *<br />
0<br />
15 20<br />
FIG. 7. Effective particle confinement time r * versus<br />
10<br />
9<br />
8<br />
7<br />
_ 6<br />
a a. 5<br />
o<br />
or<br />
4<br />
3<br />
2<br />
Vacuum- 1<br />
(a)<br />
o<br />
•<br />
A<br />
30 35 40 45<br />
d (mm)<br />
0.1- -0 85 MW<br />
A<br />
(0<br />
(7T<br />
(0<br />
,0)<br />
,0)<br />
,*)<br />
(TT ,*)<br />
50
Q9<br />
0.8<br />
Q7<br />
f 4<br />
E<br />
2 2« 3<br />
<strong>IAEA</strong>-CN-47/A-M 25<br />
Hydrogen<br />
Divertor<br />
ICRF I.1MW 0.75 MW<br />
F/G. & /CKF heating experiment:<br />
(a) Antenna loading;<br />
(b) Plasma behaviour.<br />
6. PARTICLE CONFINEMENT AND TRANSPORT<br />
Particle confinement in the NB heated hydrogen divertor plasmas is evaluated<br />
from the density profile <strong>and</strong> influx of fast (NBI) <strong>and</strong> slow hydrogen atoms. The<br />
diffusion coefficient D in the plasma core is about 0.5 m 2 -s"' at<br />
fie = (4.5-5) X 10 19 m" 3 <strong>and</strong> Ip = 2 MA for Pabs = 20 MW <strong>and</strong> increases in<br />
proportion to Pabs, when a shaping parameter of Cv = 0 is assumed. In contrast, the<br />
diffusion coefficient is, at least, an order of magnitude smaller in Joule heated<br />
plasmas. The diffusion coefficient of titanium impurity in Joule heated plasmas is<br />
evaluated from the temporal evolution of titanium lines following an accidental<br />
penetration of a minute titanium piece into the plasma <strong>and</strong> is about 1 m 2 -s"' with<br />
Cv~0.<br />
Recycling behaviour in Joule heated hydrogen plasmas has been reported for<br />
both divertor <strong>and</strong> limiter plasmas [1, 3]. The effective particle confinement time,
26<br />
2.0<br />
JT-60 TEAM<br />
3.0 4.0 5.0<br />
1.0 -<br />
• 0H + LHCD<br />
o NBI HHCD<br />
(b)<br />
/<br />
o /<br />
/ ° / V<br />
Time (s)<br />
n CD = 3<br />
/<br />
/ n<br />
/<br />
/<br />
6.0<br />
.0 /<br />
• >/<br />
1<br />
0 1 2 3 4<br />
PLn(MW)/ne(x!0 19 m" 3 )<br />
FIG. 9. LHRF current drive experiment:<br />
(a) Plasma behaviour with <strong>and</strong> without LH power shown by full <strong>and</strong> broken tine, respectively;<br />
(b) Efficiency.
<strong>IAEA</strong>-CN-47/A-I-1 27<br />
T* = TP/(1-R), is about 2 s <strong>and</strong> 5.5 s, respectively, at a density of 3 X 10 19 m~ 3<br />
<strong>and</strong> is proportional to the plasma density, T* in NB heated hydrogen divertor<br />
plasmas is plotted in Fig. 7, as a function of PNB = Pinj - Pshinethrough for a density<br />
range of (2-4) X 10 19 m~ 3 . It shows that T*V decreases with PNB <strong>and</strong> is independent<br />
of the plasma density. The hydrogen pressure, Pdiv, in the divertor chamber<br />
increases in proportion to fie in the NB heated plasmas as in the Joule heated<br />
plasmas [2, 3], indicating compression of the hydrogen gas in the divertor chamber.<br />
The inverse normalized pressure in the divertor chamber, njr/P, decreases with PNB<br />
<strong>and</strong> then tends to an asymptotic value. This observation <strong>and</strong> the aforementioned<br />
increase of D with Pabs consistently indicate the enhancement of recycling during<br />
NB heating, due to degradation of particle confinement.<br />
7. ICRF HEATING<br />
The ICRF heating experiment with a 2coci resonance on the axis is conducted<br />
with an injected power of PIC< 1.4 MW, injected from a 2 x 2 loop antenna array.<br />
Figure 8(a) shows the antenna loading resistance R^, as a function of the Faraday<br />
shield-to-separatrix distance d for various choices of the phase difference (Ap, Ad)<br />
of the loops. The plasma is a hydrogen divertor plasma with r^ = 3 X 10 19 m" 3<br />
<strong>and</strong> Ip = 1.5 MA at 4 T. R,.p as high as 10 Q is obtained with (0, 0) phase<br />
difference. This value of R^ is larger than the values evaluated from a simplified<br />
theoretical model [8].<br />
The increase in the kinetic stored energy AW at PIC = 1.2 MW is 0.20 MJ,<br />
corresponding to AW/PIC of 0.17 J- W" 1 . Figure 8(b) shows the plasma behaviour<br />
with <strong>and</strong> without ICRF heating, in particular, an increase in stored energy <strong>and</strong> a<br />
reduction of the hydrogen radiation from the main <strong>and</strong> divertor plasmas.<br />
8. LHRF CURRENT DRIVE<br />
The current drive experiment is performed by using a 4 x 8 waveguide<br />
launcher fed by one of the LHRF power units [9]. Experiments are performed at an<br />
injected power PLH of up to 1.2 MW at Ip = 0.5-1.5 MA into a hydrogen divertor<br />
plasma of H,. = (0.1-2) X 10 19 m~ 3 . With a phase difference A
28 JT-60 TEAM<br />
9. CONCLUSIONS<br />
JT-60, as well as its heating <strong>and</strong> diagnostics systems, has been operated at near<br />
maximum capabilities. The main results obtained in recent experiments are:<br />
(1) The experiments are carried out over a wide operational regime:<br />
0.1 x 10 19 m~ 3 < n < 9.7 x 10 19 m" 3 , qeff > 2.2, <strong>and</strong> Pabs < 20 MW.<br />
A W tot of up to 2.0 MJ is obtained.<br />
(2) The energy confinement time is up to 0.5 s in Joule heated plasmas, depending<br />
on the plasma density. With NB heating, it is reduced to 0.12 s at high heating<br />
power; it is weakly dependent on density <strong>and</strong> plasma current. This behaviour<br />
is accompanied by a reduction of the particle confinement time.<br />
(3) The divertor is effective in reducing impurities with Prad/Pabs ^5% <strong>and</strong><br />
Zeff > 1.5 in the NB heated plasmas. This indicates that a first wall material<br />
with medium Z can be used at reactor grade plasma parameters. Compression<br />
of hydrogen gas in the divertor chamber is observed.<br />
(4) In the LH current drive experiment a current equivalent to 1.5 MA is driven.<br />
The current drive efficiency riCD is as high as (1-1.7) X 10 19 A-m~ 2 W-'. The<br />
efficiency is further increased to (2-2.8) x 10 19 A-m~ 2 W~' by NB heating,<br />
which is accompanied by the enhancement of the NB heating efficiency by the<br />
LH current drive. In the ICRF heating experiment an effective heating of<br />
AW*/P]C = 0.17 J-W" 1 is observed <strong>and</strong> is accompanied by the reduction of<br />
hydrogen recycling.<br />
(5) Attempts to improve confinement are being made.<br />
ACKNOWLEDGEMENTS<br />
The authors wish to thank the members of JAERI who have contributed<br />
to the JT-60 project throughout its progress. They also wish to express gratitude<br />
to Drs S. Mori, Y. Iso, <strong>and</strong> K. Tomabechi for continuous encouragement <strong>and</strong><br />
support.<br />
REFERENCES<br />
[1] JT-60 TEAM (presented by M. Yoshikawa), Plasma Phys. Controll. Fusion 28 (1986) 165.<br />
[2] JT-60 TEAM (presented by S. Tsuji), in Controlled Fusion <strong>and</strong> Plasma Physics (Proc. 12th<br />
Europ. Conf. Budapest, 1985), Part I, European Physical Society (1985) 375.<br />
[3] JT-60 TEAM (presented by S. Tamura), Plasma Phys. Controll. Fusion 28 (1986) 1377.<br />
[4] JT-60 TEAM (presented by H. Kishimoto), in Plasma-Surface Interactions in Controlled Fusion<br />
Devices (Proc. 7th Int. Conf. Princeton, NJ, 1986).<br />
[5] Nucl. Eng. Des./Fusion (Special Issue), to be published.
<strong>IAEA</strong>-CN-47/A-I-1 29<br />
[6] JT-60 TEAM (presented by M. Nagami), Paper <strong>IAEA</strong>-CN-47/A-II-2, these Proceedings, Vol. 1.<br />
[7] JT-60 TEAM (presented by H. Takeuchi), Paper <strong>IAEA</strong>-CN-47/A-IV-3, these Proceedings,<br />
Vol. 1.<br />
[8] KIMURA, H., et al., in Heating in Toroidal Plasmas (Proc. 4th Int. Symp. Rome, 1984), Vol. 2,<br />
ENEA, Frascati (1984) 1128.<br />
[9] JT-60 TEAM (presented by T. Imai), Paper <strong>IAEA</strong>-CN-47/F-II-7, these Proceedings, Vol. 1.<br />
DISCUSSION<br />
R.J. GOLDSTON: I am interested in your measurements of Ha emisssion in<br />
the main chamber. You showed that it rose very little during neutral injection into<br />
divertor discharges. Whereabouts in the main chamber do you measure the Ha<br />
emission <strong>and</strong> how does the emission near the divertor throat behave?<br />
M. YOSHIKAWA: We have an array of Ha detectors to measure the Ha<br />
intensity. The signal from the detector in the direction of the throat is much larger<br />
than the other signals.<br />
M. KEILHACKER: Since H-mode discharges have been achieved recently in<br />
both JET <strong>and</strong> DIII-D, could you comment on the progress made in H-mode research<br />
on JT-60?<br />
M. YOSHIKAWA: We have spent a considerable amount of experimental time<br />
investigating the H-mode. Although a small number of shots exhibit characteristics<br />
of the H-mode type, we are not convinced that H-mode operation is achieved, since<br />
these shots are not reproducible <strong>and</strong> limited in number.<br />
J.G. CORDEY: Do you have a physical explanation for the improvement in the<br />
efficiency of the lower hybrid current drive with the addition of neutral beam<br />
injection?<br />
M. YOSHIKAWA: No, we are not yet able to interpret the improvement<br />
clearly. One possible explanation is that the electron energy distribution is broadened<br />
at the upper end by neutral beam heating <strong>and</strong> improves the efficiency of the lower<br />
hybrid current drive, whereas the ion energy distribution is not disturbed <strong>and</strong> does<br />
not affect the wave power.<br />
B. COPPI: What type of density profile did you observe with Ohmic discharges<br />
<strong>and</strong> auxiliary heated discharges?<br />
M. YOSHIKAWA: The density profile in JT-60 is generally wide. One<br />
interesting observation in association with recent TFTR experiments is that the<br />
density profile broadens when the confinement of the neutral beam heated plasma is<br />
improved by lower hybrid current drive.
JET LATEST RESULTS<br />
AND FUTURE PROSPECTS<br />
<strong>IAEA</strong>-CN-47/A-I-2<br />
JET TEAM<br />
(Presented by P.H. Rebut)<br />
H. Altmann, R.J. Anderson, J. Arbez, W. Bailey, D.V. Bartlett, B. Beaumont 1 ,<br />
G. Beaumont, K. Behringer, P. Bertoldi, E. Bertolini, C.H. Best, V. Bhatnagar 2 ,<br />
R.J. Bickerton, A. Boileau 3 , F. Bombarda 4 , T. Bonicelli, S. Booth, A. Boschi,<br />
G. Bosia, M. Botman, H. Brelen, H. Brinkschulte, M.L.Browne, M. Brusati,<br />
T. Budd, M. Bures, P. Butcher, H. Buttgereit, D. Cacaut, C. Caldwell-Nichols,<br />
J.D. Callen 5 , D.J. Campbell, J. Carwardine, G. Celentano, CD. Challis,<br />
A. Cheetham, J.P. Christiansen, C. Christodoulopoulos, P. Chuilon, R. Claesen,<br />
J.P. Coad, S.A. Cohen 6 , M. Cooke, J.G. Cordey, W. Core, S. Corti,<br />
A.E. Costley, G.A. Cottrell, M. Cox 7 , C. David, J. Dean, L. de Kock,<br />
E. Deksnis, G.B. Denne, G. Deschamps, K.J. Dietz, J. Dobbing, S.E. Dorling,<br />
D.F. Diichs, G. Duesing, P.A. Duperrex 8 , H. Duquenoy, A.W. Edwards,<br />
J. Ehrenberg 9 , W. Engelhardt, S.K. Erents 7 , F. Erhorn, B.T. Eriksson,<br />
M. Evrard 2 , H. Falter, N. Foden, M.J. Forrest 7 , C. Froger, K. Fullard,<br />
G. Fussmann 9 , M. Gadeberg 10 , A. Galetsas, A. Gallacher, D. Gambier',<br />
R. Giannella", A. Giannelli 4 , A. Gibson, R.D. Gill, A. Goede, A. Gondhalekar,<br />
C. Gordon, C. Gormezano, N.A. Gottardi, C.W. Gowers, R. Granetz, B. Green,<br />
S. Gregoli, F.S. Griph, R. Haange, J.H. HamneV 1 , C.J. Hancock, P.J. Harbour,<br />
N.C. Hawkes 7 , P. Haynes 7 , T. Hellsten, J.L. Hemmerich, R. Hemsworth,<br />
F. Hendriks, R.F. Herzog, L. Horton 12 , J. How, M. Huart, A. Hubbard 13 ,<br />
J. Hugill 7 , M. Hugon, M. Huguet, B. Ingram, H. Jackel 9 , J. Jacquinot,<br />
Z. Jankowicz' 4 , O.N. Jarvis, E.M. Jones, P. Jones, T.T.C. Jones, C. Jup6n 15 ,<br />
E. Kallne, J. Kallne, O. Kaneko 16 , A. Kaye, B.E. Keen, M. Keilhacker,<br />
G. Kinahan, S. Kissel, A. Konstantellos, M. Kovanen 17 , U. Kiiphnapfel 9 ,<br />
P. Kupschus, P. Lallia, J.R. Last, L. Lauro-Taroni, K.D. Lawson 7 , E. Lazzaro,<br />
R.C. Lobel, P.J. Lomas, N. Lopes-Cardozo 18 , M. Lorenz-Gottardi, C. Lowry 13 ,<br />
G. Magyar, D. Maisonnier, M. Malacarne, V. Marchese, P. Massmann,<br />
G.M. McCracken 7 , P. McCullen, M.J. Mead, P. Meriguet, V. Merlo,<br />
V. Mertens 9 , S. Mills, P. Millward, A. Moissonnier, P.L. Mondino, D. Moreau',<br />
P.D. Morgan, E.R. Miiller 9 , D. Murmann 9 , G. Murphy, M.F. Nave,<br />
L. Nickesson, P. Nielsen, P. Noll, S. Nowak, W. Obert, M. Olsson, J. O'Rourke,<br />
M.G. Pacco, J. Paillere, S. Papastergiou, J. Partridge 7 , D. Pasini 12 , N.J. Peacock 7 ,<br />
M. Pescatore, J. Plancoulaine, J.-P. PofK, R. Prentice, T. Raimondi, J. Ramette 1 ,<br />
C. Raymond, P.H. Rebut, J. Removille, W. Riediker, R. Roberts,<br />
D.C. Robinson 7 , A. Rolfe, R.T. Ross, G. Rupprecht 9 , R. Rushton, H.C. Sack,<br />
G. Sadler, J. Saffert, N. Salmon 13 , F. S<strong>and</strong>, A. Santagiustina, R. Saunders,<br />
M. Schmid, F.C. Schuller, K. Selin, R. Shaw, A. Sibley, D. Sigournay,<br />
R. Sillen 18 , F. Simonet 1 , R. Simonini, P. Smeulders, J.A. Snipes 7 , K. Sonnenberg,<br />
L. Sonnerup, ,M.F. Stamp, C.A. Steed, D. Stork, P.E. Stott, T.E. Stringer,<br />
D.R. Summers, H.P. Summers 19 , A.J. Tagle, G. Tallents 20 , A. Tanga, A. Taroni,<br />
A. Terrington, A. Tesini, P.R. Thomas, E. Thompson, K. Thomsen 10 , F. Tibone,<br />
R. Tivey, T.N. Todd 7 , P. Trevalion, M. Tschudin, B.J. Tubbing 18 , P. Twynam,<br />
E. Usselmann, H. Van der Beken, J.E. Van Montfoort, M. von Hellermann,<br />
J. von Seggern 21 , T. Wade, C. Walker, B.A. Wall<strong>and</strong>er, M. Walravens,<br />
31
32 JET TEAM<br />
K. Walter, M.L. Watkins, M. Watson, D. Webberley, A. Weller 9 , J.A. Wesson,<br />
J. Wilks, T. Winkel, C. Woodward, M. Wykes, D. Young, L. Zannelli,<br />
J.W. Zwart<br />
JET Joint Undertaking,<br />
Abingdon, Oxfordshire,<br />
United Kingdom<br />
Abstract<br />
JET LATEST RESULTS AND FUTURE PROSPECTS.<br />
During JET's first three years of operation, experiments have been undertaken with up to<br />
~7 MW of ICRF, ~ 10 MW of neutral beam <strong>and</strong> ~ 18 MW of total input power during combined<br />
operation. The latest JET results show many advances made during this period. In particular, the especially<br />
good confinement (TE up to 0.8 s), high temperatures (Te up to 5 keV) <strong>and</strong> fusion product<br />
({ftiTETj) = 10 20 m" 3 'S-keV) achieved with ohmic heating alone have exceeded expectations. Also,<br />
very efficient ion heating has been observed (Tj > 12.5 ± 1.5 keV) at moderate neutral beam injection<br />
power levels (PNB < 8 MW) <strong>and</strong> at low average densities (flj ~ (1-1.5) x 10 19 m~ 3 ). In addition,<br />
a fusion product of ((hj^tj — 2 x 10 20 m~ 3 -S'keV has been achieved with a separatrix configuration<br />
in JET. However, limitations have been encountered in plasma density <strong>and</strong> electron <strong>and</strong> ion<br />
temperatures because of disruptions <strong>and</strong> sawtooth oscillations. With additional heating, confinement is<br />
degraded, as the electron temperature outside the sawtooth region exhibits only a weak dependence on<br />
the input power per particle. As a consequence, additional heating has little impact on the fusion<br />
product. The consequent developments to provide significant alpha heating in JET are described.<br />
1<br />
CEA, Centre d'etades nuclfiaires de Fontenay-aux-Roses, France.<br />
2<br />
Plasma Physics Laboratory, Association "Euratom-Belgian State" ERM/KMS, Brussels, Belgium.<br />
3<br />
Institut national de la recherche scientifique, Ste-Foy, Quebec, Canada.<br />
4<br />
ENEA, Centro Ricerche Energia, Frascati, Italy.<br />
5<br />
Department of Physics, University of Wisconsin, Madison, WI, USA.<br />
6<br />
Princeton Plasma Physics Laboratory, Princeton University, NJ, USA.<br />
7<br />
UKAEA, Culham Laboratory, Abingdon, Oxfordshire, UK.<br />
8<br />
Centre de recherches en physique des plasmas, Ecole polytechnique fe'de'rale de Lausanne,<br />
Switzerl<strong>and</strong>.<br />
9<br />
Max-Planck-Institut fur Plasmaphysik, Garching, Fed. Rep. Germany.<br />
10<br />
Risa National Laboratory, Roskilde, Denmark.<br />
" Swedish Energy Research Commission, Stockholm, Sweden.<br />
12<br />
Natural <strong>Sciences</strong> <strong>and</strong> Engineering Research Council, Ottawa, Ontario, Canada.<br />
13<br />
Imperial College of Science <strong>and</strong> Technology, University of London, UK.<br />
14<br />
RCC CYFRONET IAE, Otwock-Swierk, Pol<strong>and</strong>.<br />
15<br />
University of Lund, Sweden.<br />
16<br />
Department of Physics, University of Nagoya, Japan.<br />
17<br />
Department of Physics, Lappeenranta University of Technology, Lappeenranta, Finl<strong>and</strong>.<br />
' 8 FOM Instituut voor Plasmafysica, Rijnhuizen, Nieuwegein, Netherl<strong>and</strong>s.<br />
19<br />
University of Strathclyde, Glasgow, UK.<br />
20<br />
Research School of Physical <strong>Sciences</strong>, Australian National University, Canberra, Australia.<br />
21 Kernforschungsanlage Jiilich GmbH, Fed. Rep. Germany.
1. Introduction<br />
<strong>IAEA</strong>-CN-47/A-I-2 33<br />
The Joint European Torus (JET) [ 1,2] is the largest single project of the coordinated fusion<br />
research programme of the European Atomic Energy Community (EURATOM). Its<br />
main objective is to obtain <strong>and</strong> study plasmas in conditions <strong>and</strong> with dimensions approaching<br />
those needed for a fusion reactor (ie n = 2x 10 20 m" 3 ; T> lOkeV, <strong>and</strong> rE= l-2s),<br />
<strong>and</strong> is specifically designed to study D-T reactions in the plasma.<br />
This paper concentrates on experiments <strong>and</strong> advances during the last 2 years (the first<br />
additional heating phase) using ion-cyclotron resonance frequency (1CRF) <strong>and</strong> neutral beam<br />
(NB) heating, both individually <strong>and</strong> in combined situations, <strong>and</strong> indicates particular<br />
developments <strong>and</strong> additions to JET that are planned to improve performance further<br />
towards the reactor regime.<br />
2. Technical Status of the Device<br />
2.1. Machine Conditions<br />
Machine conditions have been progressively improved during the operational phase <strong>and</strong><br />
all machine systems have now met the stringent design specifications. The achieved<br />
parameters are compared with the design values in Table I.<br />
The toroidal magnetic field (B-f) now operates routinely at its maximum design value<br />
of 3.45T. The plasma current (±
34 JET TEAM<br />
TABLE I. PRINCIPAL PARAMETERS OF JET:<br />
DESIGN AND ACHIEVED VALUES<br />
Parameter<br />
Plasma minor radius<br />
(horizontal), a<br />
Plasma minor radius<br />
(vertical), b<br />
Plasma major radius, RB<br />
Plasma elongation ratio,<br />
€=b/a<br />
Flat-top pulse length<br />
Toroidal magnetic field<br />
(plasma centre)<br />
Plasma current:<br />
circular plasma<br />
Elongated plasma<br />
Flux Drive Capability<br />
Additional heating power<br />
(in plasma)<br />
RF Power<br />
Neutral beam power<br />
Design Values<br />
1.25m<br />
2.10m<br />
2.96 m<br />
1.68<br />
Up to 20 s<br />
3.45T<br />
3.2 MA<br />
4.8 MA<br />
34 V-s<br />
1986 Values Full Values<br />
8MW 32MW<br />
(3 antenna) (8 antenna)<br />
10 MW 20 MW<br />
(1 box) (2 boxes)<br />
Achieved Values<br />
0.8—1.2 m<br />
0.8—2.1 m<br />
2.5—3.4m<br />
1.2—1.7<br />
Up to 20s<br />
3.45T<br />
3.0 MA<br />
5.1 MA<br />
28 Vs<br />
<strong>IAEA</strong>-CN-47/A-I-2 35<br />
delivering up to 3MW in matched conditions. The three units have been regularly operated<br />
up to 7.2MW for 2s pulses. Experiments with 8s pulse duration have also been performed<br />
delivering ~ 40MJ to the plasma. Recently, a fourth RF generator has been installed so<br />
that two generators can be coupled to one antenna [4],<br />
When completed, the JET RF system will have eight generator-antenna units initially<br />
delivering 24MW for 20s pulses. Subsequently, each amplifier unit will be upgraded to<br />
4MW, using a more powerful tetrode in the final amplification stage. New water-cooled<br />
antennae have been built <strong>and</strong> tested for insertion inside the toroidal belt limiter.<br />
2.3. Neutral Beam System<br />
A long pulse (~ 10s) neutral beam (NB) injector with eight beam sources <strong>and</strong> one integrated<br />
beam line system has been operated on JET since early 1986. H beams have been injected<br />
into D plasmas with particle energies (in the full energy fraction) of up to 65keV. The neutral<br />
power fractions were 69%, 23% <strong>and</strong> 8% in the full, half <strong>and</strong> one-third energy components,<br />
respectively, giving a total beam power of ~ 5.5MW injected into the torus. D beams have<br />
also been injected into D plasmas, with particle energies up to 75keV (injected power fractions<br />
of 76%, 17% <strong>and</strong> 7%) giving a total power up to 10MW. Up to 40MJ have been<br />
delivered to the plasma during a pulse. The second neutral injection box will be available<br />
for operation on the machine in mid-1987.<br />
2.4. Diagnostics<br />
About 30 different diagnostics have been installed on JET, allowing cross measurements<br />
of the main plasma parameters <strong>and</strong> detailed analysis of some of the plasma features such<br />
as sawteeth oscillations <strong>and</strong> MHD behaviour [5]. The ECE diagnostic is the main instrument<br />
for providing electron temperature profiles <strong>and</strong> infra-red interferometry is the main<br />
technique for density profiles. The ion temperature is measured by three different techniques;<br />
charge-exchange neutrals, Doppler broadening of Ni 26+ <strong>and</strong> of resonant chargeexchange<br />
lines of light impurities. Flux measurements <strong>and</strong> spectrometry of 2.4MeV neutrons<br />
are also used. Zef/is measured by visible bremsstrahlung <strong>and</strong> is in agreement with estimates<br />
from neoclassical resistivity.<br />
3. Experimental Results<br />
3.1. Overall Plasma Parameters<br />
Experiments have been performed in JET in different configurations: limiter discharges<br />
on the inner or outer walls <strong>and</strong> X-Point discharges with single or double null. Various<br />
heating scenarios have been used ranging from ohmic heating alone to combinations of<br />
ohmic, RF <strong>and</strong> NB. The variation of the main JET parameters is presented in Table II.<br />
Several examples of typical pulses under these various conditions are indicated in Fig.l,<br />
which show the density (n), electron temperature (Te) <strong>and</strong> safety factor (q) profiles, with<br />
ion temperature (7)) measurements where available.<br />
Each heating method has its own characteristic power deposition profile. For ICRF,<br />
it is well localised (half width ~30cm),as shown in Ref. [4], <strong>and</strong> can be varied across<br />
the plasma by changing either the toroidal field or the frequency. The NB deposition profiles<br />
are usually less peaked on axis, <strong>and</strong> are quite flat at high densities.
36 JET TEAM<br />
14 -(a)<br />
12 I<br />
10 -<br />
8<br />
6<br />
4<br />
2<br />
0<br />
14<br />
•(b)<br />
12 -<br />
10 -<br />
8<br />
6<br />
4<br />
0 T I<br />
14<br />
"(c)<br />
12<br />
10 -<br />
8 -<br />
_ s 6<br />
4<br />
2<br />
-<br />
-<br />
0<br />
2.8 3.0<br />
i i 1<br />
Pulse No. 10363<br />
IP = 5MA Bj = 3.45T<br />
P, = 4MW TE = 0.70s<br />
n<br />
T. ^<br />
Pulse No. 7772<br />
IP = 3.5MA BT = 1.7T<br />
P, = 3.7MW TE = 0.50 s<br />
n<br />
.<br />
.-: T N<br />
T~ " "<br />
I I 7<br />
Pulse No. 9603<br />
IP = 2MA BT = 2.2T :.<br />
P, = 8.7MW TE = 0.35s /<br />
Te<br />
i i i<br />
3.2 3.4 3.6<br />
Major Radius (m)<br />
^\. n<br />
-<br />
-<br />
/ -<br />
q*/ -<br />
1 1 4<br />
3.8 4.0 4.2<br />
•6<br />
•5<br />
• -4<br />
• -3<br />
••2<br />
•0<br />
•1<br />
5<br />
4<br />
Pulse No. 10363<br />
( d ) IP = 5MA BT = 3.45T<br />
P, = 17.9MWT,<br />
(e)<br />
-+- -+- -+-<br />
Pulse No. 9775<br />
IP = 3MA BT = 3.4T<br />
Pt = 8.7MW TE = 0.32s<br />
Pulse No. 10204 /<br />
IP = 3MA BT = 3.3T(X-point)/<br />
P, = 11MW TE = 0.60s /<br />
Te"-\<br />
2.8 3.0 3.2 3.4 3.6 3.8 4.0<br />
Major Radius (m)<br />
FIG. 1. Density (n), electron temperature (TJ <strong>and</strong> safety factor (q) as a Junction of major radius.<br />
The ion temperature (Tj) is shown where available. These profiles are indicated for the following cases:<br />
(a) 5 MA pulse (No: 10363), ohmic heating only, BT = 3.45 T. (b) Low q pulse (No. 7772), ohmic<br />
heating only, Ip = 3.5 MA, BT - 1.7 T. (c) Monster sawtooth pulse (No. 9603), P^ = 6.1 MW.<br />
(d) 5 MA pulse (No. 10363) with 15.2 MW of RF + NB power, BT = 3.45 T. (e) High 7). pulse<br />
(No. 9775), Paid = 8MW. (f) X-point configuration pulse (No. 10204), Ip = 3 MA, P^ = 8.2 MW.<br />
4.2<br />
0<br />
7<br />
6 r<br />
5 1<br />
3 I
-eit<br />
<strong>IAEA</strong>-CN-47/A-I-2 37<br />
TABLE II. RANGE OF MAIN JET PLASMA PARAMETERS<br />
Parameter<br />
Toroidal field (plasma centre) B,<br />
Plasma current, Ip<br />
Flux safety factor at edge, q+<br />
Volume averaged density, ne<br />
Central electron temperature, te<br />
Central ion temperature, %<br />
Energy confinement time, TE<br />
Otr<br />
2 3<br />
ne (10 19 /m 3 )<br />
Value<br />
1.7-3.4T<br />
1-5 MA<br />
2.2-16<br />
0.5-5x10 l9 m- 3<br />
2-7.5 keV<br />
1.5-12keV<br />
0.2-0.9 s<br />
o NB+RF<br />
a NBco<br />
D NBct<br />
* RF<br />
x OH<br />
p OH with Pellet<br />
FIG. 2. Zeffas a function of average density for various plasma conditions.
38 JET TEAM<br />
0.7<br />
0.6<br />
05<br />
0.4<br />
0.3<br />
0.2<br />
0.1<br />
0<br />
• O.H.<br />
« RF<br />
- x NB<br />
+ NB+RR<br />
o Pellets<br />
» x *<br />
t<br />
• * < *<br />
X<br />
0<br />
v c<br />
o<br />
« , ^ "X X<br />
• •<br />
• •<br />
•<br />
• • * * *<br />
• • • • ,<br />
*• 0 0^. *°<br />
+(£- * "x<br />
i<br />
Ohmic <strong>and</strong> RF Density Limit<br />
(m- 3 ) =1-2xio 20 BT(T)/qR(m)<br />
nc<br />
" ^K. '• \<br />
Vx.xXxx<br />
x^>'x x<br />
V^0« x x ° "xx OOO<br />
O^v^ X>tx ^-—"^<br />
°iss x ++++ + +o+^--r^<br />
x + + * + x " ^ - - - ^ ^<br />
Density Limit<br />
(m- 3 ) =2x10 20 BT(T)/qR(m)<br />
i i i<br />
0 1 2 3 4 5 6<br />
n R/BT (x10' 9 m- a T- 1 )<br />
FIG. 3. Normalized current (= (2irRIp/ABT) = 1/q) versus normalized density (— nR/BT).<br />
The following parameters have been obtained under different conditions:<br />
(a) With ohmic heating, peak ion <strong>and</strong> electron temperatures of 3keV <strong>and</strong> 4keV, respectively,<br />
were achieved with a plasma density ~4.2x 10 19 m~ 3 <strong>and</strong> energy confinement<br />
times exceeding 0.8s;<br />
(b) With RF heating, the peak electron <strong>and</strong> ion temperatures have reached 5.5keV with<br />
peak ion densities of 3.5xl0 l9 m" 3 . However, the confinement time has dropped to<br />
T£ = 0.3s;<br />
(c) Ion temperatures up to 6.5keV at mean densities of 3 x 10 19 m~ 3 have been produced<br />
with neutral beam heating. At lower peak densities (~ 1.5 X 10 19 m" 3 ), ion temperatures<br />
> 12.5keV have been observed (Fig.l(e)). Again, there was a degradation in confinement<br />
time down to 0.3-0.4s. In addition, with — 7MW of neutral beam injection, current<br />
drive of 0.4MA has been observed at a mean density of 2 x 10 l9 m" 3 ;<br />
(d) Combined RF <strong>and</strong> neutral beam heating has coupled power up to I5MW to the plasma<br />
in a 5MA discharge: the plasma energy content was ~6MJ (Fig.l(d)).<br />
The JET impurity behaviour is similar to that observed in other ungettered tokamaks<br />
with graphite limiters [ 3 ]. The main impurities in ohmic <strong>and</strong> neutral beam heated plasmas<br />
are carbon <strong>and</strong> oxygen <strong>and</strong> principally carbon at high electron density, ne. During ICRH,<br />
moderate metal concentrations (0.1% ne) are responsible for ~20% of the total radiation<br />
power losses. These can be prevented temporarily by carbonisation. Radiation power losses<br />
represent 30-60% of the total heating power, Plot, during NBH <strong>and</strong> 40-70% of P,o, for<br />
ICRH. Most of the radiated power is emitted from the edge plasma. ZeJy varies from 3.5<br />
at low ne to 2.5 at high ne. With NB injection, Ze/f falls to values of 2-3 <strong>and</strong> with pellet<br />
injection, it can fall to values close to 1 (see Fig.2).
T.(0) (keV)<br />
i i<br />
Pulse No: 9603<br />
<strong>IAEA</strong>-CN-47/A-I-2 39<br />
1.05 s<br />
6 7 8 9 10 11 12 13<br />
Time (s)<br />
Power (MW)<br />
FIG. 4. Sawtooth oscillations of the central electron temperature, showing the effects ofNB <strong>and</strong> RF<br />
additional heating.<br />
3.2. Density Limits<br />
The Hugill diagram for JET is shown in Fig.3, where the operating domain is limited by<br />
disruptive instabilities. In ohmic plasmas, the density limit is nc (OH)(m~ 3 )= 1.2 x 10 20 Br<br />
(T)/qR(m). This limit depends on plasma purity. In RF heated discharges, it is only slightly<br />
increased, possibly because the effect of the extra power is cancelled by an increase in<br />
impurities. In neutral beam heated plasmas, the limit is substantially increased, as shown<br />
in Fig.3, to nf(NB)(m" 3 ) = 2.0 x 10 20 B7
40 JET TEAM<br />
I<br />
8- A<br />
4<br />
6 -<br />
2 -•<br />
0<br />
6<br />
4 -<br />
2 -<br />
0<br />
1.2<br />
0.8 -<br />
1 1<br />
_<br />
- • • ' • • •<br />
(a)<br />
- (b)<br />
-<br />
2<br />
> 0.4 h-<br />
" (c)<br />
...•••' + .<br />
•' + j<br />
i<br />
.o%^<br />
SP+&J<br />
i<br />
B<br />
++i ntS-€l Ctf<br />
«> ++I<br />
1<br />
• • • • •<br />
§& m a.<br />
i<br />
+<br />
o<br />
1<br />
i<br />
" D<br />
3<br />
1<br />
D+<br />
•-•"•<br />
r i<br />
1<br />
i<br />
I<br />
1<br />
1<br />
0 1 2 3 4 5 6 7 8<br />
Total Power/Average Density (x10- 19 MW-m- 3 )<br />
1<br />
=*+fD<br />
, D -<br />
I<br />
LfTTTi • • •<br />
1<br />
D ^ +<br />
a<br />
iB<br />
o<br />
+<br />
Ip =3MA<br />
o OH<br />
+ NB<br />
a<br />
1<br />
=3MA<br />
OH<br />
NB<br />
1<br />
1<br />
Ip =3MA<br />
o OH<br />
+ NB<br />
a<br />
D<br />
BT<br />
a RF+NB<br />
1<br />
BT<br />
D<br />
BT<br />
D<br />
a<br />
=2.2T<br />
-D °<br />
=2.2T<br />
RF+NB<br />
D C<br />
=2.2T<br />
RF+NB<br />
FIG. 5. (a) Electron temperature at the centre, (b) electron temperatures at the inversion radius<br />
(q => 1), <strong>and</strong> (c) inversion radius as a Junction of power input per particle, for ohmic, RF, NB <strong>and</strong> combined<br />
heating cases (Ip = 3 MA; BT = 2.2 T).<br />
may be involved [8]. Both models result in the growth of an m = 2, n= 1 isl<strong>and</strong> before<br />
the disruption. Observations <strong>and</strong> theoretical considerations both show that the central<br />
plasma density can be increased by deep fuelling.<br />
3.3. Temperature Effects<br />
Sawtooth oscillations occur in almost all JET discharges. As these instabilities, in general,<br />
limit the peak ion <strong>and</strong> electron temperatures, <strong>and</strong> may affect, in certain cases, the global
14<br />
12<br />
. (a)<br />
10<br />
f 8<br />
0<br />
6<br />
h- 01 4<br />
2<br />
0<br />
12<br />
10<br />
1 8<br />
o<br />
6<br />
^ 4<br />
2<br />
0<br />
(b)<br />
O -H- 1<br />
<strong>IAEA</strong>-CN-47/A-I-2 41<br />
• a<br />
O OH<br />
+• NB<br />
BT = 3.4T<br />
A RF<br />
Q RF+NB<br />
+<br />
0 1 2 3 4 5 6 7<br />
Total Power/Average Density (x10~ 19 MW-nv 3 )<br />
FIG. 6. (a) Electron temperature (Te) at the centre, <strong>and</strong> (b) ion temperature (J) at the centre, as a<br />
function of power input per particle for various heating scenarios.<br />
energy confinement times, they justify a careful analysis. With central deposition of additional<br />
power, sawteeth may develop large amplitudes (up to doubling the central electron<br />
temperature) <strong>and</strong> long periods (up to 0.6s) [6]. In some circumstances,with combined NB<br />
<strong>and</strong> RF, 'monster' sawteeth have been observed (see Fig.4). They are characterised by long<br />
durations of 0.8 -1.2s <strong>and</strong> strong reduction of the low m, n numbers MHD activity. The<br />
instability mechanism of the sawteeth is described by a model involving ideal MHD [8].<br />
The peak electron temperature 7^(0) can be raised significantly above the value reached<br />
in the ohmic phase as shown in Fig.5(a). The dispersion seen in 7^(0) is due to sawteething<br />
<strong>and</strong> to variations in profile deposition of the additional power. By contrast, the electron<br />
temperature at the inversion radius (q~ 1 surface) shows only a weak dependence with<br />
the power input per particle (/#/) for a given plasma current <strong>and</strong> toroidal field (Fig.5(b),<br />
<strong>and</strong> no explicit density dependence. The radius of inversion is independent of P/n in the<br />
range shown (Fig. 5(c)).<br />
The ion temperature behaviour appears quite different; the peak ion temperature 7/(0)<br />
(deduced from the X-ray crystal spectrometer) is plotted versus Pfn in Fig.6(b). Above<br />
4 x 10 19 MW. m~ 3 , the ion temperature can greatly exceed the electron temperature <strong>and</strong> can<br />
reach 12.5 keV in JET. A broadening of the ion temperature profile is also observed in<br />
cases of off-axis ICRF heating [4].
42 JET TEAM<br />
l.U<br />
0.8<br />
0.6<br />
e (S)<br />
pi<br />
tne<br />
0.4<br />
0.2<br />
iOT 2<br />
Q.<br />
0<br />
1<br />
(b)<br />
6 -<br />
0<br />
-<br />
-<br />
-<br />
-<br />
_<br />
(a)<br />
-.<br />
A<br />
I*"<br />
•<br />
• .<br />
X<br />
••#»""<br />
• * #<br />
n<br />
''•<br />
. "'4<br />
• - % - •<br />
" a '"s<br />
•m -•<br />
1<br />
\<br />
S\<br />
N<br />
s s<br />
a<br />
' . D<br />
••••CP<br />
D<br />
'•••••. Bfeb<br />
it'' 1<br />
*»'<br />
D<br />
' -£k<br />
x x<br />
x x<br />
\<br />
1 1<br />
: • '<br />
"' \ *<br />
..»•*•»-'"' "<br />
' ^ ^<br />
i<br />
lp=3MA<br />
. X-Point<br />
D.flp<br />
" S "9<br />
2 ° ii '---....<br />
=2 MA<br />
a<br />
MA<br />
. . * - • • - • • '<br />
Op. • •<br />
;<br />
. . . . . . • • • • ' - -<br />
1<br />
1<br />
6 8 10<br />
Total Power P, (MW)<br />
r ..<br />
1 • • H>.<br />
Q DO<br />
a<br />
•a..<br />
s ••-•'•••••<br />
• *<br />
• o 1 "<br />
3<br />
I<br />
3.4T> BT>3T<br />
lp=5MA<br />
-rr-lp=4MA<br />
•aa a<br />
lp=3MA<br />
...-• -"i<br />
* lp=5MA<br />
a lp=4MA<br />
(X-Point<br />
» lp=2MA<br />
x L=1MA<br />
12 14 16<br />
FIG. 7. (a) Energy confinement time TE as a Junction of additional heating power (at Ip = 1, 2, 3, 4<br />
<strong>and</strong> 5 MA; 3.4 T & BT a 3.0 T. (b) Plasma energy content Wk versus total input power P, with NBI<br />
<strong>and</strong> ICRF heating (Ip = 1, 2, 4 <strong>and</strong> 5 MA; 3.4 T > BT 2: 3.0 T). X-point values at lp = 3 MA are<br />
shown for comparison.<br />
t
3.4. Confinement Degradation<br />
<strong>IAEA</strong>-CN-47/A-I-2 43<br />
0 1 2 3 4<br />
Major Radius (m)<br />
FIG. 8. Single-null X-point configuration at I. = 2.0 MA.<br />
The definition of the total energy confinement time used at JET is T£=W*/[P/ - dW
44 JET TEAM<br />
TABLE III. MAXIMUM VALUES OF (ni(0)TETi(0))<br />
Experimental<br />
programme<br />
Ohmic<br />
(4.6 MW)<br />
ICRF (7 MW)<br />
NBI (6 MW)<br />
High n.<br />
Low n;<br />
Combined<br />
NBI + RF<br />
(14 MW)<br />
X-point<br />
(NB 10 MW)<br />
Peak<br />
density<br />
nKO)<br />
(10 19 m" 3 )<br />
4.2<br />
3.7<br />
4.4<br />
1.5<br />
5.0<br />
5<br />
Energy<br />
confinement<br />
time<br />
(s)<br />
0.8<br />
0.3<br />
0.4<br />
0.4<br />
0.4<br />
0.65<br />
a Beam-plasma reactions are dominant.<br />
Ion<br />
temperature<br />
Ti(0)<br />
(keV)<br />
3.0<br />
5.4<br />
4.0<br />
10<br />
3.5<br />
6<br />
Fusion<br />
parameter<br />
(10"nT 3 -s-keV)<br />
10<br />
6<br />
7<br />
6<br />
7<br />
20<br />
QDT<br />
equivalent<br />
QDT<br />
0.010<br />
0.012<br />
0.10 a<br />
0.20 a<br />
0.10 a<br />
0.15 a<br />
Plasma<br />
current<br />
(MA)<br />
at plasma currents up to 3.0MA with a single null (Fig.8) <strong>and</strong> up to 2.5MA with a double<br />
null [9]. While interaction of the discharges with the limiters was curtailed, localised power<br />
deposition on the top <strong>and</strong> bottom target plates has limited the total input power to 10MW.<br />
The main objectives of these experiments are (i) to study the conditions of creation of a<br />
high density highly radiative region at the X-point capable of screening <strong>and</strong> isolating the<br />
main bulk plasma <strong>and</strong> (ii) to study the global confinement characteristics in comparison<br />
with limiter discharges. Evidence exists of the formation of a dense plasma near the X-<br />
Point, with average density 1 - 2 X 10 20 m " 3 , corresponding to an order of magnitude higher<br />
than the average value of the main plasma density. There is also evidence that up to 40%<br />
of the total input power could be radiated by a ~ 20cm x 20cm toroidal annulus around<br />
the X-Point in the high density discharges with additional power.<br />
As shown in Fig.7, the increase in total energy content (<strong>and</strong> hence global confinement<br />
time) in single-null configurations is observed to be about twice that observed with limiters.<br />
In these conditions, both average electron <strong>and</strong> ion temperatures appear to be higher, <strong>and</strong><br />
there are indications of changes in edge plasma suggesting an H-mode.<br />
5<br />
3<br />
3<br />
3<br />
3<br />
3
3.6. Slide-away Discharges<br />
<strong>IAEA</strong>-CN-47/A-I-2 45<br />
A preliminary study of slide-away discharges has also started with a view to decoupling<br />
currents <strong>and</strong> electron temperature. In these conditions, a plasma with 3MA <strong>and</strong> a mean<br />
density just below 10 19 m~ 3 has been obtained with a good confinement time for these<br />
conditions (~ 0.6-0.7s). The voltage per turn was 0.2V. When trying to increase the density<br />
by gas puffing, the discharge reverted to normal conditions.<br />
3.7. Progress Towards Breakeven<br />
Neutron yields >2.8xl0 l5 s~' have been obtained with D injection, mainly from beamplasma<br />
D-D reactions. The best ratio of fusion power to input power obtained was<br />
QDD=4xl0~ 4 , which is equivalent to Qor~0.2 <strong>and</strong> would have corresponded to a fusion<br />
power production of -2MW (see Table II).<br />
Fusion products = 10 2O m" 3 -s-keV have been achieved in JET (compared with<br />
the value 5 x 10 21 m~ 3 s-keV required in a reactor) in an ohmic discharge at 5MA <strong>and</strong> a value<br />
of 2xl0 2O m"-s-keV has been obtained in an X-Point discharge at 3MA current. However,<br />
additional heating has not yet been optimized into 5MA discharges. Under optimum<br />
conditions at lower currents, the values are similar for ohmic heating only, RF, NB, <strong>and</strong><br />
combined heating cases, the degradation in rE with additional heating offsetting gains in<br />
other parameters (see Table III).<br />
4. Progress in Underst<strong>and</strong>ing Heat Transport<br />
JET data have been used to assess the status of theoretical underst<strong>and</strong>ing of heat transport<br />
[10]. Local fluxes have been derived from measurements <strong>and</strong> compared with presently<br />
available theoretical values. No acceptable agreement has been found. However, the scaling<br />
of global energy confinement time with the dimensionless plasma physics parameters suggests<br />
that the underlying heat transport is a consequence of resistive MHD instabilities [11].<br />
The topology of the magnetic field including chaotic regions <strong>and</strong> small isl<strong>and</strong>s could account<br />
for the heat fluxes observed in JET [12]. Such a model is also consistent with the existence<br />
of an H-mode.<br />
As a-particles mostly heat the electrons, it is imperative to obtain better control of their<br />
temperature, especially inside the q = l surface (ie sawteeth). A possible approach to increase<br />
Te(0) is to control the profile of current <strong>and</strong> achieve a flat current distribution (qs 1, q' =0)<br />
in the central region, in order to stabilize or at least delay the sawtooth crash significantly.<br />
5. The JET Strategy <strong>and</strong> Future Programme<br />
The JET strategy is to optimize the fusion product . Attempts will be made to<br />
maintain T£ with additional heating near to present values, <strong>and</strong> to increase the central density<br />
<strong>and</strong> temperature.<br />
In order to obtain higher levels of performance, additional equipment is required on JET.<br />
Fig.9 shows the plasma profiles which are envisaged. They correspond to an energy content<br />
of ~20MJ <strong>and</strong> would produce -10MW of a-power. If T£~0.3-0.4S, Qcrshould reach 1 —2.
46 JET TEAM<br />
Low shear<br />
zone Shear zone<br />
FIG. 9. Density (n), temperature (T) <strong>and</strong> safety factor (q) profiles aimed for according to the latest JET<br />
strategy. The shaded area represents the zone q = 2.<br />
Such plasma parameters could be obtained in the following ways:<br />
(i)<br />
(ii)<br />
(iii)<br />
(iv)<br />
(v)<br />
Sawteeth oscillations should be stabilized or have periods of several confinement times.<br />
This should be achieved by flat q profiles (q>l, q' = 0) over a large plasma crosssection,<br />
working with a low q boundary <strong>and</strong> driving part of the current (~2-3MA)<br />
in the outer plasma by Lower Hybrid Current Drive (LHCD) (~ 10MW) <strong>and</strong> by NB<br />
injection. The ICRF antennae with proper phase control could also be used to launch<br />
a travelling wave <strong>and</strong> provide some additional localised current;<br />
Radiation cooling between the q = 2 surface <strong>and</strong> the plasma boundary would be<br />
minimised to allow operation below the major disruption limit <strong>and</strong> to provide high<br />
Te on the edge. Low Z material (C or Be) would be used to take advantage of its low<br />
ionisation potential;<br />
Since the temperature at the q~ 1 surface is higher when the density is lowered, edge<br />
pumping will be used. Further advantages of low densities in the outer region would<br />
be the prevention of disruptions <strong>and</strong> higher efficiency for LHCD;<br />
The D-T density on axis would be increased up to l-2xlO 2O m~ 3 by high velocity pellet<br />
injection (>5km/s);<br />
High central temperature (~12-15keV) would be achieved by a combination of 'on<br />
axis' ICRF heating, NBI at 160keV <strong>and</strong> current profile control.<br />
1.0
<strong>IAEA</strong>-CN-47/A-I-2 47<br />
This scheme will be tested in two configurations: (a) with a magnetic separatrix at 4MA<br />
<strong>and</strong> (b) with limiters at current values up to 7MA. Such a low-q discharge has been simulated<br />
in JET (see Fig.l(b)).<br />
The main aim of JET operation during the next phase will be to reach maximum<br />
performance with full additional heating power in deuterium plasmas, before proceeding<br />
to the final phase requiring the introduction of tritium. The starting date for D-T operations<br />
is linked to the performance reached in the previous phase <strong>and</strong> is expected in 1991. aparticle<br />
production must be sufficient to analyse its effects on the plasma <strong>and</strong> to answer<br />
the question whether a-particle heating degrades energy confinement as other heating<br />
methods. Although degradation is foreseen, this has direct consequences on the ignition<br />
margin <strong>and</strong> on the size of future devices.<br />
6. Implications for a Reactor<br />
Present results suggest that a way for a future reactor is to rely upon tight control of current<br />
<strong>and</strong> density profiles <strong>and</strong> intense heating inside the q = l surface to benefit from improved<br />
energy confinement <strong>and</strong> high central temperature (as proposed for JET). Alternatively, a<br />
size <strong>and</strong> current increase could lead to the required ignition temperature, without additional<br />
heating. The resulting simplification of the overall system could well compensate for the<br />
larger size. Scaling [13] suggests that in a Tokamak with a major radius of ~ x2.5 that<br />
of JET, plasma volume of - 2000m 3 <strong>and</strong> magnetic field slightly higher than in JET, a 15keV<br />
plasma with a confinement time of 15-25s could be reached with ohmic heating alone at<br />
a peak density - 2x 10 19 nT 3 , satisfying the ignition criterion. Then, the thermonuclear power<br />
output of the D-T burner could be increased by injecting fuel pellets: the thermal insulation<br />
should degrade as the additional heating provided by the a-particles increases without a<br />
strong variation of temperature. Burn control would be performed entirely through density<br />
control.<br />
7. Conclusions<br />
The following conclusions can be drawn at this stage:<br />
(a) Both ICRF <strong>and</strong> neutral beam (NB) injection methods are effective in delivering power<br />
into the JET plasma with the expected profile depositions. Large central electron <strong>and</strong><br />
ion temperature increases have been observed; te <strong>and</strong> 7j have both reached values of<br />
7.5keV at densities of 3xl0 19 m" 3 . At lower density (~ 1.5xl0 19 m- 3 ), 7]= 12.5keV has<br />
been measured;<br />
(b) For both heating methods, plasma energy has increased with input power. About 6MJ<br />
energy has been achieved in JET plasmas with ~ 18MW of total power input. However,<br />
the rate of energy increase with power^(AWyAP,) ~0.1-0.3s,is smaller than the<br />
corresponding ohmic confinement times (T£ ~0.6-0.8S). The fusion product <br />
has reached values in excess of 10 2 °m~ 3 .s:keV, both with ohmic heating at 5MA <strong>and</strong><br />
with additional heating; the degradation in confinement offsets the gains in density<br />
<strong>and</strong> temperature;<br />
(c) A higher fusion product value of ~2xl0 2 °m~ 3
48 JET TEAM<br />
(d) In the central region (inside the inversion radius) between sawtooth collapses, additional<br />
heating is effective in increasing the electron temperature of the plasma (cf monster<br />
sawteeth);<br />
(e) Outside this region, electron heating is poor. The electrons seem to be the main energy<br />
loss channel, which appears related to confinement properties <strong>and</strong> not to the heating<br />
process;<br />
(f) Good prospects exist on JET for production of several MW of a-particle power at<br />
a value QDT** 1;<br />
(g) a-particle heating is expected to behave in a similar fashion to other heating methods.<br />
Therefore, a reactor must either: (i) work at moderate currents with sophisticated<br />
control of the central region; or (ii) work at high currents without the need for complex<br />
control <strong>and</strong> additional heating.<br />
REFERENCES<br />
[1] HUGUET, M., et al., in Fusion Technology (SOFT) (Proc. 13th Symp. Varese, 1984), Vol. 1,<br />
Commission of the European Communities, Brussels (1984) 91.<br />
[2] LALLIA, P.P., et al., Plasma Phys. Controll. Fusion 28 (1986) 55.<br />
[3] BEHRINGER, K., et al., Paper <strong>IAEA</strong>-CN-47/A-IV-l, these Proceedings, Vol. 1.<br />
[4] JACQUINOT, J., et al., Paper <strong>IAEA</strong>-CN-47/F-I-1, these Proceedings, Vol. 1.<br />
[5] JET TEAM, Progress Rep. EUR-JET-PR-3 (EUR-10616.EN), Commission of the European<br />
Communities, Abingdon (1985).<br />
[6] CAMPBELL, D.J., et al., Paper <strong>IAEA</strong>-CN-47/A-VII-5, these Proceedings, Vol. 1.<br />
[7] REBUT, P.H., HUGON, M., in Plasma Physics <strong>and</strong> Controlled <strong>Nuclear</strong> Fusion Research 1984<br />
(Proc. 10th Int. Conf. London, 1984), Vol. 2, <strong>IAEA</strong>, Vienna (1985) 197.<br />
[8] WESSON, J.A., et al., Paper <strong>IAEA</strong>-CN-47/E-I-l-l, these Proceedings, Vol. 1.<br />
[9] TANGA, A., et al., Paper <strong>IAEA</strong>-CN^7/A-M, these Proceedings, Vol. 1.<br />
[10] DtiCHS, D.F., et al., Paper <strong>IAEA</strong>-CN^7/A-VI-1-1, these Proceedings, Vol. 1.<br />
[11] CORDEY, J.G., et al., Paper <strong>IAEA</strong>-CN-47/A-II-3, these Proceedings, Vol. 1.<br />
[12] REBUT, P.H., et al., Paper <strong>IAEA</strong>-CN-47/E-III-4, these Proceedings, Vol. 2.<br />
[13] THOMSON, K., et al., in Controlled Fusion <strong>and</strong> Plasma Heating (Proc. 13th Europ. Conf.<br />
Schliersee, 1986), Vol. 10c, Pt 1, European Physical Society (1986) 29.<br />
DISCUSSION<br />
R.J. GOLDSTON: In your presentation you mentioned the 'hot ion regime' at<br />
Ip = 3 MA, which had rE = 0.6 s, for Pe ~ 9 MW. Could you say how this fits<br />
into the broader set of data you have for X-point <strong>and</strong> limiter discharges?<br />
P.H. REBUT: In the case of a pure hot ion mode the confinement time (pulse<br />
No. 9775 in Fig. l(e)) is only 0.32 s. With X-point <strong>and</strong> H-mode operation, 0.6 s can<br />
be reached with a relatively high ion temperature of about 10 keV in the centre. This<br />
set of results does fit into the general JET data set.<br />
H. HORA: What was the highest number of fusion neutrons you measured <strong>and</strong><br />
what was the input energy, i.e. neutral beam plus tokamak operation?
<strong>IAEA</strong>-CN-47/A-I-2 49<br />
P.H. REBUT: The highest number of neutrons per second emitted from JET<br />
is 2.8 X 10 15 . The injected power was 8 MW, into a plasma limited on the inner<br />
wall.<br />
R.R. WEYNANTS: With regard to the X-point operation, can you comment<br />
on, first, the OH plasma confinement, <strong>and</strong>, second, the existence of a power<br />
threshold?<br />
P.H. REBUT: A minimum power of 6-8 MW was needed to obtain good confinement<br />
properties in the X-point mode of operation, which is a gain of up to a factor<br />
of two. This corresponds to a different plasma regime at the edge, near the separatrix.<br />
If this edge regime is not achieved, there is little difference between an X-point configuration<br />
<strong>and</strong> a 'st<strong>and</strong>ard' one.<br />
R.J. TAYLOR: For the high ion temperature mode, the electron energy confinement<br />
time must be considered separately. What is this time in the case of JET?<br />
P.H. REBUT: I agree that the electron energy confinement time is dominant for<br />
a fusion reactor, but without a full profile of the ion temperature <strong>and</strong> without knowing<br />
the ion transport in detail it is difficult to consider the electron confinement time<br />
separately. It may be estimated from Fig. 1, taking into account that half of the power<br />
might perhaps be transported directly by the ions.<br />
D. OVERSKEI: You indicated that rE improved with increasing plasma current<br />
<strong>and</strong> with the use of a single-null diverted magnetic configuration. Could you say<br />
whether this increase in TE is due predominantly to an increase in Ti(0) rather than<br />
to better confinement of ions?<br />
P.H. REBUT: The increase in confinement is mainly due to a widening of the<br />
profiles <strong>and</strong> to a pedestal in the electron temperature.<br />
B. COPPI: What values of the streaming parameters did you attain in order to<br />
observe the slide-away regime?<br />
P.H. REBUT: We did not make any measurement of the electron temperature.<br />
The current was 3 MA <strong>and</strong> the central density was close to 10" m~ 3 .
TFTR PLASMA REGIMES<br />
<strong>IAEA</strong>-CN-47/A-I-3<br />
R.J. HAWRYLUK, V. ARUNASALAM, M.G. BELL, M. BITTER,<br />
W.R. BLANCHARD, N.L. BRETZ, R. BUDNY, C.E. BUSH 1 , J.D. CALLEN 2 ,<br />
S.A. COHEN, S.K. COMBS 1 , S.L. DAVIS, D.L. DIMOCK, H.F. DYLLA,<br />
P.C. EFTHIMION, L.C. EMERSON 1 , A.C. ENGLAND 1 , H.P. EUBANK,<br />
R.J. FONCK, E. FREDRICKSON, H.P. FURTH, G. GAMMEL,<br />
R.J. GOLDSTON, B. GREK, L.R. GRISHAM, G. HAMMETT,<br />
W.W. HEIDBRINK 3 , H.W. HENDEL 4 , K.W. HILL, E. HINNOV, S. HIROE 1 ,<br />
H. HSUAN, R.A. HULSE, K.P. JAEHNIG, D. JASSBY, F.C. JOBES,<br />
D.W. JOHNSON, L.C. JOHNSON, R. KAITA, R. KAMPERSCHROER,<br />
S.M. KAYE, S.J. KILPATRICK, R.J. KNIZE, H. KUGEL, P.H. LaMARCHE,<br />
B. LeBLANC, R. LITTLE, C.H. MA 1 , D.M. MANOS, D.K. MANSFIELD,<br />
R.T. McCANN, M.P. McCARTHY, D.C. McCUNE, K. McGUIRE,<br />
D.H. McNEILL, D.M. MEADE, S.S. MEDLEY, D.R. MIKKELSEN,<br />
S.L. MILORA 1 , W. MORRIS 5 , D. MUELLER, V. MUKHOVATOV 6 ,<br />
E.B. NIESCHMIDT 7 , J. O'ROURKE 8 , D.K. OWENS, H. PARK,<br />
N. POMPHREY, B. PRICHARD, A.T. RAMSEY, M.H. REDI,<br />
A.L. ROQUEMORE, P.H. RUTHERFORD, N.R. SAUTHOFF, G. SCHILLING,<br />
J. SCHIVELL, G.L. SCHMIDT, S.D. SCOTT, S. SESNIC, J.C. SINNIS,<br />
F.J. STAUFFER 9 , B.C. STRATTON, G.D. TAIT, G. TAYLOR,<br />
J.R. TIMBERLAKE, H.H. TOWNER, M. ULRICKSON, V. VERSHKOV 6 ,<br />
S. VONGOELER, F.WAGNER 10 , R. WIELAND, J.B. WILGEN 1 ,<br />
M. WILLIAMS, K.L. WONG, S. YOSHIKAWA, R. YOSHINO",<br />
K.M. YOUNG, M.C. ZARNSTORFF, V.S. ZAVERYAEV 6 , S.J. ZWEBEN<br />
Princeton Plasma Physics Laboratory,<br />
Princeton University,<br />
Princeton, New Jersey,<br />
United States of America<br />
Abstract<br />
TFTR PLASMA REGIMES.<br />
Significant extensions in the TFTR plasma operating regimes have been achieved with additional<br />
heating system capability, installation of a multishot pellet injector, <strong>and</strong> the development of an enhanced<br />
confinement regime. In ohmically heated pellet-fuelled discharges characterized by highly peaked<br />
' Oak Ridge National Laboratory, Oak Ridge, TN, USA.<br />
2<br />
University of Wisconsin, Madison, WI, USA.<br />
3<br />
GA Technologies, Inc., San Diego, CA, USA.<br />
4<br />
RCA David Sarnoff Research Centre, Princeton, NJ, USA.<br />
5<br />
Balliol College, University of Oxford, Oxford, UK.<br />
6<br />
Kurchatov Institute of Atomic Energy, Moscow, USSR.<br />
7<br />
EG&G Idaho, Inc., Idaho Falls, ID, USA.<br />
8<br />
JET Joint Undertaking, Abingdon, Oxfordshire, UK.<br />
9<br />
University of Maryl<strong>and</strong>, College Park, MD, USA.<br />
10<br />
Max-Planck-Institut fur Plasmaphysik, Garching, Fed. Rep. Germany.<br />
11 JAERI, Naka-machi, Naka-gun, Ibaraki-ken, Japan.<br />
51
52 HAWRYLUK et al.<br />
density profiles, enhancements in TE have resulted in ne(0)rE(a) values of 1.5 x 10 20 m" 3 -s. In neutral<br />
beam heated discharges, an operating regime has been developed in which substantial improvements in<br />
energy confinement time <strong>and</strong> neutron source strength are observed. Ion temperatures of<br />
about 20 keV <strong>and</strong> n^T^Tfi)) values of 2 x 10 20 m~ 3 -S'keV have been achieved. This enhanced<br />
confinement regime is characterized by high values of (3p <strong>and</strong> low values of collisionality. The<br />
observed surface voltage, which is negative during beam injection, is compared with models including<br />
beam driven <strong>and</strong> bootstrap currents.<br />
I. Introduction<br />
The goals of the TFTR project are (1) to study reactor-grade<br />
plasmas with temperatures of order 10 keV <strong>and</strong> densities of order<br />
10 m , <strong>and</strong> (2) to achieve approximate breakeven between the<br />
power input to <strong>and</strong> the fusion output from the plasma (Q - 1).<br />
During the past year, high-power neutral-beam-heating experiments<br />
<strong>and</strong> ohmic-heating experiments utilizing a deuterium pellet<br />
injector have significantly extended the operating regimes of<br />
TFTR, as measured by the n (0)Tg(a)Ti(0) product <strong>and</strong> the Q-value<br />
achieved in neutral-beam-heated discharges.<br />
This paper gives a brief description of the TFTR device<br />
status <strong>and</strong> the operating regimes in gas-fueled <strong>and</strong> pellet-fueled<br />
ohmic discharges. A more extensive discussion of the pelletfueled<br />
discharges is given by Schmidt et al. [1]. Results from<br />
neutral-beam-heating experiments in the st<strong>and</strong>ard regime are also<br />
summarized briefly. A general description is given of the<br />
operating characteristics of discharges in the enhanced<br />
confinement regime; further information is contained in the papers<br />
by Goldston et al.[2], McGuire et al.[3], <strong>and</strong> Hill et al. [4].<br />
II. Machine Status<br />
An initial series of experiments with two (co-injecting)<br />
neutral beamlines was completed in April 1985, during which TFTR<br />
reached its original machine design specifications for plasma<br />
current <strong>and</strong> toroidal field (I = 2.5 MA <strong>and</strong> BT = 5.2 T) [5].<br />
Subsequently, two additional beamlines were installed; three<br />
beamlines are now aimed tangentially in the direction of the<br />
plasma current (co-injection), <strong>and</strong> one opposite (counterinjection).<br />
During the recent experiments, the maximum injected<br />
power was 20 MW with a full energy component of ~ 10 MW. The<br />
maximum beam voltage was 110 kV <strong>and</strong> the maximum pulse duration<br />
1.0 s. Most of the experiments were conducted with 0.5 s pulse<br />
lengths <strong>and</strong> an average beam voltage of ~ 95 keV. Deuterium<br />
injection was used in all of the experiments discussed here.<br />
During the last beamline installation, a large-area axisymmetric<br />
inner wall limiter was also installed. This limiter is composed<br />
of water-cooled Inconel plates covered with graphite tiles. The<br />
toroidal inner wall limiter <strong>and</strong> moveable limiter define the<br />
present maximum plasma dimensions as R = 2.48 m <strong>and</strong> a = 0.82 m.
0.6<br />
04<br />
\J.C.<br />
n<br />
-<br />
-<br />
_<br />
PELLET-<br />
FUELED<br />
*D2<br />
T D2<br />
i<br />
Ip(MA)<br />
1.4<br />
1.6<br />
2.2<br />
1.8<br />
a<br />
<strong>IAEA</strong><br />
(1984)<br />
]<br />
0.5<br />
<strong>IAEA</strong>-CN-47/A-I-3 53<br />
4.7<br />
b 'l<br />
4.8<br />
4.8 J<br />
0<br />
Movable<br />
Limiler<br />
JX<br />
m<br />
m<br />
% ?,'f,<br />
1 1<br />
FUEL!<br />
o 02<br />
* He<br />
o D2<br />
•<br />
1 X •<br />
V<br />
T<br />
i.e<br />
2.2<br />
BT(T)<br />
3.9 '<br />
| |<br />
I<br />
1.0<br />
1.5 2.0<br />
_ 2 21<br />
ne q R a (10 )<br />
1<br />
lMoraWe<br />
F/G. 1. Gross energy confinement versus neqjl a for ohmically heated discharges with <strong>and</strong> without<br />
pellet injection. The 1.6 MA discharges had reduced aperture, a = 0.7 m, compared with the other<br />
Jull-size 0.8 m discharges.<br />
III. Ohmically Heated Discharges<br />
Initial ohmic experiments reported in 1984 [6] at modest<br />
toroidal fields (< 2.8 T), plasma currents (< 1.H MA), <strong>and</strong><br />
densities (n < 3 x 10'' m~3) demonstrated that the global energy<br />
confinement cime, Tg, scales consistent with neqR a, reaching a<br />
maximum value of tg ~ 0.3 s. Subsequent experiments utilizing<br />
both gas- <strong>and</strong> pellet-fueled discharges have concentrated on<br />
exploring the applicability of this scaling law over a wider<br />
operating range in density, toroidal field, <strong>and</strong> plasma current.<br />
The analysis of the energy confinement time has relied<br />
principally upon a time-independent kinetic analysis code, SNAP,<br />
[5] <strong>and</strong> has been supplemented by magnetic measurements [7].<br />
Figure 1 is a summary of the ohmic-heating studies for full bore<br />
plasmas. In gas-fueled deuterium discharges, the confinement time<br />
increases up to 0.44 s. in reasonable agreement with n q sealing<br />
for ng < 4.8 x 10'' m"^. At higher densities, saturation is found<br />
to occur for both helium-gas <strong>and</strong> deuterium-pellet fueled<br />
discharges. In the high density regime, the confinement time is<br />
observed to be a weak function of plasma current.<br />
In addition to increasing the line-averaged density, pellet<br />
injection produces highly peaked density profiles. A lineaveraged<br />
density of 1.4 x 10 20 m~^ has been achieved 200 ms after<br />
the injection of five 2.7 mm pellets in experiments conducted on<br />
-<br />
-<br />
_
54<br />
2.0<br />
1.5<br />
• 2.2 MA<br />
o 1.4 MA<br />
HAWRYLUK et al.<br />
PT0T(MW)<br />
Fe = 3.4-4.3xl0'V 3<br />
10 15<br />
FIG. 2. Variation of the stored energy for 1.4 <strong>and</strong> 2.2 MA power scans, for a constrained density range<br />
<strong>and</strong> BT = 4.8 T, R — 2.48 m, a = 0.82 m. Magnetic measurements are compared with prediction of<br />
the Goldston L-mode model.<br />
the inner graphite limiter. This corresponds to a Murakami<br />
parameter, n R/BT = 6.5 x 10'' m T . The central electron<br />
density was 18 x 10 ^ m~-* <strong>and</strong> central electron temperature was<br />
1.4 keV, as measured by Thomson scattering. This peaked density<br />
profile was achieved by operating with a reduced plasma minor<br />
radius of 0.7 m <strong>and</strong> a plasma current of 1.6 MA, in order to<br />
improve pellet penetration. The energy confinement time was<br />
~0.50 s according to kinetic <strong>and</strong> diamagnetic measurements<br />
corresponding to an ne(0)rE = 1.4 x 10 20 m"^>s. The energy<br />
confinement time is ~ 20$ greater than that achieved in gas-fueled<br />
discharges with the same values of I , R, <strong>and</strong> a, using either<br />
deuterium or helium as the working gas.<br />
IV. Neutral-Beam-Heating Studies in the St<strong>and</strong>ard Regime<br />
The variation of energy confinement time with injection<br />
power up to ~ 15 MW was studied systematically. These experiments<br />
were conducted in the large plasma configuration on the inner wall<br />
limiter with deuterium gas fueling, deuterium beams, I = 1.4 <strong>and</strong><br />
2.2 MA, <strong>and</strong> BT = 4.8 T [7]. Figure 2 shows the variation in the<br />
total stored energy for the 1.4 <strong>and</strong> 2.2 MA power scan with a<br />
constraint on the density at the end of injection. Kinetic <strong>and</strong><br />
magnetid measurements (using the techniques described in Ref. 7)<br />
are in good agreement. The stored energy increases linearly with<br />
heating power; however, the rate of increase of stored energy,<br />
dWD/dP^ea£, is appreciably less than the ohmic confinement time.<br />
The gross energy confinement time tE(a), defined as W,<br />
dW,r,QT/dt), where WTQJ = We + W, + W.<br />
data shown in Fig. 2, can be fitted to a<br />
is the "incremental" confinement time.<br />
y> - P 0H * > J ** th *<br />
orm a + S/P-pQ^, where a<br />
In the plasma density
<strong>IAEA</strong>-CN-47/A-I-3 55<br />
range of 3.4 < ne < 4.3 x lO 1 ^ m~^, a increases with plasma<br />
current from 61 ms to 94 ms as the current is increased from 1.4<br />
to 2.2 MA. The energy confinement time is observed to depend<br />
weakly upon density; however, a negative scaling of o with<br />
increased density is observed in the 1.4 MA discharges. At low<br />
density, the enhancement in stored energy at high power occurs in<br />
the beam <strong>and</strong> thermal ions, since the electron stored energy<br />
decreases slowly with decreasing density. The high-power beam<br />
heating in this current <strong>and</strong> density range results are also in fair<br />
agreement with the Goldston L-mode model [8] for hydrogen<br />
injection into deuterium plasma. Powerjlaw fits to the data shown<br />
in Fig. 2 indicate that WTQT « P-rOT V for P > 4 m<br />
TOT<br />
V. Neutral Beam Heating in the Enhanced-Confinement Regime<br />
Previous operation of TFTR at low I (0.4-1.0 MA) <strong>and</strong><br />
moderate beam power (Pb < 6 MW) using only co-injection £5]<br />
allowed access to a very low-density regime (n ~ 1 x 10^" m~'),<br />
characterized by high values of ion temperature (- 9 keV) <strong>and</strong><br />
rapid toroidal rotation velocity (up to ~ 7 x 10^ m/s). Recent<br />
experiments in this regime conducted at higher power (< 20 MW),<br />
using both co- <strong>and</strong> counter-injection, have demonstrated enhanced<br />
confinement relative to the predictions of L-mode scaling, along<br />
with central ion temperatures of ~ 20 keV at n - 3 x 10 1 ' m"^<br />
with a central ne(0) ~ 7 x 10 1 ' m~3 [9]. The achievement of this<br />
improved performance relative to the previous experiments is due<br />
to extensive degassing of the limiter <strong>and</strong> near-balanced injection<br />
(P ctr ~ PcO*-<br />
A procedure that results in a low recycling rate, as shown by<br />
decreases in the Da emission <strong>and</strong> edge neutral pressure, is<br />
identified to be critical in giving rise to the enhanced<br />
confinement regime [4,10]. Both low-density deuterium <strong>and</strong> helium<br />
discharges have been used to degas the inner wall. These high<br />
power discharges (0.8-1.8 MA) were not fueled following<br />
breakdown. Helium discharges were more effective in reducing the<br />
low-density limit <strong>and</strong> the decay time of the density following a<br />
diagnostic gas puff. The density decay time has been decreased<br />
from > 5 s to as low as = 0.15 s after extensive degassing. The<br />
low initial density of the target plasma <strong>and</strong> relatively high Ze~p<br />
- 6 is a consequence of the degassing procedure which effectively<br />
removes D + from the target plasma. The large density rise during<br />
injection [ne(final)/n"e(prior to injection) < 3-4] is accompanied<br />
by a decrease in ZQff to - 3 at the end of injection.<br />
Figure 3 shows a comparison of the temporal evolution of two<br />
discharges during neutral beam injection with different initial<br />
line-integral densities, different deuterium recycling rates due<br />
to different degassing histories, <strong>and</strong> comparable final lineintegral<br />
densities. In the discharge with the lower initial<br />
density, both the neutron source strength <strong>and</strong> the stored energy
56<br />
HAWRYLUK et al.<br />
4.5<br />
TIME (sec)<br />
FIG. 3. Comparison of the evolution of line average density, neutron source strength, Ha emission<br />
(which includes both Ha <strong>and</strong> Da emission) <strong>and</strong> stored energy for two discharges. The solid curve<br />
corresponds to a supershot. R = 2.48 m, a = 0.82 m, Pb = 12.5 MW<strong>and</strong>BT = 4.7 Tin the supershot<br />
discharge, whereas Pb = 11.4 MW <strong>and</strong> BT = 5.0 T in the other shot.<br />
increase throughout the 0.5 s neutral-beam pulse. The global<br />
energy confinement time is also substantially longer. Discharges<br />
that exhibit continually rising stored energy <strong>and</strong> neutron source<br />
strength during the half-second beam-injection have been<br />
colloquially termed "supershots". Experiments conducted in the<br />
final days of the experimental run demonstrated continued increase<br />
in stored energy with 0.7 s duration beam pulses <strong>and</strong> that the<br />
stored energy approached equilibrium with 1.0 s duration pulses.<br />
At plasma currents up to 1 MA, values of & = 2.0 from plasma<br />
diamagnetism have been measured. Maximum values of e up to 2.2<br />
have been achieved transiently. These high values of gl result in<br />
substantial outward shifts of the magnetic axis ( R n,ag- R geo^ /a ~<br />
0.1 <strong>and</strong> distortions of the plasma shape. The vertical %loTigation,<br />
K, decreases from 1.05 to < 0.9 in the most extreme cases. Figure<br />
4 shows a comparison of the electron temperature <strong>and</strong> density<br />
profiles measured near the end of the pulse for the discharges<br />
shown in Fig. 3. The discharge with the lower initial density<br />
(supershot) has a more peaked density profile, with a higher<br />
central density <strong>and</strong> a much broader electron temperature profile.<br />
Peak central electron temperatures of ~ 6.5 keV during injection<br />
have been obtained in supershots.
E<br />
at<br />
O<br />
1.5<br />
<strong>IAEA</strong>-CN-47/A-I-3 57<br />
2.0 2.5 3.0<br />
MAJOR RADIUS (m)<br />
2.0 2.5 3.0<br />
MAJOR RADIUS (m)<br />
FIG. 4. Comparison of Thomson scattering measurements of the electron temperature <strong>and</strong> density<br />
profiles at 4.45 s for the discharges shown in Fig. 3. The solid points are for the supershot discharge<br />
<strong>and</strong> the open circles are for the other shot.<br />
The central ion temperature is measured using several<br />
techniques. X-ray Doppler-broadening measurements have been<br />
carried out for Fe XXV <strong>and</strong> Ni XXVII Ka lines using a horizontally<br />
viewing crystal spectrometer <strong>and</strong> three vertically viewing<br />
spectrometers. The horizontal channel is rendered ineffective,due<br />
to neutron noise during supershots. In the analysis of the<br />
vertical detectors the large shift in magnetic axis needs to be<br />
taken into account. For the data shown in Fig. 5, the emitting<br />
region viewed by the vertical detector is - 0.2 m outside of the<br />
magnetic axis. Doppler-broadening measurements in the VUV have<br />
also been used to obtain central ion temperatures. The<br />
3.5
58 HAWRYLUK et al.<br />
no<br />
20<br />
~ 15<br />
^"10<br />
5<br />
n<br />
1 G o^ 8<br />
i<br />
[p=2.2M<br />
Ip= 1.4M<br />
- Ip=0.6-<br />
MA<br />
-<br />
-<br />
I<br />
A oj<br />
—1 1<br />
FeXEI.85A(Hor.).<br />
FeXSZI.85A(Vert.)<br />
FeXXE 192 A<br />
•a a AQ°*<br />
1 1<br />
—r~<br />
A<br />
A<br />
°<br />
4 X<br />
1<br />
i<br />
BjA# i<br />
1—<br />
L *A*<br />
,/nP(l0''Vm 3 )<br />
A<br />
1<br />
1<br />
k A<br />
>t 4 * -<br />
**A<br />
F/G. 5. Ion temperature versus PINJ/nc. Closed symbols are for 4.8 < BT < 5.2 T, 0.8 < Ip<br />
< 1.0 MA, R = 2.45 m <strong>and</strong> a = 0.80 m, <strong>and</strong> open symbols are for the discharges shown in Fig. 2.<br />
spectrometer has a horizontal radial view of the plasma. Onedimensional<br />
impurity transport simulations including chargeexchange<br />
recombination indicate that the mean radius of the<br />
emission profile for the lithium-like ions used is ~ 0.2 m. The<br />
heating beams have permitted preliminary spectroscopic<br />
measurements utilizing carbon lines excited by charge-exchange<br />
recombination. Good agreement between the various measurements is<br />
achieved.<br />
Figure 5 shows the variation in central ion temperature for<br />
discharges in the st<strong>and</strong>ard neutral-beam-heating regime (I = 1.1<br />
<strong>and</strong> 2.2 MA) <strong>and</strong> for both super <strong>and</strong> non-super low-i-urrent<br />
discharges (0.6 < I < 1.1 MA). In the low-current discharges,<br />
considerable variability in the heating results is obtained,<br />
reflecting the occurrence of MHD activity, variations in limiter<br />
history, <strong>and</strong> variations in the fraction of power in the codirection.<br />
Taking into account uncertainties in the measurements<br />
<strong>and</strong> the calculated differences between the impurity <strong>and</strong> hydrogenic<br />
ion temperatures which are < 2 keV, these results indicate central<br />
bulk ion temperatures of ~ 20 keV. The maximum value of the ion<br />
heating efficiency parameter, ne ATJ/P^J, is ~ 3.8 x 10 13 keV-W" 1 -<br />
m~3. This is in comparison with previous experiments [5] in which<br />
figATj/Pjuj was - 1.5 x 10 13 keV-W 1 . m" 3 .<br />
Figure 6 shows the scaling of stored energy with power. An<br />
important characteristic of the enhanced confinement regime is the<br />
fraction of power in the co-direction, PCQ /P INJ- AS snown in Fi 8-<br />
6, at a given power the highest stored energy (<strong>and</strong> hence T^) is<br />
1<br />
•<br />
-
,(MA)<br />
0.9<br />
0.9<br />
0.9<br />
1.0<br />
P /P<br />
r C0 INJ<br />
0.5-0.6<br />
1.0<br />
0.63-0.7<br />
0.7-0.8<br />
<strong>IAEA</strong>-CN-47/A-I-3 59<br />
10<br />
PINJ(MW)<br />
L-Mode<br />
'0.9 MA<br />
15 20<br />
FIG. 6. Variation of stored energy with injected power for different values of fractional power in the<br />
co-direction, for 4.7 < BT < 5.2 T, 2.40 < R < 2.48 m <strong>and</strong> 0.76 < a < 0.82 m. Magnetic<br />
measurements are compared with the prediction of the L-mode model of Goldston.<br />
achieved with nearly balanced injection ( p r(/ P INJ ~ °*^ in<br />
discharges with degassed limiters. In Fig. b, the data set was<br />
constrained to eliminate discharges with very-large-amplitude<br />
continuous MHD activity [3]. With nearly balanced injection the<br />
stored energy increases linearly with heating power <strong>and</strong> the<br />
incremental confinement time is 0.15 s, comparable to the lowdensity<br />
ohmic confinement time prior to injection. Furthermore,<br />
with near balanced injection the global confinement time is not<br />
observed to degrade with power: values up to 0.17 s are achieved<br />
with 12 MW,as shown in Fig. 7, <strong>and</strong> the confinement time is up to ~<br />
3 times the prediction of Goldston L-mode scaling [8]. With the<br />
present distribution of beam sources, at full power PcQ^INJ is ~<br />
0.7, which is not optimum, as indicated in Fig. 7. The highest<br />
power experiments were conducted at higher current (1.0 MA) to<br />
minimize the effects of MHD activity.<br />
The energy stored in the discharge appears to be limited by<br />
a maximum 6p value of ~ 2. Further increases in power at a given<br />
current result in either disruptions or MHD activity degrading the<br />
stored energy [3]. At low toroidal field <strong>and</strong> modest qa (~ 4-5),<br />
the maximum stored energy is in fair agreement with the Troyon 6T<br />
limit [e^ ax = (2.2-2.5] wQI /aBTJ [11]. At high toroidal field<br />
<strong>and</strong> qa the Troyon BT limit would permit 6D values up to - 3.5.<br />
At higher plasma current (I > 1.1 MA), the favorable<br />
characteristics of supershots have not been observed, <strong>and</strong> the
60<br />
_ <<br />
0.15-<br />
ft<br />
s 0.10 -<br />
Ip(MA) P / P~~~"-~-<br />
CO INJ<br />
0.05 ~o -7 0.9 0.5-0.6<br />
0.9 1.0<br />
0.9 0.63-0.7<br />
A 1.0. 0.7-0.8<br />
1<br />
1<br />
HAWRYLUK et al.<br />
1<br />
••<br />
L-Mode/~<br />
(0.9MA)<br />
1<br />
10<br />
PINJ(MW)<br />
k A A<br />
i<br />
15 20<br />
FIG. 7. Variation of global confinement time with injected power for the data set shown in Fig. 6.<br />
Magnetic measurements are compared with the prediction of the L-mode model of Goldston.<br />
difference in tg between balanced <strong>and</strong> co-only injection at P^ =<br />
10 MW is less %han \5%. Supershot characteristics at higher<br />
current (1.3 MA with 17 MW of neutral beam power) can be achieved<br />
by ramping the current from 0.9 MA during the beam pulse,<br />
resulting in q = 5. Further extension of the operating regime<br />
may be possible with the longer-duration (2.0 s) <strong>and</strong> higher-fullenergy-species-mix<br />
beam sources (80? power at full energy) that<br />
are currently being installed. Present current-ramp experiments<br />
are encouraging in that supershot characteristics are observed<br />
even when fairly large current-ramp rates up to 1 MA/sec are<br />
applied. By tailoring the beam power waveform <strong>and</strong> the current<br />
ramp, it may be possible to achieve supershots with much higher<br />
currents, thus avoiding the B limits.<br />
In discharges in which the plasma current is maintained<br />
constant by feedback control, the surface voltage is observed to<br />
decrease from the ohmic phase with increasing 6D <strong>and</strong> co-injected<br />
power <strong>and</strong> is typically ~ -0.2 V at the end of injection. Though<br />
the electron temperature increases <strong>and</strong> broadens <strong>and</strong> Z ^<br />
decreases, changes in conductivity alone cannot produce a negative<br />
voltage. The changes in plasma geometry coupled with changes in<br />
conductivity are also not large enough to account for the negative<br />
voltage, as determined by a one-<strong>and</strong>-one-half dimensional magnetic<br />
field diffusion calculation. Monte Carlo beam calculations show<br />
that neoclassical beam-driven currents [12] contribute to the<br />
decrease in surface voltage, but still do not account for the<br />
magnitude. The calculations show that, due to the beam orbits,<br />
co-injection is more effective in driving current, particularly in
-0.5<br />
<strong>IAEA</strong>-CN-47/A-I-3 61<br />
Measured<br />
OhmicOnly<br />
Beam ft Ohmic<br />
Beam, Bootstrap 8 Ohmic<br />
Pinj=IO.6MW,PCo/Pinj=O.57<br />
mzmmmmzm<br />
4.5<br />
TIME(sec)<br />
FIG. 8. Comparison of the measured surface voltage with the calculated surface voltage under different<br />
assumptions for the role of non-ohmically driven currents. The discharge parameters are BT = 5.2 T,<br />
R = 2.45 m <strong>and</strong> a = 0.8 m.<br />
outer regions of plasma, than counter-injection; thus, even when<br />
the power is nearly balanced, a net beam-driven current effect on<br />
the surface voltage is calculated. By including the neoclassical<br />
bootstrap current predicted by Galeev <strong>and</strong> Sagdeev [13] <strong>and</strong><br />
Bickerton et al. [1*1] as formulated by Hirshman <strong>and</strong> Sigmar [12],<br />
good agreement is obtained between the calculated <strong>and</strong> measured<br />
surface voltage, as shown in Fig. 8. These calculations indicate<br />
that for this case approximately 350 kA of bootstrap current is<br />
present, compared with 420 kA of co-injected current <strong>and</strong> -160 kA<br />
of counter-injected current. In presently analyzed discharges,<br />
the maximum calculated bootstrap current is HkO kA in a 900 kA<br />
plasma with 370 kA of calculated beam-driven current. While the<br />
driven currents do not exceed the total current, the calculated<br />
voltage is negative because the radial distribution of the<br />
bootstrap current is broader than that of the ohmic current,<br />
exceeding the total current density in the outer region of the<br />
plasma.<br />
Operation in the supershot regime has resulted in<br />
substantial increases in neutron source strength <strong>and</strong> equivalent<br />
Q. The maximum neutron source strength of 1.2 x 10^° n/s was<br />
achieved with 19.6 MW of.beam power, with P(;O /P INJ = °-?' The<br />
maximum QDD of 8.7 x 10" 4 was achieved with 12.3 MW, when the<br />
power was more nearly balanced (.Pcc/ P INJ ~ °-56), corresponding to<br />
a source strength of 8.9 x 10 15 n/s. In the supershot regime,<br />
SNAP <strong>and</strong> time-dependent (TRANSP) calculations of the neutron flux<br />
are in good agreement (± 25?) with the measured flux. These<br />
calculations indicate that, for the discharge with the highest
62 HAWRYLUK et al.<br />
value of QDD, ~ W% of the flux is due to beam-beam reactions, ~<br />
53? due to beam-target, <strong>and</strong> ~ 30% from the thermalized ions<br />
shortly before the end of the beam pulse. In order to estimate<br />
the QDT which would be achieved witb deuterium <strong>and</strong> tritium, it is<br />
necessary to assume a composition for the hydrogenic component of<br />
the target plasma. For the hypothetical condition of deuterium<br />
beam injection into a tritium plasma (with the same value of Zeff.<br />
= 3.3), QDT would be 0.23, due to beam-target reactions. Because<br />
beam fueling is clearly very important, a more realistic case<br />
would be to consider injection using deuterium <strong>and</strong> tritium beams<br />
into a 50J&/50? deuterium/tritium plasma. In this case, the<br />
resulting value of QDT would be = 0.18. A significant improvement<br />
over these values can be expected from the new long-pulse ion<br />
sources with better species mix, operation at 120 kV, <strong>and</strong> nearly<br />
balanced injection at full beam power, even without assuming<br />
higher injected power <strong>and</strong> improved plasma parameters.<br />
During the past year, substantial progress has been made in<br />
exp<strong>and</strong>ing the operating range of TFTR. Ohmically heated pelletfueled<br />
discharges have resulted in exceptional central densities<br />
<strong>and</strong> ng(0) tE(a) Ti(0) values of ~ 2 x 10^° nT^-s-keV.<br />
Furthermore, in the saturated regime, the confinement time in<br />
pellet-fueled discharges is observed to be longer than that<br />
achieved in gas-fueled discharges. In these discharges, the<br />
density profile is very peaked, ne(0)/iie ~ 2.<br />
In neutral-beam-heated discharges an enhanced confinement<br />
regime has been found. This regime is characterized by peaked<br />
density profiles, broad electron temperature profiles, high ion<br />
temperatures,s 20 keV, <strong>and</strong> high neutron source strengths. In this<br />
regime, ne(0) T£(a) T^O) values of ~ 2 x 10 20 m~ 3 .s-keV have also<br />
been achieved. The operating regime is characterized by a low<br />
initial density <strong>and</strong> deuterium recycling prior to injection, which<br />
can only be achieved at low I <strong>and</strong> after extensive limiter<br />
degassing. At high toroidal field (BT = 5.2 T), this corresponds<br />
to relatively high values of q (in the range of 7-8) <strong>and</strong> 6p (up<br />
to 2). In reduced toroidal field experiments <strong>and</strong> in current ramp<br />
experiments, supershots with qa ~ 4-5 have been obtained.<br />
Significantly improved performance is achieved with nearly<br />
balanced injection.<br />
In the high temperature regime, the plasma collisionality is<br />
low <strong>and</strong> 8 is high, so that both beam-driven currents <strong>and</strong><br />
bootstrap currents are predicted to be important. Calculations<br />
including bootstrap current are in better accord with the<br />
experimental measurements than those including only the beamdriven<br />
currents. If these indications of the bootstrap current<br />
are verified by future experiments, the performance of tokamak<br />
reactors could be fundamentally enhanced.
<strong>IAEA</strong>-CN-47/A-I-3 63<br />
Acknowledgements<br />
We are grateful to D.J. Grove <strong>and</strong> J.R. Thompson for their<br />
advice <strong>and</strong> support, <strong>and</strong> to J. Strachan for his many<br />
contributions. This work was supported by US DOE Contract No. DE-<br />
AC02-76CHO3073. The ORNL participants were also supported by US<br />
DOE Contract No. DE-ACO5-84OR214OO with Martin Marietta Energy<br />
Systems, Inc.<br />
REFERENCES<br />
[1] SCHMIDT, G., et al., Paper <strong>IAEA</strong>-CN-47/A-III-4, these Proceedings, Vol. 1.<br />
[2] GOLDSTON, R.J., et al., Paper <strong>IAEA</strong>-CN-47/A-II-l, these Proceedings, Vol. 1.<br />
[3] McGUIRE, K., et al., Paper <strong>IAEA</strong>-CN-47/A-VII-4, these Proceedings, Vol. 1.<br />
[4] HILL, K.W., et al., Paper <strong>IAEA</strong>-CN-47/A-IV-2, these Proceedings, Vol. 1.<br />
[5] MURAKAMI, M., et al., Plasma Phys. Controll. Fusion 28 (1986) 17.<br />
[6] EFTHIMION, P.C., et al., in Plasma Physics <strong>and</strong> Controlled <strong>Nuclear</strong> Fusion Research 1984<br />
(Proc. 10th Int. Conf. London, 1984), Vol. 1, <strong>IAEA</strong>, Vienna (1985) 29.<br />
[7] BELL, M.G., et al., Plasma Phys. Controll. Fusion 28 (1986) 1329.<br />
[8] GOLDSTON, R.J., Plasma Phys. Controll. Fusion 26 (1984) 87.<br />
[9] STRACHAN, J.D., et al., submitted to Phys. Rev. Lett., 1986.<br />
[10] DYLLA, H.F., et al., submitted to Nucl. Fusion, 1986.<br />
[11] TROYON, F., et al., Plasma Phys. Controll. Fusion 26 (1984) 209.<br />
[12] HIRSHMAN, S.P., SIGMAR, D.J., Nucl. Fusion 21 (1981) 1079.<br />
[13] GALEEV, A.A., SAGDEEV, R.Z., Zh. Ehksp. Teor. Fiz. 53 (1967) 348 (Sov. Phys. - JETP<br />
26 (1968) 233).<br />
[14] BICKERTON, R.J., CONNER, J.W., TAYLOR, J.B., Nat. Phys. Sci. 229 (1971) 110.<br />
DISCUSSION<br />
A. GIBSON: In the two cases for which you quote the large values<br />
what is the ratio nD/ne?<br />
R.J. HAWRYLUK: In high density pellet fuelled discharges, the correction<br />
factor for depletion is small, since Zeff is about one. In the supershot discharge, the<br />
depletion factor, nD(0)/n,,(0), is about 0.7.<br />
M. GREENWALD: Are you quite sure of the Zeff profiles in your pellet<br />
fuelled shots? I ask this because there seems to be evidence of impurity accumulation.<br />
R.J. HAWRYLUK: We do not have Zeff profile measurements for the pellet<br />
fuelled discharges. In some discharges, there is substantial radiation on axis;<br />
however, even small concentrations of impurities would be adequate to explain the<br />
power loss.<br />
Further, experiments are required to analyse impurity transport in pellet fuelled<br />
discharges <strong>and</strong> to determine whether accumulation occurs <strong>and</strong>, if so, under what<br />
conditions.
64 HAWRYLUK et al.<br />
S. ITOH: I would like to ask about the target plasma for the 'supershot'. Is the<br />
target plasma in a slide-away regime? Judging by the target parameters, it would<br />
seem to be. Secondly, did you see any input power limit or threshold for the injection?<br />
The supershot discharges seem to be similar to the ASDEX discharges with<br />
slide-away electrons reported at the 1982 Conference.<br />
R.J. HAWRYLUK: In some of the target plasma, electron cyclotron emission<br />
measurements indicate the presence of slide-away electrons. However, they are not<br />
evident in all of the supershot discharges <strong>and</strong> the occurrence of a slide-away does not<br />
appear to be a critical parameter.<br />
Regarding your second question, at a given current there is an upper power limit<br />
present that corresponds to attainment of the j8p limit d8p ~ 2) which I discussed.<br />
However, higher current operation enables us to inject the available 20 MW of<br />
neutral beam power <strong>and</strong> to maintain supershot characteristics.<br />
K. LACKNER: Troyon-type scalings, ^pol) crit ~ q0, are obtained for current<br />
density profiles adjusted to maintain q on axis at a constant value of about one. A<br />
reduction in /3pol cri, <strong>and</strong> independence of it from qa, as reported by you for low<br />
currents, would follow from theory for a current density profile flatter <strong>and</strong> nondependent<br />
on qa.<br />
R.J. HAWRYLUK: In their paper, McGuire <strong>and</strong> co-workers* show that the<br />
profiles are not optimal, which is why the experimental beta limit is below that<br />
predicted by Troyon. The lack of sawteeth indicates that q on axis is greater than one.<br />
However, since the current penetration time is long compared with the beam duration,<br />
q is not substantially greater than one, according to our analysis.<br />
M. BRUSATI: You have reported degradation of performance correlated with<br />
enhanced MHD activity. Can you comment on the kind of MHD spectra that you get?<br />
R. J. HAWRYLUK: The mode number of the continuous MHD activity which<br />
degrades performance is typically m/n = 2/1 or 3/2. For further details, I would refer<br />
you to the paper by McGuire <strong>and</strong> co-workers that I have just mentioned.*<br />
Paper <strong>IAEA</strong>-CN-47/A-VII-4, these Proceedings, Vol. 1.
EXPERIMENTAL STUDIES IN JET<br />
WITH MAGNETIC SEPARATRIX<br />
A. TANGA, D.V. BARTLETT, K. BEHRINGER,<br />
RJ. BICKERTON, A. CHEETHAM, J.G. CORDEY,<br />
A. GIBSON, N.A. GOTTARDI, A. GONDHALEKAR,<br />
P.J. HARBOUR, H. JAECKEL, M. KEILHACKER,<br />
E. LAZZARO, V. MARTENS, P. NOLL, S. NOWAK,<br />
F.C. SCHULLER, A.J. TAGLE, A. TARONI,<br />
P.R. THOMAS, F. TIBONE<br />
JET Joint Undertaking,<br />
Abingdon, Oxfordshire,<br />
United Kingdom<br />
Abstract<br />
<strong>IAEA</strong>-CN-47/A-I-5<br />
EXPERIMENTAL STUDIES IN JET WITH MAGNETIC SEPARATRIX.<br />
The main objectives of the experiments described are (i) to compare the global confinement<br />
characteristics of separatrix <strong>and</strong> limiter discharges <strong>and</strong> (ii) to study the conditions for the creation of<br />
a high density, highly radiative, cool plasma region near the X-point capable of screening <strong>and</strong> isolating<br />
the bulk plasma. Compared to similar limiter discharges, the thermal energy content of single null<br />
X-point discharges (SN) is roughly a factor of two higher. Plasmas with even modest separation between<br />
X-point <strong>and</strong> target plates show typical signatures of H-mode discharges. Multi-channel infrared interferometer<br />
meausurements provide evidence of the formation of a high density diverted plasma with<br />
average density — 10 20 m" 3 , an order of magnitude higher than the main plasma. Measurements with<br />
a bolometer camera array show that, in high density discharges with additional power, up to 40% of<br />
the input power is radiated within a —0.2 x 0.2 m 2 toroidal region around the torus.<br />
1 . INTRODUCTION<br />
The main aim of JET is to study plasmas under conditions<br />
approaching those needed for a fusion reactor. At present, in<br />
limiter discharges, confinement with additional heating is low<br />
(L-mode). Better confinement (H-mode) has been observed in<br />
tokamaks with magnetic limiters or divertors. In JET, a<br />
magnetic configuration with a separatrix inside the vacuum<br />
vessel can be created [1]. Two ("double null configuration",<br />
DN) or one ("single null configuration", SN) poloidal field<br />
nulls are then produced near the top <strong>and</strong>/or bottom of the vessel<br />
as shown in Figs. 1a <strong>and</strong> 1b.<br />
In these configurations the plasma is detached from both<br />
the limiter <strong>and</strong> the inner wall <strong>and</strong> recycling occurs in an open<br />
divertor region near the X-point. Experiments have been carried<br />
65
66<br />
Z(m)<br />
20<br />
1.0<br />
-1.0<br />
0<br />
-2D<br />
\<br />
iBH)*<br />
1.0 2.0 3.0 4.0<br />
R(m)<br />
FIG. I. (a) Flux plot of a double null configuration. Plasma current = 2 MA, toroidal field = 2.8 T,<br />
average electron density = 3 X 10 19 m' 3 , poloidal beta = 0.44, plasma elongation = 1.8.<br />
(b) Flux plot of a single null configuration. Plasma current = 2 MA, toroidal field = 2.2 T, average<br />
electron density = ix 10 19 m~ 3 , poloidal beta = 0.6, plasma elongation = 1.65(ttlO237,<br />
t = 13.5 s).<br />
out with plasma currents up to 2.5MA in the DN <strong>and</strong> up to 3-OMA<br />
in the SN configuration. A maximum additional power of 9MW has<br />
been injected (D° into D + ).<br />
2. FORMATION OF A MAGNETIC SEPARATRIX<br />
A magnetic separatrix can be formed within the vacuum<br />
vessel of JET using the multlpolar field normally used to<br />
control the elongation <strong>and</strong> triangularity of the plasma<br />
cross-section. In the DN configuration, the present poloidal<br />
field equipment allows operation at plasma currents up to 2.5MA.<br />
The resulting plasma has an elongation of 1.8; the vertical<br />
position is unstable with an open loop growth rate of 150s" 1 .<br />
The separation between the X-point <strong>and</strong> the graphite target<br />
plates is a linear function of the currents in the shaping<br />
coils. For the configuration in Fig.1a the separation is -0.1m.<br />
In the SN configuration, plasma currents up to 3.0MA have been<br />
produced with an elongation of 1.65; the growth rate of the<br />
vertical instability is substantially smaller than for the DN<br />
configuration.<br />
The maximum separation between the X-point <strong>and</strong> the target<br />
plates obtained so far at 2MA with SN is -0.13m <strong>and</strong> may be<br />
increased by displacing the magnetic axis below the midplane.
<strong>IAEA</strong>-CN-47/A-I-5 67<br />
The radial position of the null point is held constant during<br />
the discharge, to within a few centimetres. The distance<br />
between the separatrix <strong>and</strong> the antennae for ICRH is finely<br />
controlled by the radial position feedback system <strong>and</strong> this can<br />
allow good coupling of ICRH to the plasma. In both DN <strong>and</strong> SN<br />
configurations, Langmuir probe measurements give the e-folding<br />
length for decay of density <strong>and</strong> temperature as 0.06m <strong>and</strong> 0.10m,<br />
respectively.<br />
The location of the separatrix has been corroborated to<br />
within a few centimetres by observations with a bolometer camera<br />
array <strong>and</strong> TV cameras <strong>and</strong> by the separation between the erosion<br />
marks on the graphite target tiles. The magnetic configuration<br />
is only slightly sensitive to changes in internal parameters,<br />
such as the poloidal beta <strong>and</strong> internal inductance.<br />
3. HIGH RECYCLING IN THE X-POINT REGION<br />
The formation of a magnetic separatrix within the vacuum<br />
vessel produces a significant change in the discharge<br />
characteristics. For separations between the plasma <strong>and</strong> the<br />
llmiter larger than 0.07m, deuterium recycling (monitored by Da<br />
signals) shifts from the limiters to small regions near the<br />
X-points. Both the Da monitors <strong>and</strong> TV observations in the near<br />
infra-red show the formation of bright regions (-0.2m across)<br />
coinciding with the X-points. In high density DN discharges,<br />
only one bright region is observed. The application of a radial<br />
magnetic field shifts the toroidal plasma column vertically <strong>and</strong><br />
the bright region moves correspondingly, indicating that the<br />
formation of only a single bright region is not connected with<br />
slight up-down asymmetries in the poloidal field.<br />
Simultaneous with the shift in recycling characteristics,<br />
stronger gas-fuelling is needed to sustain the average plasma<br />
density, Zeff is reduced <strong>and</strong> the bolometer camera array shows a<br />
decrease in bulk plasma radiation <strong>and</strong> a large increase in the<br />
radiation from the X-point region. As shown in Fig.2a for a<br />
series of ohmic DN discharges, the total radiated power is in<br />
most cases between 70 <strong>and</strong> 100? of the input power <strong>and</strong> the power<br />
radiated in the X-point region increases with plasma density<br />
more rapidly than the total radiated power. SN discharges show<br />
similar behaviour with the power radiated from the X-point<br />
region, following approximately a density-squared dependence.<br />
The size of the highly radiative region in the vicinity of the<br />
X-point can be estimated to be SO.2x0.2m 2 .<br />
The far infra-red multichannel interferometer suggests a<br />
similar small region with high electron density near the<br />
X-point. When one of the vertical channels of the<br />
interferometer passes through the X-point region, the fringe<br />
count for that channel shows a substantial increase over the<br />
other channels. This can be interpreted as a measurement of the<br />
local X-point line density. In Fig.2b, the difference between
68 TANGA et al.<br />
P<br />
(MW)<br />
1.5<br />
1.0 -<br />
0.5-<br />
0<br />
A(/nedl)<br />
(1O l9 m 2 ) _<br />
-1<br />
X<br />
X<br />
k<br />
a s-<br />
•—"•"* x<br />
« X<br />
X XX<br />
FIG. 2. (a) Radiated power versus line average electron density for Ohmic double null configuration.<br />
Dots represent power radiated from X-point, crosses total power radiated from plasma,<br />
(b) Difference in line density between two adjacent interferometer channels one of which intercepts<br />
the X-point.<br />
two adjacent channels of the interferometer has been plotted<br />
against the line average electron density. Assuming that the<br />
size of this high density plasma region corresponds to that of<br />
the highly radiative region the density in the X-point region is<br />
estimated to be -10 2O m~ 3 . No data are available for average<br />
plasma densities larger than 2x10 1 because the channel of<br />
the interferometer intercepting the X-point loses fringes.<br />
Assuming that the thickness of the high recycling region<br />
corresponds to the mean free path for neutrals, X°, the<br />
interferometer data provides a measure of [2]<br />
nt \°<br />
v°<br />
TavT<br />
where v° is the effective speed of the emitted atoms <strong>and</strong> is<br />
the effective rate coefficient for ionisation. Assuming a<br />
*<br />
a)<br />
b)
<strong>IAEA</strong>-CN-47/A-I-5 69<br />
single temperature, Tt, for electrons, ions <strong>and</strong> neutrals, the<br />
right h<strong>and</strong> side of this equation is only a function of T^.<br />
Tt~5-10eV is obtained for ne>1xiO 19 m~ 3 . The density, nt, may<br />
also be estimated from a zero-dimensional model which balances<br />
the power flow from the bulk plasma with sonic flow at the high<br />
density region in the scrape-off layer. For ng>1x10 l9 m" 3 ,<br />
n^.-4x10 19 rn~ 3 is obtained, in reasonable agreement with the<br />
estimates made earlier.<br />
This trend towards high recycling is further corroborated<br />
by Langmuir probe measurements which suggest that the Mach<br />
number of the flow parallel to the magnetic field decreases with<br />
increasing plasma density.<br />
4. IMPROVED CONFINEMENT WITH ADDITIONAL HEATING IN THE SINGLE<br />
NULL CONFIGURATION<br />
DN X-point discharges show an energy confinement time some<br />
20-30$ higher than similar limiter or inner wall discharges.<br />
However, no clear H-mode transition was identified as the power<br />
levels available. Recent experiments have therefore<br />
concentrated on the SN configuration. First results show a<br />
substantial improvement of energy confinement in SN X-point<br />
discharges compared to similar limiter or inner wall discharges.<br />
The experiments have been carried out with neutral beam<br />
injection heating with up to 9.OMW power. Ion cyclotron heating<br />
has been applied in some of the shots with a power of up to 4MW<br />
(but keeping the total input power, Ptot =p fl +P NBI +P RF= 20MW )•<br />
In Fig.3 the variation of the total plasma thermal energy<br />
content with total input power P^ot *" or two ser i es °f SN X-point<br />
discharges at plasma currents of 2MA <strong>and</strong> 3MA is compared with<br />
the corresponding data sets for limiter discharges. While the<br />
separation of the X-point <strong>and</strong> the target plates is -0.13m at 2MA<br />
this is reduced to ~0.5m at 3MA <strong>and</strong> is then rather close to the<br />
wall. For either plasma current the energy content of the<br />
X-point discharges is up to a factor of 2 larger than that of<br />
the corresponding limiter discharge with the same additional<br />
power. In general, the trend with increasing heating power is<br />
also similar in all cases.<br />
As shown in Fig.4, the electron temperatures (<strong>and</strong> also the<br />
central ion temperatures ifor such an X-point H-mode plasma are<br />
substantially higher than for a limiter plasma with the same<br />
parameters of plasma density, plasma current, toroidal field <strong>and</strong><br />
Ptot. It should be noted that the electron temperature profile<br />
is broader, with the edge temperature at R=4.0m being some 2.5<br />
times higher.<br />
As pointed out already the SN discharges at 2MA exhibit<br />
clear indications of a transition into an H-mode [3]. As shown<br />
in Fig.5 the edge D signal (f) drops <strong>and</strong> the line integrated<br />
electron density (d) increases more rapidly. These events occur<br />
shortly after the crash of a sawtooth when the edge temperature
70 TANGA et al.<br />
W(MJ) -<br />
i 2 MA (X-point)<br />
6 -<br />
o 3MA (Limiter)<br />
4 -<br />
2 -<br />
fl 2 MA (Limiter)<br />
• 3MA (X-point)<br />
1<br />
i<br />
•<br />
• SINGLE NULL<br />
4 ^ LIMITER<br />
P,c<br />
i<br />
10 15<br />
F/G. 5. Tofa/ plasma thermal energy content as measured by diamagnetic loop versus total input power<br />
for single null <strong>and</strong> limiter configurations.<br />
(keV)<br />
FIG. 4. Electron temperature profiles (a) X-point (#10237, t = 13.5 s) <strong>and</strong> (b) limiter discharge<br />
(§7709). Central ion temperature for SN (X) <strong>and</strong> Limiter (L) discharge.
Ptot<br />
(MW)<br />
<strong>IAEA</strong>-CN-47/A-I-5 71<br />
Transition<br />
12.0 13.0 14.0<br />
time (s)<br />
FIG. 5. (a) Total input power Pm, for #10237;<br />
(b) Power conducted to the target plates from, bolometric analysis, Plol — Prad — W;<br />
(c) Total energy content from the diamagnetic loop, W;<br />
{d) Line electron density, $nedl;<br />
(e) Plasma edge electron temperature,<br />
(f) Da signal from the plasma boundary.<br />
(e) increases abruptly. The power flow to the target plates (b)<br />
is substantially reduced. This phase is subject to an abrupt<br />
termination when the average density reaches some limiting value<br />
(as evidenced more clearly in other JET Pulses where this event<br />
is not obscured by the end of additional heating). The average<br />
density, temperature <strong>and</strong> thermal energy content (c) fall in<br />
about 40ms, accompanied by a spike in the X-point radiation.<br />
During the H-phase the plasma density profile broadens with<br />
steep gradients developing at the edge.<br />
Impurity radiation from the plasma edge (0 VI, C IV) falls<br />
by about a factor of two at the transition to the H-regime. At<br />
this time the ICRH power ceases to be coupled to the plasma<br />
(probably due to the changed edge conditions) <strong>and</strong> the nickel<br />
influx from the antenna screen falls to zero. Nevertheless, the<br />
total nickel content as observed from the Ni XXV <strong>and</strong> Ni XXVI
72 TANGA et al.<br />
neXe<br />
(irfW-s 1 )<br />
0.5<br />
Normalized radius P MAX<br />
FIG. 6. nexcprofiles for SN, limiter <strong>and</strong> inner wall discharges, (a) OHphases, (b) dots for discharge<br />
of Fig. 4att = J3.8s, (c) for reference limiter dischare, (d) for reference discharge lying on the inner<br />
wall with NBI heaitng (#8899), with larger input power but lower energy content than (b).<br />
line intensities remains constant indicating substantially<br />
improved confinement of metals in the interior of the plasma.<br />
As indicated by the soft X-ray radiation profiles, however, this<br />
does not lead to accumulation of impurities.<br />
A preliminary analysis of transport properties comparing SN<br />
X-point with limiter <strong>and</strong> inner wall discharges has been done<br />
with the transport code Jetto [1], Using the transport models<br />
described in [5] good simulations of all the relevant measured<br />
quantities (ne, Te, radiation profiles, central ion temperature,<br />
Zeff) have been obtained in the ohmic phase of these three types<br />
of discharges. With additional heating, however, a degradation<br />
of the coefficient for the electron energy transport must be<br />
introduced for the inner wall <strong>and</strong> limiter case but not for the<br />
X-point discharge. The radial profiles of ng xe (Fig.6) show<br />
that these differences hold over the whole plasma<br />
cross-section.<br />
5. CONCLUSIONS<br />
Separatrix operation appears to induce substantial changes<br />
in the plasma behaviour compared to limiter operation. This is<br />
possibly a result of the high shear at the boundary of the<br />
plasma. Even with a modest separation of the X-point from the<br />
target plates, a high recycling regime has been observed in this<br />
region at high plasma densities. With additional heating the<br />
stored energy increases substantially above that for<br />
corresponding limiter discharges. A further increase in stored
<strong>IAEA</strong>-CN-47/A-I-5 73<br />
energy is observed for both 2MA <strong>and</strong> 3MA discharges leading to<br />
global energy confinement times in excess of 0.6s, about a<br />
factor of two higher than for the corresponding limiter<br />
discharges. These discharges also exhibit other signatures<br />
(e.g., reduced edge recycling) normally associated with<br />
H-modes.<br />
ACKNOWLEDGEMENTS<br />
The authors would like to acknowledge the effort of the<br />
whole JET team <strong>and</strong>, in particular,of the RF <strong>and</strong> NB Divisions.<br />
REFERENCES<br />
[1] TANGA, A., in Controlled Fusion <strong>and</strong> Plasma Physics (Proc. 12th Europ. Conf. Budapest,<br />
1985), Vol. 1, European Physical Society (1985) 70.<br />
[2] NEUHAUSER, J., WUNDERLICH, R., in Plasma-Surface Interactions in Controlled Fusion<br />
Devices (Proc. 7th Int. Conf. Princeton, NJ, 1986), to be published in J. Nucl. Mater.<br />
[3] WAGNER, F., et al., Phys. Rev. Lett. 49 (1982) 408; WAGNER, F., et al., in Plasma Physics<br />
<strong>and</strong> Controlled <strong>Nuclear</strong> Fusion Research 1982 (Proc. 9th Int. Conf. Baltimore, 1982), Vol. 1,<br />
<strong>IAEA</strong>, Vienna (1983) 43.<br />
[4] DtiCHS, D., et al., in Controlled Fusion <strong>and</strong> Plasma Physics (Proc. 12th Europ. Conf. Budapest,<br />
1985), Vol. 1, European Phsyical Society (1985) 22.<br />
DISCUSSION<br />
H.P. FURTH: Your results seem to me to be extremely significant as well as<br />
encouraging. One could say that you have shown that the quality of confinement in<br />
JET need not deteriorate at heating powers much higher than Ohmic, but this would<br />
be an understatement.<br />
A critical figure of merit for tokamaks is VH = Ptola/Iplasma. For Ohmic heating,<br />
VH is normally less than 1 V. For a practical tokamak reactor, VH must exceed<br />
50 V, <strong>and</strong> even for an ETR, VH must exceed ~ 10 V. Your demonstration that JET<br />
confinement is unimpaired for VH > 3 V is therefore a truly major step forward.<br />
A. TANGA: Thank you for the comment.
ENERGY CONFINEMENT AND<br />
PROFILE CONSISTENCY IN TFTR<br />
<strong>IAEA</strong>-CN-47/A-n-l<br />
R.J. GOLDSTON, V. ARUNASALAM, M.G. BELL, M. BITTER,<br />
W.R. BLANCHARD, N.L BRETZ, R. BUDNY, C.E. BUSH 1 , J.D. CALLEN 2 ,<br />
S.A. COHEN, S.K. COMBS 1 , S.L. DAVIS, D.L. DIMOCK, H.F. DYLLA,<br />
P.C. EFTHIMION, L.C. EMERSON 1 , A.C. ENGLAND 1 , H.P. EUBANK,<br />
R.J. FONCK, E. FREDRICKSON, H.P FURTH, G. GAMMEL, B. GREK,<br />
L.R. GRISHAM, G. HAMMETT, R.J., HAWRYLUK, W.W. HEIDBRINK 3 ,<br />
D.B. HEIFETZ, H.W. HENDEL 4 , K.W. HILL, E. HINNOV, S. HIROE 1 ,<br />
H. HSUAN, R.A. HULSE, K.P. JAEHNIG, D. JASSBY, F.C. JOBES,<br />
D.W. JOHNSON, L.C. JOHNSON, R. KAITA, R. KAMPERSCHROER,<br />
S.M. KAYE, S.J. KILPATRICK, R.J. KNIZE, H. KUGEL, P.H. LaMARCHE,<br />
B. LeBLANC, R. LITTLE, C.H. MA 1 , D.M. MANOS, D.K. MANSFIELD,<br />
R.T. McCANN, M.P. McCARTHY, D.C. McCUNE, K. McGUIRE,<br />
D.H. McNEILL, D.M. MEADE, S.S. MEDLEY, D.R. MIKKELSEN,<br />
S.L. MILORA 1 , W. MORRIS 5 , D. MUELLER, V. MUKHOVATOV 6 ,<br />
E.B. NIESCHMIDT 7 , J. O'ROURKE 8 , D.K. OWENS, H. PARK,<br />
N. POMPHREY, B. PRICHARD, A.T. RAMSEY, M.H. REDI,<br />
A.L. ROQUEMORE, P.H. RUTHERFORD, N.R. SAUTHOFF, G. SCHILLING,<br />
J. SCHIVELL, G.L. SCHMIDT, S.D. SCOTT, S. SESNIC, J.C. SINNIS,<br />
F.J. STAUFFER 9 , B.C. STRATTON, G.D. TAIT, G. TAYLOR,<br />
J.R. TIMBERLAKE, H.H. TOWNER, M. ULRICKSON, V. VERSHKOV 6 ,<br />
S. VON GOELER, F. WAGNER 10 , R. WIELAND, J.B. WILGEN 1 ,<br />
M. WILLIAMS, K.L. WONG, S. YOSHIKAWA, R. YOSHINO 11 ,<br />
K.M. YOUNG, M.C. ZARNSTORFF, V.S. ZAVERYAEV 6 , S.J. ZWEBEN<br />
Princeton Plasma Physics Laboratory,<br />
Princeton University,<br />
Princeton, New Jersey,<br />
United States of America<br />
1<br />
Oak Ridge National Laboratory, Oak Ridge, TN, USA.<br />
2<br />
University of Wisconsin, Madison, WI, USA.<br />
3<br />
GA Technologies Inc., San Diego, CA, USA.<br />
4<br />
RCA David Sarnoff Research Center, Princeton, NJ, USA.<br />
5<br />
Balliol College, University of Oxford, Oxford, UK.<br />
6<br />
Kurchatov Institute of Atomic Energy, Moscow, USSR.<br />
7<br />
EG&G Idaho, Inc., Idaho Falls, ID, USA.<br />
8<br />
JET Joint Undertaking, Abingdon, Oxfordshire, UK.<br />
9<br />
University of Maryl<strong>and</strong>, College Park, MD, USA.<br />
10<br />
Max-Planck-Institut fur Plasmaphysik, Garching, Fed. Rep. Germany.<br />
11<br />
JAERI, Naka-machi, Naka-gun, Ibaraki-ken, Japan.<br />
75
76 GOLDSTON et al.<br />
Abstract<br />
ENERGY CONFINEMENT AND PROFILE CONSISTENCY IN TFTR.<br />
A new regime of enhanced energy confinement has been observed on TFTR with neutral beam<br />
injection at low plasma current. It is characterized by extremely peaked electron density profiles <strong>and</strong><br />
broad electron temperature profiles. The electron temperature profile shapes violate the concept of profile<br />
consistency in which v is assumed to be a tightly constrained function of c^, but they are<br />
in good agreement with a form of profile consistency based on examining the temperature profile shape<br />
outside of the plasma core. The enhanced confinement regime is only obtained with a highly degassed<br />
limiter; in discharges with gas filled limiters corrective losses are calculated to dominate the edge electron<br />
power balance. Consistent with the constraint of profile consistency, global confinement is<br />
degraded in these cases. The best heating results in the enhanced confinement regime are obtained with<br />
nearly balanced co- <strong>and</strong> counter-injection. Much of the difference between balanced <strong>and</strong> co-only<br />
injection can be explained on the basis of classically predicted effects associated with plasma rotation.<br />
1. Introduction<br />
A new regime of enhanced energy confinement has been<br />
observed on TFTR with neutral beam injection at low plasma<br />
current. It is characterized by extremely peaked electron density<br />
profiles <strong>and</strong> broad electron temperature profiles. The best heating<br />
results in this regime are obtained with nearly balanced co <strong>and</strong><br />
counter injection. The properties of these discharges (referred<br />
to as "supershots") raise questions about some of the recently<br />
achieved underst<strong>and</strong>ing of tokamak auxiliary heating physics -<br />
electron temperature profile consistency, <strong>and</strong> the lack of<br />
importance of toroidal rotation, among others. In this paper we<br />
discuss the implications of our results in these areas. We begin<br />
(Sec. 2) by putting the electron stored energy results in this new<br />
regime into the context of previous scaling laws <strong>and</strong> TFTR data,<br />
showing that these discharges exhibit enhanced electron energy<br />
confinement as well as the high total stored energy <strong>and</strong> ion<br />
temperature discussed in [1]. Next (Sec. 3) we study the electron<br />
temperature profile shapes of these enhanced confinement<br />
discharges, in comparison with L-Mode <strong>and</strong> ohmically heated<br />
profiles on TFTR. In Section 4 we address issues connected with<br />
the electron density profile shape. In Section 5 we discuss the<br />
role of rotation <strong>and</strong> balanced versus unbalanced injection.<br />
2. Stored Electron Energy in Supershots<br />
Figure 1 shows the electron energy content from a series of<br />
scans of neutral beam power at I = 0.9, 1.4, <strong>and</strong> 2.2 MA, with the<br />
plasma resting on the inner-wall carbon limiter. The scans at<br />
higher current were performed without any special limiter<br />
degassing procedures. They show typical L-Mode behavior: the<br />
stored energy reaches equilibrium during the beam pulse, <strong>and</strong> broad<br />
density profiles are observed. The 0.9 MA data were taken after<br />
extensive degassing with low density He discharges [2]; they
0.8<br />
0.6<br />
= 0.4<br />
02<br />
o 0.9 MA Super<br />
* I.3MA Ip Ramp o °<br />
B °<br />
OD a<br />
<strong>IAEA</strong>-CN-47/A-O-1 77<br />
Ptot(MW)<br />
10 15<br />
2.2 MA<br />
FIG. 1. Electron stored energy versus total healing power for 2.2 MA <strong>and</strong> 1.4 MA L-mode discharges<br />
<strong>and</strong> for 0.9 MA enhanced confinement discharges. Also shown are enhanced confinement discharges<br />
at 1.3 MA achieved by ramping the plasma current up from 0.9 MA during the injection pulse. The<br />
curves represent 0.4 x w\ot, where w^m is the L-mode scaling predication [4] for total stored energy<br />
(see text).<br />
generally show rising stored energy throughout the beam pulse, <strong>and</strong><br />
at higher powers they exhibit strongly centrally peaked density<br />
profiles. Shots with severe MHD activity [3] which caused the<br />
stored energy <strong>and</strong> neutron flux to fall at the end of the pulse<br />
have been excluded from this data set. The higher current data<br />
sets have been constrained to 0.25 < p co /p ini < 0.75, while the<br />
0.9 MA data set has been constrained to 0.35 < p co /p ini < 0.65, in<br />
order to minimize the effects of unbalanced injection, which are<br />
greatest in the low-current region [1]. The current of 0.9 MA was<br />
selected because at lower plasma currents (I = 0.7-0.8 MA) high<br />
power operation is prevented by severe MHD activity <strong>and</strong><br />
disruptions, while the data set at higher currents (I = 1 - 1.1<br />
MA) <strong>and</strong> Pin, less than 10 MW is very limited. Up to 17 MW of<br />
neutral beam power has been injected into discharges with an<br />
initial plasma current of 0.9 MA, without inducing strong MHD<br />
oscillations or disruptions, by ramping the plasma current up to<br />
1.3 MA during the 0.5 sec beam pulse. Due to our present beam<br />
configuration, at these high powers p cc/ p in< > 0.70, which has<br />
been observed to result in significantly reduced heating compared<br />
to balanced injection at lower powers. Also plotted on this<br />
figure is the prediction of L-Mode scaling [4] (for H° ->• D +<br />
injection) where the prediction of the scaling law for electron<br />
energy has been taken to be 0.4 times the prediction for total<br />
stored energy, since this ratio is characteristic of high power<br />
TFTR results in the st<strong>and</strong>ard regime. While the higher current<br />
results approach the L-Mode prediction at high powers, the 0.9 MA
78 GOLDSTON et al.<br />
1.5<br />
2.5<br />
RADIUS (m)<br />
FIG. 2. Electron density <strong>and</strong> temperature profiles for a 1.0 MA enhanced confinement discharge (solid<br />
points) <strong>and</strong> for a 1.4 MA L-mode discharge (open points). For the enhanced confinement discharge:<br />
We = 0.52 MJ. For the Umode discharge: We = 0.47 MJ. PJPinj = 0.7 for both.<br />
supershot results clearly diverge from it. The stored electron<br />
energy of the 1.3 MA current-ramp supershots is remarkably close<br />
to the st<strong>and</strong>ard regime 2.2 MA data. The magnetically-measured<br />
total stored energies of enhanced confinement discharges show even<br />
more of a gain over st<strong>and</strong>ard L-Mode discharges. The total stored<br />
energy of 0.9 MA supershots equals that of 2.2 MA st<strong>and</strong>ard regime<br />
discharges at powers in the range of 11 MW. The fact that kinetic<br />
stored energy calculations agree well with the diamagnetic<br />
measurement results (± 5% in the 0.9 MA data set shown here)<br />
indicates that the thermal <strong>and</strong> beam ions gain in stored energy as<br />
expected due to the high electron temperatures <strong>and</strong> peaked density<br />
profiles provided by supershots.
10<br />
Te(o/2)<br />
<strong>IAEA</strong>-CN-47/A-H-1 79<br />
-i 1 F 1 1 1 r<br />
Te>l keV ool9MA Super<br />
a 1.3MA Ip Ramp<br />
j L J I I L<br />
0 0.5 r/a<br />
FIG. 3. Electron temperature profile shape normalized tor = a/2 for the data sets of Fig. 1. The factor<br />
of three is applied in order to centre the mid-radius on a single decade scale. The error bars represent<br />
the root mean square (RMS) variation of the data.<br />
3. Electron Temperature Profile Consistency<br />
Figure 2 shows an overlay of the Thomson scattering<br />
measurements of Tg(R) <strong>and</strong> ne(R) from a supershot with I s 1 HA,<br />
BT = 5T, <strong>and</strong> from a 1.4 MA discharge at the same toroidal field.<br />
Both discharges had a well-degassed limiter, but in the 1.4 MA<br />
case B nonetheless saturated after 0.3 sec into the beam pulse,<br />
<strong>and</strong> une density profile did not gain the peaked shape<br />
characteristic of the enhanced confinement mode. These results,<br />
<strong>and</strong> others like them, violate the concept of electron temperature<br />
profile consistency in which T (0)/ is taken as the measure<br />
of profile shape <strong>and</strong> is postulated to be a tightly-defined,<br />
monotonically rising function of q . This measure of profile<br />
shape is, however, already suspect as an indicator of microscopic<br />
transport mechanisms, since it can be largely enforced by sawtooth<br />
oscillations [4,5], if xe is sufficiently peaked to the outside of<br />
the discharge. On TFTR it has been previously observed [6] that<br />
the detailed electron temperature profile shape, outside of the<br />
core of the plasma <strong>and</strong> in the region where Tg > 1 keV, shows a<br />
remarkable constancy, independent of heating power - <strong>and</strong> most<br />
surprisingly - independent of qa. Figure 3 shows electron<br />
temperature profile shapes normalized at r = a/2 for the points<br />
with Ptot > 8 MW in the power scans of Fig. 1. The electron<br />
temperatures measured by Thomson scattering have been mapped to<br />
flux surfaces, <strong>and</strong> plotted as a function of midplane minor<br />
radius. The two-sided electron temperature measurement ensures<br />
that this process unambiguously corrects for the strong Shafranov<br />
shift observed in the low current, enhanced confinement regime.<br />
1.0
80 GOLDSTON et al.<br />
0.2 0.4<br />
RADIUS (m)<br />
0.6 0.8<br />
FIG. 4. Time evolution of TJr) from Thomson scattering, mapped to time dependent magnetic flux<br />
surfaces for 9.5 MW balanced injection into a 0.8 MA discharge, in enhanced confinement regime.<br />
Neutral beam injection heating from t = 4.0 s to 4.5 s.<br />
The error bars indicate the R.M.S. variation of the data. The 0.9<br />
MA supershot temperature profiles line up with the L-Mode profiles<br />
in the region outside of a/3. The few current ramp shots show an<br />
approximately 10$ higher Te(0.8a)/T (0.4a) than the others.<br />
Whether this is significant is difficult to say. Ohmic discharges<br />
at these same currents overlay well with this data, although in<br />
their case the selection for T > 1keV reduces the amount of data,<br />
available outside 0.7a. In general it is found here, as in the<br />
data of [6], that the temperature profiles tend to fall off more<br />
steeply in the region where Te < 1 keV. This suggests that<br />
processes such as impurity radiation, charge-exchange, <strong>and</strong><br />
convection, which are likely to be more important at the colder<br />
edge of the plasma, control Tg in this region <strong>and</strong> help set the<br />
amplitude for the overall electron temperature profile.<br />
While the mid-region temperature profiles are consistent<br />
with previous results in TFTR, the central region of the<br />
temperature profile in high-power enhanced confinement discharges<br />
is truncated in comparison with high-q ohmic target discharges (t<br />
= 4.45 sec versus t = 4.0 sec in Fig. 4), despite the absence of<br />
regular sawtooth oscillations during the heating phase [3]. One<br />
hypothesis to explain this effect is that the neutral beams<br />
provide a large source of cold electrons in the core region.<br />
Time-dependent transport analysis of balanced injection shots<br />
indicates that core region electron thermal convection losses
a><br />
i -5<br />
-in<br />
0<br />
- o £/<br />
a<br />
" r/a = 5/6<br />
<strong>IAEA</strong>-CN-47/A-n-l 81<br />
i<br />
o<br />
D<br />
X<br />
X<br />
x x<br />
x a *<br />
1 1<br />
{ x 10 19 m" 3 Laid udtd sm [lave u_ ~ H . t<br />
current ramp shots both have<br />
, while the 0.9 MA<br />
supershots have n » 2.7 x<br />
The lower line average<br />
-<br />
-<br />
-
82 GOLDSTON et al.<br />
density of the supershots is therefore not adequate to explain<br />
their steeper edge gradients. This suggests that the reduced<br />
recycling coefficient of the degassed limiters, coupled with deep<br />
beam fueling, permits a low edge density <strong>and</strong> less convective<br />
losses in the enhanced confinement regime, giving rise to a hotter<br />
edge. Absolute Da measurements, coupled with neutral modeling<br />
calculation, indicate T of the order of 30 msec for the gasfilled<br />
limiter case shown in Figure 4 of [1], <strong>and</strong> dTg/dr at 5a/6<br />
in that case is only 3.5 keV/m. Transport analysis of this<br />
discharge indicates that at the edge of the plasma convective<br />
losses dominate conduction in the electron power balance (as in<br />
high recycling conditions in D-III [7]), explaining the low edge<br />
electron temperature <strong>and</strong>, through the constraint of profile<br />
consistency, perhaps the overall reduction in confinement.<br />
4. The Electron Density Profile<br />
The peaked density profiles observed in the enhanced<br />
confinement regime appear to be the result of a beam build-up<br />
instability [8]. In the discharge illustrated in figure 4, at 0.1<br />
sec into the beam pulse transport analysis calculations indicate<br />
that nb(0)/ne(0) ~ 0.4, <strong>and</strong> the beam density is strongly peaked on<br />
axis, contributing most of the core density gradient. As the beam<br />
ions slow down the background density builds up, <strong>and</strong> at the end of<br />
the beam pulse nb(0)/ne(0) has dropped to ~ 0.2. The central<br />
electron density rises at about 7055 of the beam fueling rate for<br />
the first 0.3 sec of injection, <strong>and</strong> later rises at 20-30? of the<br />
source rate. The importance of central beam deposition to this<br />
build-up process may explain the sensitivity of the supershot mode<br />
to plasma current. The minimum attainable initial target density<br />
in cases with a well-degassed limiter is observed to be<br />
proportional to ID in the range of 0.8-1.2 MA, <strong>and</strong> the<br />
Shafranov shift drops rapidly as a function of current, so that<br />
/ndl between the edge <strong>and</strong> the plasma core increases strongly with<br />
I . The shift may be especially important, because the tightly<br />
compressed outer flux surfaces present a thin target to neutral<br />
beam injection, <strong>and</strong> particles deposited in that region are<br />
distributed around the volume of the flux surface, which is<br />
largely hidden from the beam by the plasma core. Spectroscopic<br />
measurements also indicate higher carbon influx rates at higher<br />
currents. This further helps to explain the absence of peaked<br />
density profiles <strong>and</strong> supershot behavior at high current. L-Mode<br />
<strong>and</strong> ohmically heated plasmas generally have more peaked density<br />
profiles at q >5 as well, suggesting an increased susceptibility<br />
to this process at high qa.<br />
There are a number of ways in which a peaked density profile<br />
can mediate improved confinement. One natural hypothesis is that<br />
the peaked profiles reduce r\- <strong>and</strong>/or TI6 which could be important<br />
factors in the instabilities which drive transport<br />
(rii e s dmTj /dinn, ). n< has not been measured on TFTR, but<br />
n. 'can be calculated' from the Thomson scattering data. In the
<strong>IAEA</strong>-CN-47/A-II-l 83<br />
region inside 0.4a ne is significantly lower in supershots than in<br />
st<strong>and</strong>ard discharges, dropping at high powers from values in the<br />
range of 1.7 at 0.4a for st<strong>and</strong>ard discharges to 1.2 in the<br />
enhanced confinement mode. An alternative hypothesis discussed in<br />
section 3 above, is that high edge electron temperatures, in the<br />
presence of reduced recycling <strong>and</strong> low edge densities, may result<br />
in relatively low values for edge transport coefficients as in the<br />
H-mode. In the presence of even constant edge transport<br />
coefficients, electron temperature profile consistency arguments<br />
which take into consideration the presence of a centrally peaked<br />
density profile, but assume that the edge electron thermal<br />
diffusivity responds only to the local ng, predict a significant<br />
improvement in W [9].<br />
5. Balanced vs. Unbalanced Injection <strong>and</strong> Plasma Rotation<br />
As indicated in [1], the stored energy in supershot plasmas<br />
shows a considerable improvement as the beam powers in the co <strong>and</strong><br />
counter directions are brought into balance. Because of the<br />
present configuration of TFTR (3 co-beamlines <strong>and</strong> 1 counterbeamline<br />
for the usual direction of I ) we have not obtained high<br />
power data with pure counter-injection <strong>and</strong> a well-degassed<br />
limiter. At low currents (600-800 kA), however, enhanced<br />
confinement discharges with favorable time evolution <strong>and</strong> highly<br />
peaked density profiles can be obtained with only 5 MW of balanced<br />
injection power, <strong>and</strong> the full spectrum of p Cr/ p in-j can °e<br />
explored. We find that the density increase at fixed injection<br />
power drops with rising Pco/Pin ^, but the peakedness of the<br />
density profile falls off as one moves away from balanced<br />
injection in either direction. Stored energy <strong>and</strong> especially<br />
neutron Droduction fall off as well. Plasma rotation speeds of »<br />
8 x 10 5 m/sec have been measured in co-injected discharges,<br />
corresponding to a Mach number of * 0.7. Rotation speeds with<br />
counter-injection are lower than with co-injection at the same<br />
power.<br />
A number of classically expected factors may lead to reduced<br />
density peaking <strong>and</strong> poorer heating efficiency at high rotation<br />
speeds with unidirectional injection [10]. In the rotating plasma<br />
frame the beam ions, <strong>and</strong> especially the fractional energy<br />
component beam ions (which constitute about one half of the total<br />
beam), have considerably reduced energy. This results in larger<br />
atomic cross-sections for beam deposition <strong>and</strong> a larger fraction of<br />
the deposition on hydrogenic species in the form of chargeexchange<br />
rather than impact ionization. Because of the lower beam<br />
ion velocity in the plasma frame, the beam ion slowing down time<br />
<strong>and</strong> therefore the beam ion density is substantially reduced. In<br />
an extreme example (13 MW of co-injection at I = 0.9 MA with<br />
v^O) = 7.5 x 10^ m/sec) taking these effects into account in<br />
somewhat simplified calculations results in a 30$ reduction of<br />
central electron source rate. The central beam ion density at the<br />
end of injection is reduced by a factor of 3. If the presence of
84 GOLDSTON et al.<br />
a central peak of circulating beam ions is important for<br />
establishing a sharp electron density profile, it is reasonable to<br />
expect that this sharpness will be reduced in a rapidly rotating<br />
plasma. At the high Mach numbers we have observed, one expects<br />
significant centrifuging of plasma density, <strong>and</strong> especially of<br />
impurity density, to the large major radius side of the plasma.<br />
Thomson scattering measurements show a definite trend in this<br />
direction, correlated with unbalanced injection. Detailed scaling<br />
studies have not been made, but effects of the magnitude expected<br />
are observed. This centrifuge effect should tend to reduce beam<br />
penetration to the center of the plasma. To determine whether<br />
these classically expected effects of rotation are enough to<br />
explain the differences in the density profiles we observe,<br />
without additional changes in central particle diffusivity, will<br />
require more detailed calculations <strong>and</strong> examination of the data.<br />
The increased density rise in counter-injected discharges almost<br />
certainly also plays a role in the broad density profiles observed<br />
in the more slowly rotating counter-injected plasmas.<br />
Lower beam velocity in the plasma frame results in a strong<br />
reduction in the beam-target <strong>and</strong> beam-beam fusion neutron yield;<br />
unidirectional injection reduces beam-beam neutron production as<br />
well. In the example above the effects of plasma rotation reduce<br />
the calculated neutron flux by a factor of 2, <strong>and</strong> good agreement<br />
is obtained with the measurement. The importance of plasma<br />
rotation for neutron production is most clearly illustrated by the<br />
rapid rise in neutron production observed when a low-current<br />
plasma is first heated with 5 MW of co-only injection, <strong>and</strong> then<br />
the co beams are switched off <strong>and</strong> 5 MW of counter beams turned<br />
on. The neutron emission rises by a factor of 2 in 50 msec.<br />
With unbalanced injection a substantial fraction of the beam<br />
power is invested in applying torque to the rotating plasma. Much<br />
of this power -is expected to be returned to the bulk ions via<br />
viscous damping mechanisms in the region where the gradients in<br />
rotation speed are high, probably close to the plasma surface. In<br />
this region ion thermal losses through convection <strong>and</strong> chargeexchange<br />
are large however. Rotational energy may also be<br />
partially lost from the plasma via the same mechanisms. In the<br />
example discussed above, this process, plus the reduction in beam<br />
penetration, results in a 50$ reduction of central heating power,<br />
<strong>and</strong> an overall HQ% investment of beam heating power in driving<br />
rotation. If the power is not coupled back to the plasma, the<br />
lower total stored energy observed with co-only injection [1] is<br />
reasonably well explained. Central ion temperature measurements<br />
in co-only cases are also reduced compared to balanced injection<br />
with similar parameters, consistent with the calculated reduced<br />
central input power to the ions. Rotational energy is probably<br />
coupled back into the bulk thermal plasma with some efficiency,<br />
<strong>and</strong> it is thus a mix of this mechanism <strong>and</strong> the broader density<br />
profiles observed with co-only injection which together result in<br />
reduced stored energy.
6. Conclusions<br />
<strong>IAEA</strong>-CN-47/A-II-l 85<br />
A new mode of enhanced energy confinement has been observed<br />
on TFTR. It exhibits improved electron stored energy, as well as<br />
improved thermal <strong>and</strong> beam ion stored energy. The broad electron<br />
temperature profile shapes observed in this regime at high qa do<br />
not support a concept of profile consistency based on the<br />
assumption that Te(0)/v = f(qa), but do fit with a model based<br />
on examining normalized profile snapes outside of the plasma core,<br />
independent of qa [6, 11]. The observation that increased<br />
recycling results in a convection-dominated edge electron power<br />
balance, which then correlates with reduced overall confinement,<br />
fits well with an underst<strong>and</strong>ing of this regime based on profile<br />
consistency arguments [9]. On the other h<strong>and</strong> it is also a<br />
reasonable hypothesis that the reduction of ne <strong>and</strong>/or r^ in the<br />
core region plays an important role.<br />
The peaked density profiles observed in this regime appear<br />
to be due to a beam build-up process which results in highly<br />
centralized beam deposition. Density profiles are most peaked with<br />
near-balanced injection, <strong>and</strong> some classically expected mechanisms<br />
have been put forward to explain this, but it is not clear whether<br />
other effects are required. Neutron production <strong>and</strong> beam heating<br />
efficiency are also highest with near-balanced injection.<br />
Classical calculations including plasma rotation are adequate to<br />
explain the difference in neutron production rate with co-only <strong>and</strong><br />
balanced injection, given the differences in plasma profiles. The<br />
fractional power delivered to the plasma in the form of torque on<br />
a rotating body is comparable to the fractional difference in<br />
stored energy between co-only <strong>and</strong> balanced injection. Some of<br />
this power, however, is probably re-invested in ion heating near<br />
the outside in minor radius. The combination of the resulting<br />
reduction in heating efficiency <strong>and</strong> the broader density profiles<br />
observed with unbalanced injection together explain the importance<br />
of balanced injection for obtaining the best results in the TFTR<br />
"supershot" regime.<br />
ACKNOWLEDGMENTS<br />
We are grateful to D.J. Grove <strong>and</strong> J.R. Thompson for their<br />
advice <strong>and</strong> support, <strong>and</strong> to J. Strachan for his many contributions.<br />
This work was supported by US DOE Contract No. DE-ACO2-76-<br />
CHO3O73. The ORNL participants were also supported by U.S.<br />
Department of Energy Contract No. DE-AC05-8H0R21400 with Martin<br />
Marietta Energy Systems, Inc.<br />
REFERENCES<br />
[1] HAWRYLUK, R.J., et al., Paper <strong>IAEA</strong>-CN-47/A-I-3, these Proceedings, Vol. 1.<br />
[2] HILL, K.W., et al., Paper <strong>IAEA</strong>-CN-47/A-IV-2, these Proceedings, Vol. 1.<br />
[3] McGUIRE, K., et al., Paper <strong>IAEA</strong>-CN-47/A-VII-4, these Proceedings, Vol. 1.
86 GOLDSTON et al.<br />
[4] GOLDSTON, R.J., Plasma Phys. Control. Fusion 26 (1984) 87.<br />
[5] WALTZ, R.E., Comments on Profile Consistency, Rep. GAT-A 18365, Goodyear Atomic<br />
Corp., Portsmouth, OH.<br />
[6] FREDRICKSON, E., et al., in Controlled Fusion <strong>and</strong> Plasma Heating (Proc. 13th Europ. Conf.<br />
Schliersee, 1986), Vol. 1, European Physical Society (1986) 148.<br />
[7] NAGAMI, M., et al., Nucl. Fusion 24 (1984) 183.<br />
[8] POST, D.E., private communication, 1978.<br />
[9] FURTH, H.P., Plasma Phys. Controll. Fusion 28 (1986) 1305.<br />
[10] GOLDSTON, R.J., in Basic Physical Processes of Toroidal Fusion Plasmas (Proc. Course <strong>and</strong><br />
Workshop Varenna, 1985), Vol. 1, EUR-10418-EN, CEC, Brussels (1986) 165*.<br />
[11] MURMANN, H.D., et al., in Controlled Fusion <strong>and</strong> Plasma Heating (Proc. 13th Europ. Conf.<br />
Schliersee, 1986), Vol. 1, European Physical Society (1986) 216.<br />
DISCUSSION<br />
A. BHATTACHARJEE: I have a comment <strong>and</strong> a question. In the presence of<br />
toroidal rotation, the density on any given flux surface becomes poloidally asymmetric.<br />
This, as you know, was observed in PDX. However, the magnitude of toroidal<br />
rotation necessary to explain the asymmetry experimentally observed was found to<br />
be greater than the rotation actually observed, for example, by S. Semenzato et al.<br />
at the Centre de recherches en physique de plasmas, Lausanne. It appears that the<br />
same could be said of TFTR.<br />
My question is: why is it that the rotation velocity observed is different for coinjection<br />
<strong>and</strong> counter-injection when the beam power is held fixed?<br />
R.J. GOLDSTON: On TFTR, as on PDX, we do see some in-out asymmetry<br />
in the Thomson scattering density profiles, even in Ohmic plasmas. We have found,<br />
however, that there is a systematic further asymmetry which correlates with<br />
unbalanced injection. The degree of this further asymmetry is roughly in agreement<br />
with what would be theoretically expected, but we have not yet carried out detailed<br />
scaling studies on the asymmetry.<br />
Counter-injection does indeed drive less central rotation speed than coinjection,<br />
for fixed power, but the density is higher. We have not yet measured the<br />
radial profile of the rotation, so I am hesitant to suggest an explanation.<br />
B. COPPI: I should just like to comment that the lack of dependence of<br />
Te(0)/Tav on q^ when q(r = 0) > 1 was in fact pointed out in the original formulation<br />
for the principle of profile consistency. Therefore, the observations you<br />
: The last term in Eq. (26) of this reference should read:<br />
2 +<br />
Em. ^_ [
<strong>IAEA</strong>-CN-47/A-H-1 87<br />
reported do not require a reformulation of this principle. In addition, the temperature<br />
profile may deviate considerably from a Gaussian, depending on a variety of factors,<br />
for example, the presence of trapped electrons, under the same formulation.<br />
R.J. GOLDSTON: Thank you for the comment.<br />
A. GIBSON: Now that you have the concept of profile consistency with so<br />
many 'ifs' <strong>and</strong> 'buts' <strong>and</strong> restricted it to such a special region of the profile, do you<br />
still believe it has any physical significance, <strong>and</strong> if so what is it?<br />
R.J. GOLDSTON: Researchers have frequently divided the tokamak into three<br />
zones — a central sawtoothing zone, a middle 'confinement' zone, <strong>and</strong> an edge zone<br />
dominated by convection <strong>and</strong> atomic physics. The refinement we proposed at the 13th<br />
European Conference in 1986 <strong>and</strong> which we are discussing here is that the resiliency<br />
of the profile applies mostly in the middle 'confinement' zone. Lower hybrid heating<br />
experiments certainly show that the presence or absence of sawteeth can strongly<br />
attack the core zone, <strong>and</strong> the H-mode is an example of how the edge can be modified.<br />
The fact that modifications of the edge region can have profound effects on core<br />
transport strongly suggests a transport mechanism which resists profile shape<br />
changes. One example would be a model which includes vTe or d lnTe/dr in the<br />
electron thermal diffusivity itself.
ENERGY AND PARTICLE CONFINEMENT<br />
OF JT-60 PLASMAS<br />
WITH HIGH POWER HEATING<br />
<strong>IAEA</strong>-CN-47/A-II-2<br />
JT-60 TEAM<br />
(Presented by M. Nagami)<br />
T. Abe, H. Aikawa, H. Akaoka, H. Akasaka, M. Akiba, N. Akino, T. Akiyama,<br />
T. Ando, K. Annoh, N. Aoyagi, K. Arakawa, M. Araki, K. Arimoto, M. Azumi,<br />
S. Chiba, M. Dairaku, N. Ebiswa, T. Fujii, T. Fukuda, H. Furukawa,<br />
K. Hamamatsu, K. Hayashi, M. Hara, K. Haraguchi, H. Hiratsuka, T. Hirayama,<br />
S. Hiroki, K. Hiruta, M. Honda, H. Horiike, R. Hosoda, N. Hosogane, Y. Iida,<br />
T. Iijima, K. Ikeda, Y. Ikeda, T. Imai, T. Inoue, N. Isaji, M. Isaka, S. Ishida,<br />
N. Itige, T. Ito, Y. Ito, A. Kaminaga, M. Kawai, Y. Kawamata, K. Kawasaki,<br />
K. Kikuchi, M. Kikuchi, H. Kimura, T. Kimura, H. Kishimoto, K. Kitahara,<br />
S. Kitamura, A. Kitsunezaki, K. Kiyono, N. Kobayashi, K. Kodama, Y. Koide,<br />
T. Koike, M. Komata, I. Kondo, S. Konoshima, H. Kubo, S. Kunieda,<br />
S. Kurakata, K. Kurihara, M. Kuriyama, T. Kuroda, M. Kusaka, Y. Kusama,<br />
S. Maehara, K. Maeno, S. Mase, S. Matsuda, M. Matsukawa, T. Matsukawa,<br />
M. Matsuoka, N. Miya, K. Miyati, Y. Miyo, K. Mizuhashi, M. Mizuno, R. Murai,<br />
Y. Murakami, M. Muto, M. Nagami, A. Nagashima, K. Nagashima,<br />
T. Nagashima, S. Nagaya, H. Nakamura, Y. Nakamura, M. Nemoto, Y. Neyatani,<br />
S. Niikura, H. Ninomiya, T. Nishitani, H. Nomata, K. Obara, N. Ogiwara,<br />
Y. Ohara, K. Ohasa, T. Ohga, H. Ohhara, M. Ohkubo, T. Ohshima, K. Ohta,<br />
M. Ohta, M. Ohtaka, Y. Ohuchi, A. Oikawa, H. Okumura, Y. Okumura,<br />
K. Omori, S. Omori, Y. Omori, T. Ozeki, M. Saigusa, K. Sakamoto, A. Sakasai,<br />
S. Sakata, M. Satou, M. Sawahata, M. Seimiya, M. Seki, S. Seki, K. Shibanuma,<br />
R. Shimada, K. Shimizu, M. Shimizu, Y. Shimomura, S. Shinozaki, H. Shirai,<br />
H. Shirakata, M. Shitomi, K. Suganuma, T. Sugie, T. Sugiyama, H. Sunaoshi,<br />
K. Suzuki, M. Suzuki, M. Suzuki, N. Suzuki, S. Suzuki, Y. Suzuki,<br />
H. Takahashi 1 , M. Takahashi, S. Takahashi, T. Takahashi, M. Takasaki,<br />
M. Takatsu, A. Takeshita, H. Takeuchi, S. Tamura, S. Tanaka, K. Tani,<br />
M. Terakado, T. Terakado, K. Tobita, T. Tokutake, T. Totsuka, N. Toyoshima,<br />
H. Tsuda, T. Tsugita, S. Tsuji, Y. Tsukahara, M. Tsuneoka, K. Uehara,<br />
M. Umehara, Y. Uramoto, H. Usami, K. Ushigusa, K. Usui, J. Yagyu,<br />
K. Yamada, M. Yamamoto, O. Yamashita, Y. Yamashita, K. Yano, T. Yasukawa,<br />
K. Yokokura, H. Yokomizo, H. Yoshida, M. Yoshikawa, Y. Yoshinari,<br />
R. Yoshino, I. Yonekawa, K. Watanabe<br />
Naka Fusion Energy Research Establishment,<br />
Japan Atomic Energy Research Institute,<br />
Naka-machi, Naka-gun, Ibaraki-ken,<br />
Japan<br />
1 Princeton Plasma Physics Laboratory, Princeton University, NJ, USA.<br />
89
90 JT-60 TEAM<br />
Abstract<br />
ENERGY AND PARTICLE CONFINEMENT OF JT-60 PLASMAS WITH HIGH POWER<br />
HEATING.<br />
Results are reported from initial confinement experiments of divertor <strong>and</strong> limiter plasmas, carrying<br />
a current of up to 2 MA <strong>and</strong> heated by neutral beam power up to 20 MW, over a wide range of<br />
densities (0.3-8) x 10 19 m~ 3 , <strong>and</strong> toroidal fields, 1.9-4.5 T. Preliminary experiments on the concurrent<br />
application of NB heating <strong>and</strong> ICRF or LHCD are also described. The plasma stored energy has<br />
an offset linear relation with the absorbed power, <strong>and</strong> the energy confinement time (in seconds) scales<br />
as (0.051 + 0.35/Pabs [MW]) X I [MA] 04 . The energy <strong>and</strong> particle confinement times have a similar<br />
dependence on the absorbed power. Improved particle <strong>and</strong> energy confinement is discussed for NB,<br />
NB + ICRF, <strong>and</strong> NB + LHCD discharges.<br />
1. INTRODUCTION<br />
This paper discusses confinement results from the initial auxiliary heating<br />
experiments. A companion paper [1] provides a review of the JT-60 programme <strong>and</strong><br />
its experiments. Another companion paper [2] describes impurity <strong>and</strong> MHD effects.<br />
The additional heating <strong>and</strong> current drive programme started in early August, using<br />
either NB heating, ICRF second harmonic (120 MHz) heating or LHCD (2 GHz).<br />
The injected NB power (Pinj) was raised to 20 MW, the ICRF power to 1.4 MW <strong>and</strong><br />
the LHCD power to 1 MW, within two to three months from the start of the<br />
experiments.<br />
The particle confinement <strong>and</strong> the energy confinement of NB heated normal discharges<br />
are discussed in Sections 2 <strong>and</strong> 3, respectively. The regimes of improved<br />
confinement are described in Section 4. Conclusions are presented in Section 5.<br />
2. PARTICLE CONFINEMENT<br />
The line integrated Ua emission intensity was measured along a chord in the<br />
poloidal plane at four different locations each in the main <strong>and</strong> divertor chambers.<br />
Figure 1 shows the time evolution of ne <strong>and</strong> four channel Ho signals for an 8 MW<br />
NB heating divertor discharge. With NB injection the main plasma density started<br />
to decrease, <strong>and</strong> the Ha intensity in the divertor chamber increased by a factor of<br />
5 to 20 from its Ohmic level while the intensity only rose by a factor of two to three<br />
in the main chamber. This suggests an enhanced scrape-off plasma flow from the<br />
main chamber into the divertor chamber during NB injection.<br />
On the assumption of toroidal symmetry, the global particle confinement time<br />
T can be determined from an absolute intensity measurement of the Ha emission at<br />
one toroidal location. This assumption is believed to be valid for divertor discharges.<br />
For Ohmic discharges, rp was found to be proportional to n^ 7 <strong>and</strong> was 70 ms at<br />
ne = 3 x 10 19 m- 3 (Fig. 2(a)). The rp degraded with increasing Pinj, <strong>and</strong>, at 20 MW,<br />
was lower than its Ohmic values by a factor of three.
<strong>IAEA</strong>-CN-47/A-II-2 91<br />
o<br />
C4<br />
•E<br />
_ca.<br />
at<br />
"O<br />
o<br />
5.0<br />
0.0<br />
0.5<br />
0.0<br />
0.5<br />
0.0<br />
5.0<br />
0.0<br />
20.0<br />
0.0<br />
3.0 5.0<br />
Time (s)<br />
7.0<br />
FIG. 1. Evolution ofne <strong>and</strong> four channel Ha signals for NB heated divertor discharge.<br />
The hydrogen neutral pressures measured in the main <strong>and</strong> divertor chambers are<br />
plotted against ne_in Fig. 2(b) for Ohmic <strong>and</strong> NB heated discharges. The pressure<br />
ratio, Pdiv/Pmain, which is sometimes regarded as an indicator of efficient divertor<br />
function, was 30 to 40 for Ohmic discharges, but increased up to 40 to 60 for discharges<br />
heated with 10 to 20 MW of NB power. The measured Pdiv was proportional<br />
to n^. This dependence, together with the experimentally determined ne<br />
dependence of rp, leads to a conductance of the neutral particle backflow from the<br />
divertor to the main chamber which is nearly independent of ne. The conductance,<br />
consistent with the measured Pdiv <strong>and</strong> rp, was about 900 m 3 -s"' <strong>and</strong> was one-half to<br />
one-third of the calculated mechanical conductance. This difference appears reasonable<br />
when the presence of the scrape-off plasma that obstructs the backflow is taken<br />
into account. For a constant backflow conductance, the normalized divertor pressure,<br />
Pdiv = Pdiv/n£, is inversely proportional to rp. The dependence on the absorbed<br />
power (Pabs) (sum of Ohmic <strong>and</strong> injected beam power minus shinethrough loss) of<br />
J/Pdiv was similar to that of the energy confinement time (Fig. 2(c)). This resemblance<br />
suggests a correlation between the increased scrape-off plasma flow <strong>and</strong> the<br />
degradation of energy confinement.<br />
10.0<br />
0.0<br />
Q_
92<br />
JH d<br />
JT-60TEAM<br />
s<br />
zX<br />
o<br />
i Q.<br />
o<br />
o a<br />
q<br />
•<br />
in<br />
4<br />
<<br />
O<br />
C«J<br />
D<br />
O<br />
a<br />
a<br />
D<br />
a<br />
a<br />
•<br />
a •<br />
o<br />
4<br />
a<br />
m<br />
U<br />
"i<br />
o o o o o o o<br />
^ N O ffl (0 ^ N<br />
m<br />
•4<br />
I<br />
8" 3"<br />
go<br />
1<br />
(MJ)<br />
W<br />
Ip(MA)<br />
2.0<br />
1.5<br />
1.0<br />
<strong>IAEA</strong>-CN-47/A-n-2 93<br />
D<br />
n<br />
A<br />
0<br />
L<br />
•<br />
•<br />
1 2<br />
(0.051 Pabs(MW) +0.35) Ip(MA) 04<br />
FIG. 3. Plot of W against (0.05 IP^ [MW] + 0.35) I [MA] 0 - 4 .<br />
3. ENERGY CONFINEMENT<br />
Hydrogen neutral beam power of up to 20 MW at energies of 50 to 75 keV,<br />
was injected into hydrogen or helium plasmas. The fraction of hydrogen in the (nominally)<br />
helium plasmas was estimated to be up to one-half, from Ha emission intensity,<br />
beam shinethrough loss <strong>and</strong> neutral hydrogen flux measurements.<br />
In divertor discharges roughly 80% of the absorbed power can be accounted<br />
for. Energy balance in the divertor chamber is accomplished through a bolometer<br />
array used to measure the radiation loss <strong>and</strong> a thermocouple array utilized to measure<br />
the divertor plate heat flux. The measurement showed that the divertor chamber radiation<br />
accounted for about 20%, the divertor plate heat deposition for about 50% <strong>and</strong><br />
the main chamber radiation for less than 10% of the absorbed power.<br />
3.1. Energy confinement scaling<br />
The plasma stored energy was evaluated by both kinetic <strong>and</strong> magnetic means.<br />
The kinetic determination of the stored energy was based on a six point Thomson<br />
scattering profile of the electron temperature <strong>and</strong> the spectroscopically determined<br />
central ion temperature. When the calculated fast ion energy was added to the kinetically<br />
determined stored energy, the sum agreed with the magnetically determined<br />
stored energy (W*) within 20%.<br />
The value of T*E = W7Pabs was the same for hydrogen <strong>and</strong> (nominally) helium<br />
discharges <strong>and</strong> did not depend on the density. A toroidal field (Bt) scan from 1.9 to<br />
4.4T at Ip = IMA did not yield any obvious dependence of T*E on Bt, or on qeff,
94 JT-60 TEAM<br />
1.3<br />
Hero)<br />
1.0<br />
1.0<br />
D<br />
(rrfc)<br />
0.5<br />
-<br />
^eff<br />
DIVERTOR. Hi<br />
n,= 4.5-5x10<br />
O<br />
o<br />
o<br />
0<br />
o<br />
o<br />
o<br />
o<br />
4 -<br />
3<br />
2<br />
1<br />
i<br />
10 15<br />
Pabs (MW)<br />
o<br />
o<br />
Xe(-§-a) (rr Vs)<br />
7«-,Ip=l.5MA<br />
OH •<br />
• •<br />
1<br />
0°<br />
o °<br />
o o<br />
oo<br />
(c)<br />
•<br />
•<br />
•<br />
•<br />
•<br />
(b) -<br />
... i<br />
5 10 15<br />
Pob, (MW)<br />
FIG. 4. (a) Plot of Te(0)/(Te) <strong>and</strong> rs/a against llqegfor ohmically heated divertor <strong>and</strong> limiter<br />
discharges, <strong>and</strong> NB heated divertor <strong>and</strong> limiter discharges; (b) plot of electron thermal diffusivity, Xe,<br />
at r = 2a/3 against Paij; (c) plot of ne(0)/ne <strong>and</strong> particle diffusivity (D) against Pabs.<br />
20<br />
20
<strong>IAEA</strong>-CN-47/A-II-2 95<br />
which varied from 2.2 to 6. Under similar conditions, the W* of the limiter discharges<br />
was about the same as that of the divertor discharges. The discharges can<br />
be represented by an offset linear relation, r* [s] = (0.051 + 0.35/Pabs [MW])/Ip<br />
[MA] 0 - 4 , which results in an increased confinement time of 50 to 70 ms for<br />
Ip = 1 to 2MA (Fig. 3). This relation has a weaker Ip dependence than the<br />
Kaye-Goldston scaling.<br />
3.2. Energy transport analysis<br />
The ratio of the central to the volume averaged electron temperature,<br />
Te(0)/, <strong>and</strong> the ratio of the sawtooth inversion radius to the minor radius, rs/a,<br />
are plotted against l/qeff in Fig. 4(a). These ratios varied little between Ohmic <strong>and</strong><br />
NB heated discharges, or between divertor <strong>and</strong> limiter discharges. This fact may be<br />
an indication that the electron temperature profile <strong>and</strong> the current profile in the core<br />
region did not vary substantially.<br />
The energy transfer from the fast ions to the plasma electrons <strong>and</strong> ions was estimated<br />
as a function of the magnetic surface co-ordinate using Monte Carlo beam<br />
deposition <strong>and</strong> fast ion orbit/slow-down calculations. The main ion energy loss channel<br />
was the energy transfer to the electrons, <strong>and</strong> the ion heat conduction played a<br />
minor role in the ion energy balance.<br />
The electron heat conduction dominated the energy confinement in the plasma<br />
core. The electron thermal diffusivity (Xe) at r/a = 2/3, calculated by the transport<br />
analysis assuming that X: is three times the Chang-Hinton value, was 1-2 irf-S" 1 for<br />
Ohmic discharges <strong>and</strong> increased by a factor of three to five for discharges heated with<br />
20 MW of NB power (Fig. 4(b)). The ratio of the central to the line averaged density,<br />
ne(0)/ne, is plotted against Pabs in Fig. 4(c). This ratio, which is around 1.2, indicates<br />
a very flat density profile, nearly independent of the NB power. The particle<br />
diffusivity (D) at r = 2a/3, deduced from NB particle fuelling <strong>and</strong> density profile<br />
evolution, increased with the increase of absorbed power. The convective energy<br />
flow made a contribution of approximately 20% in the plasma core, <strong>and</strong> was estimated<br />
to be comparable to the conduction loss in the peripheral regions.<br />
4. IMPROVED PARTICLE AND ENERGY CONFINEMENT DISCHARGES<br />
There were three different sets of conditions in which an improvement in either<br />
particle or energy confinement was observed.<br />
The first set of conditions was found during an effort made to produce an<br />
environment which was considered conducive to the H-mode, based upon the<br />
experience from medium sized devices: increasing Pinj to 20 MW, lowering Bt to<br />
1.9 T, <strong>and</strong> qeff to 2.2, maintaining a large separatrix-limiter distance up to 5 cm,<br />
maximizing the volume averaged power density by reducing the plasma volume
96<br />
m<br />
MW) d (VW) "l<br />
^ o a><br />
d<br />
JT-60TEAM<br />
3<br />
CO ,-<br />
6<br />
7<br />
§<br />
o o<br />
00<br />
6.6<br />
•H<br />
c « S<br />
s S c<br />
111<br />
|j|<br />
V<br />
it* I<br />
1 §<br />
I<br />
5
<strong>IAEA</strong>-CN-47/A-II-2 91<br />
(14 MW/31 m 3 ), the use of helium instead of hydrogen, fuelling through the divertor<br />
chamber, etc. These efforts produced no clear, reproducible H-mode discharges.<br />
The example shown in Fig. 5(a) possessed, however, most of the characteristics commonly<br />
associated with the H-mode. The discharge was a small minor radius<br />
(0.71 m) plasma heated with Pinj = 18 MW (Pabs = 14 MW) <strong>and</strong> showed an abrupt<br />
reduction of the Htt emission in the divertor chamber (at 0.37 s into the beam<br />
heating phase) <strong>and</strong> a simultaneous increase in ne from 1.6 to 2 X 10 19 nr 3 , in A/3p<br />
by 20 %, <strong>and</strong> in the radiative power from 1.4 to 4.8 MW. Furthermore, this discharge<br />
had the best T'E among discharges with a similar minor radius. The increase in j3p<br />
was, however, insignificant <strong>and</strong> only a few similar discharges have been obtained to<br />
date. Many discharges with similar parameters that can be set by the operator resulted<br />
in bursts of radiation, originating from the molybdenum discharge contamination<br />
beginning at about the time when the Ha reduction would have happened.<br />
Reduction of particle recycling in the divertor region was observed during ICRF<br />
injection into Ohmic discharges <strong>and</strong> NB injected discharges with the injection power<br />
not greatly exceeding the ICRF power. The second example shown in Fig. 5(b) is<br />
a 1.5 MA divertor discharge with NB <strong>and</strong> ICRF heating. The increased Ha emission<br />
in the divertor with the NB injection turned out to diminish with the start of the .ICRF<br />
injection, <strong>and</strong> at the switchoff of the ICRF injection the emission started to increase<br />
again, suggesting a reduction of plasma flow into the divertor chamber during ICRF<br />
injection. The behaviour of Ha <strong>and</strong> ne signals during ICRF injection is totally different<br />
from that in NB heated discharges. The increased energy confinement time of<br />
70 ms during the initial NB injection was extended by 40% at the end of the ICRF<br />
injection.<br />
As the third example, two discharges heated with NB are compared in Fig. 5(c):<br />
one (shown by broken lines) was a normal, inductively driven discharge <strong>and</strong> the other<br />
one (solid line) was a discharge driven entirely by LHCD. Both discharges were<br />
operated at Bt = 4T, L, = 700 kA, with no gas feed (prefill only); they were heated<br />
by 40 keV, 8.1 MW NB power. A dramatically increased nc level in the LHCD discharge<br />
over the inductively driven discharge indicates improved particle confinement.<br />
The three chord density profile measurements showed substantially a peaked<br />
ne profile (ne(0)/ne = 2.1), suggesting Tp improvement in the plasma core. Also, the<br />
increased energy confinement time was raised by 30%. The improvement may be<br />
related to the suppression of sawtooth activities <strong>and</strong>/or a change in current profile.<br />
The internal inductance fell by 0.2 from the Ohmic heating level, indicating a flattening<br />
of the current profile by LHCD.<br />
5. CONCLUSIONS<br />
Energy <strong>and</strong> particle confinement was studied, by taking full advantage of efficient<br />
divertor functions of the JT-60 device that allowed operations over a wide density<br />
range by controlling the particle exhaust <strong>and</strong> impurity contamination, <strong>and</strong> by
98 JT-60 TEAM<br />
utilizing three different means of additional heating. The divertor was particularly<br />
useful in allowing operations at extremely low densities at which LHCD had to<br />
operate.<br />
The availability of three different means of additional heating, used individually<br />
<strong>and</strong> in various combinations, allowed investigations of the confinement properties<br />
that lead to operating modes with improved confinement.<br />
ACKNOWLEDGEMENTS<br />
The authors wish to thank the members of JAERI who have contributed to the<br />
JT-60 project throughout its progress. They also wish to express their gratitude to<br />
Drs S. Mori, Y. Iso, <strong>and</strong> K. Tomabechi for continued encouragement <strong>and</strong> support.<br />
REFERENCES<br />
[1] YOSHIKAWA, M., Paper <strong>IAEA</strong>-CN-47/A-I-1, these Proceedings, Vol. 1.<br />
[2] JT-60 TEAM (presented by H. Takeuchi), Paper <strong>IAEA</strong>-CN-47/A-IV-3, these Proceedings,<br />
Vol. 1.<br />
DISCUSSION<br />
F. WAGNER: The Ha radiation in the divertor chamber reflects the local ionization<br />
equilibrium fuelled by the power flow into it. Ha can transiently drop when<br />
the plasma confinement changes. On the other h<strong>and</strong>, Ha also drops when the power<br />
flow into the divertor chamber is reduced by enhanced impurity radiation in the main<br />
plasma chamber. To what extent is the Ha intensity reduction which you observed<br />
during ICRH caused by enhanced impurity radiation?<br />
M. NAGAMI: Although the radiation loss in the main plasma, P^ in , increased<br />
during ICRF, the power flux into the divertor, Pt0,-P£d in > also increased. Furthermore,<br />
it was experimentally demonstrated that an impurity (Ne) injection into an<br />
Ohmic discharge or a neutral beam heated discharge does not produce the same Ha<br />
reduction as that observed during ICRH.<br />
D.E. POST: Did the divertor operate in a 'high recycling' regime with high<br />
neutral compression at the low densities used for lower hybrid current drive?<br />
M. NAGAMI: Neutral particle pressure <strong>and</strong> recycling in the divertor chamber<br />
are low for the low density discharges with lower hybrid current drive.
ENERGY CONFINEMENT IN JET<br />
WITH OHMIC HEATING AND<br />
STRONG AUXILIARY HEATING<br />
<strong>IAEA</strong>-CN-47/A-D-3<br />
J.G. CORDEY, D.V. BARTLETT, V. BHATNAGAR 1 , R.J. BICKERTON,<br />
M. BURES, . J.D. CALLEN 2 , D.J. CAMPBELL, CD. CHALLIS,<br />
J.P. CHRISTIANSEN, S. CORTI, A.E. COSTLEY, G.A. COTTRELL,<br />
G. DUESING, J. FESSEY, M. GADEBERG 3 , A. GIBSON,<br />
A. GONDHALEKAR, N.A. GOTTARDI, C.W. GOWERS,<br />
M. VON HELLERMANN, F. HENDRIKS, L. HORTON, H. JACKEL 4 ,<br />
J. JACQUINOT, O.N. JARVIS, T.T.C. JONES, E. KALLNE, J. KALLNE,<br />
M. KEILHACKER, S. KISSEL, L. DE KOCK, P. LALUA, E. LAZZARO,<br />
P.J. LOMAS, N. LOPES-CARDOZO 5 , P.D. MORGAN, P. NIELSEN,<br />
J. O'ROURKE, R. PRENTICE, R.T. ROSS, G. SADLER, F.C. SCHULLER,<br />
A. STABLER 4 , P. SMEULDERS, M.F. STAMP, D. STORK, P.E. STOTT,<br />
D.R. SUMMERS, A. TANGA, P.R. THOMAS, E. THOMPSON,<br />
K. THOMSEN 3 , G. TONETTI 6 , B.J. TUBBING 5 , M.L. WATKINS<br />
JET Joint Undertaking,<br />
Abingdon, Oxfordshire,<br />
United Kingdom<br />
Abstract<br />
ENERGY CONFINEMENT IN JET WITH OHMIC HEATING AND STRONG AUXILIARY<br />
HEATING.<br />
The energy confinement properties with strong auxiliary heating are found to be well described<br />
by an offset linear law relating the stored energy W to the input power P (W = a P + 0). The scaling<br />
of the energy confinement time with the non-dimensional plasma physics parameters suggests that the<br />
underlying mechanism is resistive MHD. The heating profile <strong>and</strong> impurity radiation are identified as<br />
making a substantial contribution to the degradation in the global energy confinement time with auxiliary<br />
heating.<br />
1<br />
Plasma Physics Laboratory, Association "Euratom-Belgian State" ERM/KMS,<br />
Brussels, Belgium.<br />
2<br />
Department of Physics, University of Wisconsin, Madison, WI, USA.<br />
3<br />
Risa National Laboratory, Roskilde, Denmark.<br />
4<br />
Max-Planck-Institut fur Plasmaphysik, Garching, Fed. Rep. Germany.<br />
5<br />
FOM Instituut voor Plasmafysica, Nieuwegein, Netherl<strong>and</strong>s.<br />
6<br />
Centre de recherches en physique des plasmas, Ecole polytechnique fid6rale<br />
de Lausanne, Lausanne, Switzerl<strong>and</strong>.<br />
99
100 CORDEYetal.<br />
1. INTRODUCTION<br />
In this paper the energy confinement properties of the JET<br />
plasma with intense auxiliary heating are discussed. In<br />
previous papers [1],[2], confinement in ohmically heated plasmas<br />
has been reported. The additional heating was provided by<br />
neutral beams (60-75keV D <strong>and</strong> H) at powers up to 9MW <strong>and</strong> ion<br />
cyclotron resonance heating [3] of helium <strong>and</strong> hydrogen<br />
minorities at powers up to 7MW. The two heating methods were<br />
also combined to give a total input power of 16MW which was<br />
between 4 <strong>and</strong> 20 times the ohmic input power. The toroidal<br />
field B, plasma current I <strong>and</strong> average density were all<br />
varied over a wide range (B = 1.7 - 3.4 T, I = 1-5MA, = 0.5<br />
- 5 x 10 l9 rn~ 3 ), with the geometry kept essentially fixed (major<br />
radius R - 3.0m, horizontal minor radius a = 1.2m, elongation K<br />
= 1.45) so that the dependence of the global energy confinement<br />
T (= W/P-ft) upon I, B, <strong>and</strong> the heating scheme could be<br />
assessed.<br />
The plasma edge conditions have, however, been varied by<br />
limiting the plasma on the outer mid-plane limiters, the inner<br />
wall or separatrices (X-points) near the top <strong>and</strong> bottom of the<br />
chamber. Generally, the confinement time T£ degrades with both<br />
types of heating from its ohmic value - 0.5 - 0.8s down to<br />
~ 0.2-0.4s. The smallest degradation occurs for plasmas located<br />
on the inner wall or with an X-point.<br />
The remainder of the paper is divided as follows: in<br />
section 2.1 a simple empirical scaling law describing the<br />
behaviour of the T with the plasma parameters is derived <strong>and</strong><br />
then in section 2.2 the scaling of T? with the Connor-Taylor [4]<br />
dimensionless constraint parameters is determined. In Section 3<br />
the degradation in confinement is discussed. First the question<br />
of whether the heat flux is self-regulating to maintain a fixed<br />
electron temperature profile or whether it is determined by the<br />
local temperature gradient is examined. The latter model is<br />
found to be more consistent with the data. Then a procedure is<br />
given for correcting the input power for impurity radiation<br />
losses <strong>and</strong> heating profile effects, <strong>and</strong> it is shown that these<br />
can account for a substantial part of the degradation in<br />
confinement.<br />
2.1. Scaling of t£ with Plasma Parameters<br />
The plasma confinement properties with additional heating<br />
can be most clearly seen by exhibiting the data in a total<br />
(diamagnetic) energy W versus total input power P diagram such<br />
as that shown in Fig. 1 where examples of power scans with<br />
combined heating at four different currents <strong>and</strong> toroidal fields<br />
are shown. The data in Fig. 1 can be represented by an offset<br />
linear scaling of W with P in the form:
jf'''<br />
<strong>IAEA</strong>-CN-47/A-II-3 101<br />
r<br />
*<br />
*<br />
4 X<br />
* • • '<br />
s"'<br />
10<br />
P(MW)<br />
4MA<br />
,-2 MA<br />
.... 1 MA<br />
... *5MA<br />
F/G. 7. Total stored energy versus total input power for four different power scans:<br />
I = 5MA.B = 3.4 T; 1 = 4 MA, B = 3.4 T; I = 2 MA, B = 2 T; I = 1 MA, B = 2 T.<br />
W = W(O) (1)<br />
where the incremental confinement time T-^nc <strong>and</strong> VJ(O) are functions<br />
of the I, B, , etc. To make the representation fully<br />
general a dependence on power P has to be included in T:... The<br />
reason for this is that, although the data in Fig. 1 appear<br />
linear with P, the density is increasing with P in all the<br />
power scans <strong>and</strong> this could be masking the true power dependence.<br />
However, by combining data from scans at different starting<br />
densities, we have been able to show that the density dependence<br />
in iinc is weak. A good fit to the NBI data set has been found<br />
by use of st<strong>and</strong>ard regression techniques; it is:<br />
W(0) = 0.225 n 0 ' 6 I 0 - 5 B 0 '" <strong>and</strong> Tlnc = 0.047*1 (Units: MJ,<br />
m" 3 x 10~ 19 , MA, T). The complete data set (NBI, ICRH <strong>and</strong><br />
combined heating) is shown against this fit in Fig. 2.<br />
The scatter in the data in Fig. 2 is thought to be mainly<br />
due to the method of heating (NBI or ICRH) <strong>and</strong> the type of<br />
confinement, limiter or inner wall. It is found that the<br />
fraction of the input power radiated by the impurities is<br />
significantly larger for ICRH <strong>and</strong> limiter confinement than for<br />
inner wall with NBI heating.<br />
In Fig. 3 the radiation profiles are shown for three<br />
pulses: (A) a typical ohmic discharge. (B) an NBI discharge<br />
located on the inner wall, (C) a combined heating discharge on<br />
the limiter. Typically 30? of the input power is radiated in<br />
the central confinement zone (r/a < 0.7) in case (C) <strong>and</strong><br />
only &% in case (B); the source <strong>and</strong> concentration of the<br />
20
102 CORDEY et al.<br />
FIG. 2. Total stored energy versus the fit given in Eq. (]). The symbols are: • — neutral beam injection<br />
heating alone, A — including ICRH with H minority, <strong>and</strong> o — including ICRH with He minority.<br />
0<br />
FIG. 3. Radiation profiles for: (A) an ohmic discharge located on the inner wall, (B) an NBI heated<br />
(9 MW) discharge located on the inner wall, <strong>and</strong> (C) a discharge with combined heating (4 WM of ICRH<br />
<strong>and</strong> 5 MW of NBI).<br />
impurities is discussed in detail in ref. [5]. The radial<br />
heating profiles of the two schemes are also very different:<br />
the ICRH profiles are always peaked, ie. similar to the ohmic<br />
heating profile, whilst the NBI profile is usually less peaked,<br />
<strong>and</strong> at high densities the NBI profile is quite flat.
(0<br />
<strong>IAEA</strong>-CN-47/A-II-3 103<br />
P,o,
104 CORDEY et a).<br />
0.6 -<br />
IT<br />
0.4 -<br />
n n n<br />
• D<br />
b< +<br />
it*<br />
0.2 -<br />
.*!. ,11<br />
Jtpp<br />
00 - 1 1 1 1 1 1 1 IT<br />
1 "'"<br />
-ri-rr T l I I I •i m<br />
+<br />
X<br />
*<br />
D<br />
0<br />
T T i i i<br />
+<br />
X<br />
*<br />
0<br />
0<br />
h Comb DC H )<br />
< Comb D ( HE )<br />
NBD<br />
] NBH<br />
RFH<br />
-I-<br />
'<br />
0.0 0.2 0.4 0.6<br />
-exp<br />
FIG. 5. Energy confinement time versus the fit from the resistive MHD model.<br />
comparison is made with data from smaller devices. The scaling<br />
invariants originally given by Connor <strong>and</strong> Taylor were chosen<br />
arbitrarily to represent density, temperature <strong>and</strong> magnetic field<br />
dependences. For the high beta models, it is more appropriate<br />
to use the magnetic Reynolds number (S = TR/T^), the cyclotron<br />
frequency times the poloidal Alfve'n time (wcTApV, <strong>and</strong> the ratio<br />
of total to ohmic powers ( p tot' /p ohm^* The la " er variable is<br />
equivalent to the poloidal beta in power law scaling forms <strong>and</strong><br />
is used in order to prevent the energy content from appearing in<br />
both the dependent <strong>and</strong> independent variables. This set of<br />
scaling variables make the relationship between models more<br />
transparent <strong>and</strong> ensures that geometrical quantities such as<br />
safety factor <strong>and</strong> elongation are included in a natural fashion.<br />
The energy confinement time for the collisional high beta model<br />
is ,<br />
(2)<br />
P tot /P ohiJ<br />
The collisionless models are obtained by combining the last<br />
arguments as (Ptot /p ohm^ S ~ 1 <strong>and</strong> the fluid models by dropping<br />
o)cTAp. It is found that the JET data for (Ptot/Pohm)>2 are best<br />
represented by the resistive MHD model as<br />
T£ = 0.91 TAp (Ptot/Pohm) -0.5 Q0.75<br />
(3)<br />
The fit is shown in Fig. 5. Data from other machines can be<br />
reproduced when the aspect ratio (E = a/R) is included <strong>and</strong> the<br />
resulting scaling law is equivalent to<br />
r R T Ap 0 - 5
<strong>IAEA</strong>-CN-47/A-II-3 105<br />
In view of the surprising simplicity of this form <strong>and</strong> the<br />
absence of any significant normalising constant, it might be<br />
concluded that Eq.(4) is indicative of the underlying transport<br />
mechanism. However, this should be qualified by noting the<br />
difficulty in varying S <strong>and</strong> 3p in such a way as to clearly<br />
confirm the separate dependences in a given device. At first<br />
sight, Eq.(3) appears to be inconsistent with the offset linear<br />
scaling law Eq.(1). In fact, the implicit dependence of Pohm <strong>and</strong><br />
S on power make the two indistinguishable.<br />
3- DISCUSSION OF CONFINEMENT DEGRADATION<br />
There are many possible explanations for the degradation in<br />
confinement <strong>and</strong> some of these are examined briefly in this<br />
section. A current popular explanation is that the heat transport<br />
is self-adjusting such that the same electron temperature<br />
profile is maintained ('profile consistency 1 ). The evidence for<br />
profile consistency in JET data was reviewed by Bartlett et al.<br />
[7] recently. The electron temperature profiles in high<br />
current (I S 3MA) discharges certainly exhibit the conventional<br />
profile consistency features, that is Te(p)/Te(0) is only a<br />
function of q <strong>and</strong> the profile is unchanged by additional<br />
heating, at least at the presently available power levels<br />
(Ptot/Pohn] ~ **) • In low current (I = 1MA) discharges, where<br />
Ptot/PQhm - 20, the electron temperature profile appears to<br />
respond to the changing heating profile. In Fig. 6(a), the<br />
temperature profiles are shown for the two cases of low <strong>and</strong> high<br />
current before <strong>and</strong> during heating,<strong>and</strong> the corresponding heating<br />
profiles are shown in Fig. 6(b). In the low current case, the<br />
initial ohmically heated profile is substantially broadened by<br />
the application of NBI heating, whilst for the higher current<br />
pulse the ohmic <strong>and</strong> NBI heating profiles are rather similar.<br />
Although the change in both temperature profiles is small with<br />
additional heating, it is consistent with what is expected for<br />
the change in heating profile shown in Fig. 6(b). Indeed,as<br />
Waltz et al. [8] have shown, very large changes in the heating<br />
profile only produce small changes in the temperature profile<br />
shape for discharges in which the central q is limited by<br />
internal relaxations (sawteeth).<br />
Thus, in summary, there is no really clear evidence that<br />
'profile consistency 1 plays a deterministic role in heat<br />
transport. There is, however, evidence that whilst the confinement<br />
time degrades with power input, the underlying heat transport<br />
is independent of the auxiliary heating power. First, the<br />
fact that the total energy W increases linearly with power P, as<br />
shown in Fig. 1, means that the incremental confinement time<br />
T inc = AW/AP does not vary significantly with power level. For<br />
example, at I = 3MA we have xinc = ab/i(Tinc-2.9 +, 0.6m 2 /s.
106 CORDEY et al.<br />
0.0<br />
-1D-<br />
-2.0-<br />
-3D-<br />
I.U<br />
p<br />
(x10 5 Wm 3 )<br />
n<br />
_<br />
QO<br />
\<br />
\<br />
\<br />
1 '<br />
\<br />
\ \<br />
05<br />
\ X<br />
< ^><br />
\<br />
\ \<br />
\<br />
\\\\ \<br />
FIG. 6. (a) Loge (Te(p)/Tt(0)) versus p, for a 3 MA discharge before heating (curve A) <strong>and</strong> after<br />
9 MW ofNBl heating (curve B), <strong>and</strong> fora 1 MA discharge before heating (C) <strong>and</strong> during 9 MW ofNBl<br />
heating (D). (b) Power input to the electrons versus p for the four cases shown in (a).<br />
Second, as shown in Fig. 7, the electron heat flux per unit<br />
density, Pe(r)/nA = / d 3 xIQ/n/ dA, is proportional to the local<br />
temperature gradient. This implies a Xfiux =<br />
A(Pe(r)/nA)/A(dTe/dr) - 1.8 - 3-3m 2 /s for the 3MA case. (The<br />
reason for the large range in xe is due to the uncertainty in<br />
estimating the loss through the ion channel.) Finally, <strong>and</strong> most<br />
locally, the XHP determined using the heat pulse propagation<br />
method [9] is found to be approximately constant (for I = 3MA»<br />
a = 1.2, K = 1.45) at a value of 2.4 +_ 0.7mVs, independent of<br />
the heating power [10]. The fact that these three different<br />
methods of determining the electron heat diffusivity xe yield<br />
nearly the same power-independent value (xinc ~ Xfiux ~ Xfjp)<br />
implies that the transition from ohmically to auxiliary heated<br />
^<br />
1<br />
B<br />
(b)<br />
_<br />
-<br />
1.0
201<br />
A 101<br />
V<br />
c<br />
<strong>IAEA</strong>-CN-47/A-D-3 107<br />
0 25 50<br />
Heat flux (kW/m 2 )<br />
Xe = 1-8 - 3.9 m 2 /s<br />
« , • XHP = 2.4 ± 0.7<br />
FIG. 7. n< V r,> at p = 0.75 versus heat flux for a 3 MA power scan (o) <strong>and</strong> a 1 MA power<br />
scan (M). The dotted lines are the best straight line fits to the data.<br />
discharges may be interpretable in terms of a transport model<br />
with electron heat conduction characterised by a constant value<br />
of xe •<br />
An example of such a model will now be developed <strong>and</strong> used<br />
to clarify the heating profile <strong>and</strong> radiation loss effects.<br />
First, assume that the heat flux is given generally by heat<br />
conduction plus convection in the form
108 CORDEY et at.<br />
W (MJ)<br />
3<br />
1<br />
Pen<br />
F/G. 8. Total energy density versus effective power.<br />
Symbols: it = ohmic heating, • = NBIonly, A = ICRHonly, o = combined ICRH <strong>and</strong> NBI. Open<br />
symbols: before correction for radiation losses <strong>and</strong> heating; solid symbols: after correction for radiation;<br />
dotted symbols: after correction for radiation <strong>and</strong> heating profile effects.<br />
The main reason for deriving Eq.(5) is that it has the same<br />
form as the linear offset model Eq(1) used to represent the<br />
data, the offset being identified as the convected power.<br />
However, it would be negative in this model, indicating a heat<br />
pinch [11]. An alternative heat transport model without a heat<br />
pinch (q 0) would require a x which, while constant over<br />
the usual<br />
conv<br />
power input (or VT) range,varies strongly at low<br />
values of VT [12],[13]. From Fig. 7, either of these models<br />
could fit the present data.<br />
An example of the use of Eq.(5) is shown in Fig. 8,where the<br />
above profile analysis techniques are applied to an I = 3MA,<br />
B = 2T, power scan with combined heating. The data is shown<br />
before correction for the power lost by radiation (open<br />
points) <strong>and</strong> then after correction for the power lost by<br />
radiation (solid points). Correcting for radiation losses<br />
reduces the scatter in the data <strong>and</strong> increases the incremental<br />
confinement time by 30%. Correcting for the differing heat<br />
deposition profile further increases the incremental confinement<br />
time (arrowed points) <strong>and</strong> the degradation in confinement in<br />
going from ohmic to strong auxiliary heating is then much<br />
smaller. Now the results in Fig. 8 will depend on the<br />
assumptions that are made for the radial profile of x- However,<br />
this example does demonstrate qualitatively that the degradation<br />
in the confinement time T£ could be due to the broader<br />
~t<br />
°»<br />
10<br />
* o<br />
"T<br />
15
<strong>IAEA</strong>-CN-47/A-II-3 109<br />
deposition profile of NBI <strong>and</strong>/or enhanced radiation, <strong>and</strong> a<br />
change in the basic heat transport mechanism may not be<br />
required.<br />
4. CONCLUSIONS<br />
A simple empirical scaling law, Eq.(1 ), has been found to<br />
adequately describe the energy confinement properties of JET<br />
with intense additional heating. The scaling of the energy<br />
confinement time with the dimensionless plasma physics<br />
parameters suggests that the underlying heat transport is a<br />
consequence of resistive MHD instabilities. Electron heat<br />
transport with auxiliary heating has been found by three<br />
different methods to be describable in terms of a heat flux with<br />
a constant coefficient (xe ~ 2.5 + 1 .OmVs for 3MA discharges).<br />
A substantial contribution to the degradation in global<br />
confinement with additional heating is shown to be due to the<br />
profiles of radiation <strong>and</strong> heating.<br />
REFERENCES<br />
[1] CORDEY, J.G., et al., in Controlled Fusion <strong>and</strong> Plasma Physics (Proc. 12th Europ. Conf.<br />
Budapest, 1985), Pt. I, European Physical Society (1985) 26.<br />
[2] THOMSEN, K., et al. in Controlled Fusion <strong>and</strong> Plasma Heating (Proc. 13th Europ. Conf.<br />
Schliersee, 1986), Vol. 1, European Physical Society (1986) 29.<br />
[3] JACQUINOT, J., et al., Paper <strong>IAEA</strong>-CN-47/F-I-1, these Proceedings, Vol. 1.<br />
[4] CONNOR, J.W., TAYLOR, J.B., Nucl. Fusion 17 (1977) 1047; Phys. Fluids 27 (1984) 2676.<br />
[5] BEHRINGER, K., et al., Paper <strong>IAEA</strong>-CN-47/A-IV-l, these Proceedings, Vol. 1.<br />
[6] KAYE, S.M., GOLDSTON, R.J., Nucl. Fusion 25 (1985) 65.<br />
[7] BARTLETT, D.V., et al., in Controlled Fusion <strong>and</strong> Plasma Heating (Proc. 13th Europ. Conf.<br />
Schliersee, 1986), Vol. 1, European Physical Society (1986) 236.<br />
[8] WALTZ, R.E., et al., Rep. GA-A-18365, GA Technologies Inc., San Diego, CA; to be published<br />
in Nucl. Fusion.<br />
[9] CALLEN, J.D., JAHNS, G.L., Phys. Rev. Lett. 38 (1977) 971.<br />
[10] TUBBING, B.J.D., et al., Heat Pulse Propagation Studies in JET, Report JET Joint Undertaking,<br />
Abingdon (to be published).<br />
[11] FREDRICKSON, E.D., et al., Nucl. Fusion 26 (1986) 849.<br />
[12] REBUT, P.H., BRUSATI, M., paper presented at 12th Europ. Conf. Budapest on Controlled<br />
Fusion <strong>and</strong> Plasma Physics, 1985.<br />
[13] THOMAS, P., paper presented at 12th Europ. Conf. Budapest on Controlled Fusion <strong>and</strong> Plasma<br />
Physics, 1985.<br />
DISCUSSION<br />
R.J. GOLDSTON: In your model, heat flow is a strictly defined offset linear<br />
function of r^ v Te. How does this model deal with the heating profile experiments
110 CORDEYetal.<br />
from T-10, ASDEX, TFTR <strong>and</strong> JET, <strong>and</strong> how does it cope with the apparent sensitivity<br />
of the confinement to edge parameters, for instance in the H-mode?<br />
J.G. CORDEY: It has been shown by Waltz et al. (paper <strong>IAEA</strong>-CN-47/<br />
A-VI-1-3, these Proceedings) that nx V T can produce 'profile consistency' for Te<br />
profiles. In the H-mode the magnitude of x in the edge region is greatly reduced <strong>and</strong><br />
this accounts for the improved confinement.<br />
H. HORA: With regard to your discussion of the inhibition of thermal conduction,<br />
have you included in this the effects of electric (inhomogeneity) fields <strong>and</strong><br />
double layer 1 , since there they provide an explanation for pellet fusion 2 <strong>and</strong> since<br />
the generally predicted fields 3 have now been measured in toroidal plasmas?<br />
J.G. CORDEY: No; this model is only in its infancy <strong>and</strong> these effects have not<br />
been taken into account.<br />
B. COPPI: I do not underst<strong>and</strong> how a theory of purely resistive modes can be<br />
applicable to low collisionality regimes (multi-keV), as you have in JET. Could you<br />
comment on that?<br />
J.G. CORDEY: Yes, I would expect this theory to apply equally to the low collisionality<br />
regimes; however, the data certainly do not appear to fit them. There are<br />
two possible explanations: one is that the true dependence of rt on the plasma<br />
parameters is being masked by power deposition <strong>and</strong> radiation profile effects; the<br />
other is that the non-linear development of the general kinetic theory leaves resistive<br />
MHD for determining the transport.<br />
R.J. TAYLOR: What does your nTET; function look like for all the JET data<br />
versus power input? Does it support Rebut's position regarding the lack of significance<br />
of auxiliary heating?<br />
J.G. CORDEY: Until recently, the best nTETj value was obtained with Ohmic<br />
heating (1 = 5 MA); however, using X-point operation at 3 MA, this value has<br />
recently been doubled to 2 x 10 20 m~ 3 -s-keV. We do not yet have its scaling with<br />
power.<br />
1 HORA, H., et al., Phys. Rev. Lett. 53 (1984) 1650.<br />
2 CICCHITELL, L., et al., Laser Part. Beams 2 4 (1984).<br />
3 LALOUSIS, P., Phys. Lett., A 99 (1983) 89.
EFFECT OF p AND j PROFILES<br />
ON ENERGY CONFINEMENT<br />
IN ECH EXPERIMENTS ON T-10<br />
<strong>IAEA</strong>-CN-47/A-II-4<br />
V.V. ALIKAEV, A.A. BAGDASAROV, E.L. BEREZOVSKIJ,<br />
A.B. BERLIZOV, G.A. BOBROVSKU,<br />
A.A. BORSHCHEGOVSKIJ, N.L. VASIN,<br />
A.N.I. VERTIPOROKH, V.V. VOLKOV, E.P. GORBUNOV,<br />
Yu.A. GORELOV, Yu.V. ESIPCHUK, S.L. EFREMOV,<br />
V.S. ZAVERYAEV, V.I. IL'IN, A.Ya. KISLOV, P.E. KOVROV,<br />
S.Yu. LUK'YANOV, Yu.S. MAKSIMOV, A.A. MEDVEDEV,<br />
G.E. NOTKIN, A.B. PIMENOV, V.I. POZNYAK, LA. POPOV,<br />
S.V. POPOVICHEV, K.A. RAZUMOVA, P.V. SAVRUKHIN,<br />
E.V. SITAR, A.M. SOLNTSEV, M.M. STEPANENKO,<br />
V.S. STRELKOV, A.V. TARAKANOV, K.N. TARASYAN,<br />
K.B. TITISHOV, V.M. TRUKHIN, G.S. YARAMYSHEV<br />
I.V. Kurchatov Institute of Atomic Energy,<br />
Moscow<br />
S.N. VLASOV, A.L. GOL'DENBERG, V.A. MARKELOV,<br />
V.A. FLYAGIN, B.V. SHISHKIN<br />
Institute of Applied Physics of the USSR Academy of <strong>Sciences</strong>,<br />
Gorkij<br />
Union of Soviet Socialist Republics<br />
Presented by B.B. Kadomtsev<br />
Abstract<br />
EFFECT OF p AND j PROFILES ON ENERGY CONFINEMENT IN ECH EXPERIMENTS<br />
ON T-10.<br />
ECH experiments with doubled HF power, PHF, were carried out on T-10, <strong>and</strong> the dependence<br />
of energy confinement on PHF was shown to remain the same as in previous T-10 experiments. The<br />
dependence of the transport coefficients on the pressure gradient was shown to be strongly non-linear.<br />
The results of off-axis heating agree with the idea of pressure (current) profile consistency.<br />
1. INTRODUCTION<br />
An ECH experiment with increased HF power has recently been carried out on<br />
T-10. The HF set-up consisted of six gyrotrons with f = 81 GHz <strong>and</strong> provided a<br />
PHF value of up to 2 MW, which was twice as high as previously [1, 2]. Diamagnetic<br />
measurements showed the absorbed power, Pab, to be 70 to 75% of PHF-<br />
111
112 ALIKAEV et al.<br />
The main goal of our recent investigations was to study the influence of the plasma<br />
parameter profiles on the energy confinement. The profiles were varied by shifting<br />
the ECR zone. The conservation of the p <strong>and</strong> j profiles (i.e. the dependence of the<br />
transport coefficient on the Pab profile [3, 4]), its dependence on vpe <strong>and</strong> the connection<br />
of this dependence with the limit profile idea [3] were studied.<br />
The plasma current Ip was varied from 180 to 230 kA, which corresponded to<br />
qL = 6.4 to 5.0 at aL = 34 cm. The ratio Ptot/PoH was increased up to 5.5, P,ot<br />
being defined as Pab + PQ£ H -<br />
2. PECULIARITIES OF RECENT EXPERIMENTAL CONDITIONS<br />
The experimental conditions differed from those in the previous experiments<br />
[1,2], which resulted in a difference in the Ohmic stages. First, the vacuum chamber<br />
was replaced by a new one. Second, two circular carbon limiters were removed<br />
because the large amount of graphite has led to hydrocarbon film production on the<br />
first wall. This resulted in breakdowns between the wall <strong>and</strong> the waveguide <strong>and</strong> in<br />
a cut-off of the power input. To prevent this, we needed a great number of training<br />
discharges, along with the HF pulses.<br />
In the recent experiment, it was only the movable rail limiter that was made of<br />
graphite. The reduction of the quantity of graphite, together with waveguide baking,<br />
eliminated arcing <strong>and</strong>, on the other h<strong>and</strong>, changed the near wall conditions significantly.<br />
The metal impurity influx increased so that the iron density in the centre rose<br />
up to 1-2 X 10 10 cm" 3 , i.e. by a factor of five. This seems to be the reason for the<br />
increase in radiation power; Prad = 0.7 POH at fle = 3 X 10 13 cm" 3 in comparison<br />
with 0.25 POH in [1. 2]. The recycling <strong>and</strong> the additional particle influx during ECH<br />
went down markedly. Figure 1 shows the energy content in the Ohmic plasma,<br />
W0H, as a function of n,. at Ip = 180 kA, Bt = 2.9 T. At the beginning of the<br />
experiments (solid line), a saturation in W0H(n,,), accompanied by a rise in the<br />
m = 2 mode activity (Bp/Bp = 4 X 10 " 4 at fig = 3.2 x 10 13 cm" 3 ) was observed<br />
near to the limit value of fl,., fleiim = 3.5 x 10 13 cm" 3 , above which disruption<br />
occurred. The energy confinement time TE did not exceed 50 ms <strong>and</strong> was lower than<br />
that in [2]. In the course of the experiments, the heavy impurity level, the radiation<br />
losses <strong>and</strong> the loop voltage were going down, apparently because of changes in the<br />
wall conditions. The value of ne|im then rose up to 4.2 x 10 13 cm" 3 , MHD activity<br />
stopped up to fij = 3.6 x 10 13 cm" 3 , <strong>and</strong> no evident saturation on the W0H(n
<strong>IAEA</strong>-CN-47/A-II-4 113<br />
ne.10 13 cm<br />
FIG. 1. W0H(ne) dependence on Ohmic stage of discharges with Ip = 180 kA, B, = 2.9 T. Solid line<br />
refers to results obtained at beginning of experiments, dashed line to the final stage.<br />
decrease was stronger at higher r^ <strong>and</strong> PHF. As before [2], the most significant<br />
decrease in ii,. was recorded at the plasma centre. It caused ne profile flattening<br />
(Fig. 3(a)).<br />
The energy content reached its maximum Wm at At = 25 ms of the ECH<br />
pulse (Fig. 2(a)) <strong>and</strong> went then down while Te continued growing during the whole<br />
pulse all over the cross-section (Fig. 4(a)). The decrease in energy content (from<br />
Wm = 37.5 kJ to 26 kJ at At = 65 ms) can be explained, within the experimental<br />
accuracy, by the dependence TE OC %, which is valid for ECH as has been shown in<br />
[1] <strong>and</strong> was confirmed in the recent experiments. If fie is maintained constant by an<br />
additional puffing during the ECH pulse, there is virtually no change in W after<br />
reaching the stationary value (Fig. 2(b)). The dependence of Wm on P,ot is displayed<br />
in Fig. 5, together with the data of [2]. The 7E(Pt0t) dependence does not, within the<br />
experimental accuracy, deviate from that estimated earlier [2]:<br />
- CD I'D \ -0.55<br />
if the drop in r^ <strong>and</strong> the r^fi,.) dependence are taken into account. This result does<br />
not contradict the conclusion reached in [2] that the electron energy confinement time<br />
for the column as a whole, TEe(aL), is proportional to ~' A , which is equivalent to<br />
= (P,O,/POH)"' A<br />
because (/VWOH = 0.7, <strong>and</strong> the ions were not heated significantly by ECH in the<br />
case considered.
114<br />
ALIKAEV et al.<br />
FIG. 2. Time behaviour of energy content increase, AW, <strong>and</strong> ft, during ECH: (a) on-axis heating,<br />
B, = 2.9 T, 6gyrotrons, low level gas puffing during ECH; (b) same with high level puffing;<br />
(c) off-axis heating, B, = 3.25 T, ECR zone shift, AR = 18 cm, 4 gyrotrons.<br />
In summary, the PHF doubling did not change the scaling for the global<br />
confinement time obtained earlier.<br />
4. Te PROFILE IN ON-AXIS ECH<br />
The electron energy confinement in the core varies more dramatically with the<br />
Ptot variations than the global time rE. The profiles of the relative Te increase at<br />
the end of the ECH pulse were measured for different numbers of gyrotrons in<br />
0.56
<strong>IAEA</strong>-CN-47/A-II-4 115<br />
10 15<br />
r, cm<br />
(a)<br />
20 25 30<br />
FIG. 3. ne profiles at different moments of ECH pulse starting at At = 0: (a) same conditions as<br />
Fig. 2(a); (b) same conditions as Fig. 2(c).<br />
plasmas with i^ = (3-3.5) x 10 13 cm 3 <strong>and</strong> are displayed in Fig. 6(a), (b) <strong>and</strong> (c).<br />
EC radiometer data are used. For Pab < 1 MW, Te(0) is proportional to Ptot<br />
(Fig. 7) <strong>and</strong> TJTtOH is practically constant along the radius, providing, thus,<br />
evidence of a Te profile change in a similar way. For higher Ptot, Te(0) almost ceases<br />
rising, which indicates a drastic increase of transport in the plasma centre. The Te<br />
profile tends to flatten (Figs 6(a) <strong>and</strong> 8), which agrees with the conclusion of [2] that<br />
the heat conductivity coefficient K
116<br />
ALIKAEV et al.<br />
-1<br />
1<br />
Q45 0.55 0.45<br />
I , S<br />
1<br />
I<br />
/<br />
ECRH<br />
0.5<br />
t.S<br />
i<br />
A, A<br />
FIG. 4. Te time behaviour during ECH at different radii: (a) same conditions as Fig. 2(a);<br />
(b) same conditions as Fig. 2(c). ISxR is soft X-ray intensity emitted by plasma core.<br />
30<br />
20<br />
10<br />
- cij,<br />
/><br />
- ,'OOH / /<br />
OH» /<br />
/ /<br />
" / /<br />
1/<br />
1/<br />
'/<br />
> 1<br />
0.5<br />
A.<br />
1<br />
Ptot<br />
• IUI »<br />
A*<br />
F/G. 5. Dependence of maximum energy content, Wm, on total heating power, Pm, (2),<br />
together with the data ofRef. [2], (1): lp = 180 kA, B, = 2.9 T, ht = 2.8 X 10 13 cm~ 3 .<br />
V5<br />
i<br />
0.55
h? 2<br />
O o<br />
Oo<br />
o o<br />
<strong>IAEA</strong>-CN-47/A-O-4 117<br />
8<br />
8o<br />
O o<br />
-5 5 10 15<br />
R - Ro. cm<br />
FIG. 6. Relative profiles of electron temperature, TJTe 0H, as measured by EC radiometer at end of<br />
ECH pulse. B, = 2.9 T (on-axis ECH), ne = (3-3.5) x 10 13 cm' 3 , (a), (b) <strong>and</strong> (c) are for 6, 4 <strong>and</strong><br />
2 gyrolrons, respectively.<br />
In Ref. [3], the dependence of K,. on the pressure gradient, v pe, was shown.<br />
The new results confirm this dependence <strong>and</strong> point out its strongly non-linear character,<br />
i.e. the existence of a limit gradient near which the transport coefficients rise up<br />
significantly. This is illustrated by Fig. 9, where the data obtained for the end of the<br />
ECH pulse at different Ptot <strong>and</strong> n,. values is displayed. These data relate to the<br />
plasma centre (r < 10 cm). The S value,<br />
s =<br />
1<br />
o o<br />
20<br />
(b)<br />
(c)
118<br />
ALIKAEV et al.<br />
FIG. 7. Dependence of central Te on P,o,for end of on-axis ECH (B, = 2.9 T,<br />
», = 3.2 x 10 13 cm' 3 ).<br />
FIG. 8. Tt profiles for OH <strong>and</strong> end of on-axis ECH with 6 (I) <strong>and</strong> 4 (2) gyrotrons. B,<br />
ht = 3.2 x 10 13 cm~ 3 . PHA data are used for Tt0H.<br />
2.9 T,<br />
(POH is the Ohmic power at the Ohmic stage, Pei the electron-ion heat transfer) is,<br />
in fact, the ratio IQ/Ke OH if one assumes that the Te profile changes only slightly in<br />
the plasma core. In Fig. 9, v pe is replaced by the central pressure, in accordance<br />
with the idea of p profile consistency [3]. The results of the ECH experiment on T-7<br />
are also shown in Fig. 9 [5]. The rise in Te(0) from 1.6 to 4.2 keV at low HF power
CO<br />
2-<br />
<strong>IAEA</strong>-CN-47/A-H-4 119<br />
n.(0)T.|0),1O l3 keVcm- 3<br />
10 15<br />
FIG. 9. Increase in Ke for plasma core (r < 10 cm) as a Junction of pressure gradient (see the text).<br />
+ - calculations for Ke oc fe s ; ©, © T-7 data [5].<br />
(Ptot = 0.3 MW) obtained in this experiment can be explained by the fact that the<br />
pressure gradient was far from the limit gradient in T-7, because of low<br />
fi,. (6 x 10 12 cm- 3 ).<br />
Could the observed K^ v pe) dependence be interpreted as a relation between<br />
their local values? Or is it the result of a distortion of the p <strong>and</strong> j profiles by ECH,<br />
i.e. is it determined by the P^ profile?<br />
We have not yet enough data to decide which of these explanations is the<br />
correct one.<br />
5. ON PROFILE CONSISTENCY IN PLASMA (OFF-AXIS ECH)<br />
Consistency of p <strong>and</strong> j profiles in plasma (if it exists) can only be realized<br />
through variations of the transport coefficients which would depend on the profile of<br />
the heating power, Pab(r). This means that the outward shift of the ECR zone would<br />
result in a decrease of the transport coefficients in the plasma core after switching<br />
on the ECH pulse, because we apply no additional power there.<br />
To test the hypothesis of profile consistency, the experiment was done with an<br />
outward shifted ECR zone (AR =18 cm). The results are displayed in Figs 2(c),<br />
4(b) <strong>and</strong> 10. As previously [1, 2], the maximum rise in energy content, AWm, is<br />
practically the same compared with on-axis ECH at the same Pab value, <strong>and</strong> the<br />
confinement degradation observed at the end of the ECH pulse is stronger (Fig. 2(c)).<br />
The data presented in Fig. 10(a) show that the rise in Te at At = 20 ms is stronger<br />
behind the ECR zone, in this case, than with on-axis heating <strong>and</strong>, hence, AWm does<br />
not change with the AR variations, but for At > At,,,, Te falls in the plasma
120 ALIKAEV et al.<br />
exterior, in contrast to the central ECH. In the plasma core, Te rises during the<br />
entire ECH pulse (Fig. 4(b)). These results qualitatively indicate the tendency<br />
towards pressure profile conservation, especially if n,.(r) peaking is taken into<br />
account (Fig. 3(b)), which is the other difference between on-axis <strong>and</strong> off-axis ECH.<br />
This tendency is confirmed by the energy balance at At = 50 ms in the plasma core<br />
(r < 9 cm), which is not supplied with additional power (Fig. 10). K,, decreases in<br />
the core during ECH so that<br />
- Pei - Prad " (3/2) d/dt ~<br />
~Z—<br />
x <<br />
1 e0H<br />
(PoH ~ Pei ~~ Prad)0H d ^<br />
~~;— Te ECH<br />
dr<br />
f 9<br />
= 2TT neTerdr; K,.OH S 7 X 10 16 cm-'-s" 1<br />
Jo<br />
This estimation is the upper limit of K,, at ECH because the current profile rebuild<br />
which decreases the P0H value for off-axis ECH is not taken into account.<br />
The soft X-ray signal traces (Fig. 4(b)) demonstrate rise in ISxR at the centre<br />
20 ms after switching off the ECH pulse. This displays a slow decrease in Te(0) <strong>and</strong><br />
a possible continuous accumulation of impurities ('B-regime' on T-10).<br />
The slow rebuild of the Te profile in the plasma core during the ECH pulse is<br />
connected with the fact that POH is nearly balanced there by the electron energy<br />
losses Pe. From a rough estimate, the characteristic time of profile rebuild is of the<br />
order of seconds. So, to confirm the p <strong>and</strong> j profile conservation, an experiment is<br />
needed with longer ECH pulse at lower n,., i.e. with a higher value of (P0H-Pe)-<br />
It was assumed in [6] that the low K, in the plasma core (< 10 17 cm" 1 -s~') at<br />
high tig/Ip values was the result of a balance between diffusivity <strong>and</strong> convective<br />
influx (heat pinch). If balance prevails, then at the beginning of the HF pulse<br />
(At = 20 ms) one could expect a strong rise in the heat flux because both the diffusive<br />
flux (Fig. 10(a)) at r = 6 cm <strong>and</strong> the heat pinch would be directed inward.<br />
Hence, the K,, value measured as the ratio of the total electron heat flux to v Te<br />
would also rise strongly. However, an energy balance analysis showed that in the<br />
plasma core K,. was at least not higher than in the Ohmic stage. We may conclude<br />
that the heat pinch does not play an essential role under these conditions.<br />
6. INTERNAL MHD ACTIVITY<br />
A specific MHD activity was detected in recent experiments by pickup coils<br />
with good reproducibility (Fig. 11 (a)). This activity had also been observed
1.5<br />
05<br />
4-<br />
<strong>IAEA</strong>-CN-47/A-II-4 121<br />
10 15 20<br />
R-R0.cm<br />
FIG. 10. (a) Teprofiles at two instants of ECHpulse together with profile ofTe '(dTJdt) at the start<br />
of non-central ECH. B, = 3.25 T, ne = 3.6 x 10 13 cm~ 3 , 4 gyrotrons; (b) relative increase ofTe at<br />
end of ECH pulse (At = 50 ms) for same conditions. A refers to Te profile at At = 50 ms of central<br />
heating.<br />
previously. It manifests itself in sinusoidal oscillations on the traces of the EC radiation<br />
<strong>and</strong> of the SXR intensity (Fig. ll(c)) at intermediate radii. The amplitude of Bp<br />
oscillations (see Fig. 11 (a) for Bp/Bp) is so high that these oscillations would result<br />
in a major disruption or in strong confinement degradation if m were equal to 2 or<br />
3 (Fig. ll(b)). However, this 'quiet' mode does not significantly enhance the<br />
plasma-wall interaction (Fig. 11 (a)). It results in a drop in Te(0) <strong>and</strong> suppresses the<br />
sawteeth, i.e. it exists mainly in the plasma interior. The mode is observed for<br />
n; = (1.5-2.5) X 10 13 cm" 3 at L = 200-230 kA (Bt = 3 T).<br />
(b)<br />
25<br />
SO<br />
60<br />
40<br />
20
122<br />
ALIKAEV et al.<br />
FIG. 11. Time behaviour ofMHD activity characterized by Bp/Bp amplitude (Bp is the poloidal field)<br />
<strong>and</strong> traces of He, Prml <strong>and</strong> loop voltage U: (a) for internal MHD mode; (b) for m = 2 mode;<br />
(c) time behaviour of Te at different radii of auxiliary-heated discharge (on-axis ECH) with internal<br />
MHD mode.<br />
7. SUMMARY<br />
1. Doubling the HF power during the ECH experiments on T-10 practically<br />
did not change the character of the energy confinement dependence on Ptot,<br />
compared to previous experimental results. This dependence does not contradict the<br />
'Ohmic' scaling, T&. OC ~ 0 - 5 .<br />
2. The dependence of Ke on v pe for the plasma core obtained previously is<br />
confirmed; it is shown to be essentially non-linear. A limit value of v pe exists in<br />
the vicinity of which the transport coefficients rise significantly.<br />
3. The results of the off-axis heating experiments do not contradict the idea of<br />
p <strong>and</strong> j profile consistency.<br />
4. The low Kg values in the plasma core which are characteristic for high<br />
fle/Ip, ohmically heated plasmas are shown to be not the result of the existence of a<br />
heat pinch.<br />
ACKNOWLEDGEMENTS<br />
The authors would like to thank B.B. Kadomtsev <strong>and</strong> V.S. Mukhovatov for<br />
fruitful discussions <strong>and</strong> the T-10 staff for providing the experiments.<br />
(c)
<strong>IAEA</strong>-CN-47/A-II-4 123<br />
REFERENCES<br />
[1] ALIKAEV, V.V., et al., in Plasma Physics <strong>and</strong> Controlled <strong>Nuclear</strong> Fusion Research 1984 (Proc.<br />
10th Int. Conf. London, 1984), Vol. 1, <strong>IAEA</strong>, Vienna (1985) 419.<br />
[2] T-10 GROUP, in Controlled Fusion <strong>and</strong> Plasma Physics (Proc. 12th Europ. Conf. Budapest,<br />
1985), Vol. 1, European Physical Society (1985) 42.<br />
[3] ESIPCHUK, Yu.V., RAZUMOVA, K.A., in Controlled Fusion <strong>and</strong> Plasma Heating (Proc. 13th<br />
Europ. Conf. Schliersee, 1986), invited paper.<br />
[4] ESIPCHUK, Yu.V., KADOMTSEV, B.B., Pis'ma Zh. Ehksp. Teor. Fiz. 43 (1986) 573.<br />
[5] ALIKAEV, V.V., et al., Paper <strong>IAEA</strong>-CN-47/F-II-4, these Proceedings.<br />
[6] T-10 GROUP, in Controlled Fusion <strong>and</strong> Plasma Physics (Proc. 12th Europ. Conf. Budapest,<br />
1985), Vol. 1, European Physical Society (1985) 38.<br />
DISCUSSION<br />
R.J. GOLDSTON: This is more a comment than a question. It seems that we<br />
are learning how strong the profile conserving mechanism is in the plasma core. It<br />
appears to be able to reduce xe by something like a factor of two, but it does not<br />
turn Xe negative, which would correspond to a heat pinch, nor does it even make xe<br />
zero.<br />
B.B. KADOMTSEV: Yes, I quite agree.<br />
M.A. DUBOIS: The absence of a central electron temperature spike during<br />
central heating is in sharp contradiction with the TFTR results. Is it certain that the<br />
q = 1 surface is present inside those plasmas?<br />
B.B. KADOMTSEV: No, it is not absolutely certain. We do not yet have any<br />
experimental data on this point.
ACHIEVEMENT OF REGIMES WITH<br />
HIGH DENSITY, LOW qa AND<br />
GOOD CONFINEMENT ON ASDEX<br />
<strong>IAEA</strong>-CN-47/A-n-S<br />
H. NIEDERMEYER, F. WAGNER, G. BECKER, K. BUCHL, A. EBERHAGEN,<br />
G. FUSSMANN, O. GEHRE, G. VON GIERKE, O. GRUBER, G. JANESCH1TZ,<br />
M. KAUFMANN, K. LACKNER, R. LANG, V. MERTENS, H. MURMANN,<br />
W. SANDMANN, E. SPETH, K. STEINMETZ, G. VLASES 1 , U.S. BOSCH,<br />
H. BROCKEN, J. GERHARDT, E. GLOCK, G. HAAS, J. HOFMANN,<br />
A. IZVOZCHIKOV 2 , F. KARGER, M. KEILHACKER 3 , O. KLUBER,<br />
M. KORNHERR, M. LENOCI, G. LISITANO, F. MAST, H.M. MAYER,<br />
K. McCORMICK, D. MEISEL, E.R. MULLER 3 , Z.A. PIETRZYK 1 ,<br />
W. POSCHENRIEDER, H. RAPP, H. RIEDLER, H. ROHR, J. ROTH,<br />
F. RYTER 4 , F. SCHNEIDER, C. SETZENSACK, G. SILLER,<br />
P. SMEULDERS 3 , F.X. SOLDNER, K.-H. STEUER, O. VOLLMER,<br />
D.ZASCHE<br />
Euratom-IPP Association,<br />
Max-Planck-Institut fur Plasmaphysik,<br />
Garching, Federal Republic of Germany<br />
Abstract<br />
ACHIEVEMENT OF REGIMES WITH HIGH DENSITY, LOW qa AND GOOD CONFINEMENT<br />
ON ASDEX.<br />
The density limit in ASDEX decreases for % < 2.7. However, in gettered discharges at high<br />
current (500 kA), the density limit shows again a steep increase to a higher second maximum<br />
(M = neR/B, = 7.2 x lO^m^-T" 1 ) at c^ = 2.05. The lowest c^-value achieved so far in Ohmic<br />
<strong>and</strong> beam heated plasmas is 1.9 (M0H = 6.6 x 10 19 ). With continuous pellet injection, peaked density<br />
profiles with very high central values (2.2 x 10 20 m" 3 ) were obtained in Ohmic <strong>and</strong> weakly beam<br />
heated discharges. In pellet refuelled discharges, rE-values of 160 ms are achieved with nerE =<br />
3.5 x 10 19 sm~ 3 . The confinement in the L-regime seem to be governed by the same principles as in<br />
the OH-saturation regime. TE can be increased by deuterium operation or by ICRF instead of NI heating.<br />
A recipe for achieving the H-mode has been developed which was successfully applied to the cases<br />
of Q^ < 2, with ICRH or at high density with pellet refuelling.<br />
1 University of Washington, Seattle, WA, USA (DOE contract).<br />
2 Academy of <strong>Sciences</strong>, Leningrad, USSR.<br />
3 Present address: JET Joint Undertaking, Abingdon, Oxfordshire, UK.<br />
4 CEA, Centre d'&udes nucleaires de Grenoble, Grenoble, France.<br />
125
126 NIEDERMEYER et al.<br />
1. Density limit of gas refuelled discharges<br />
The density limit of ASDEX divertor discharges has been studied<br />
at q -values (cylindrical approximation neglecting the separa-<br />
trix) above 2.2 by ramping up the density to the disruptive<br />
limit. Feedback controlled gas puffing has been applied in<br />
ohmic <strong>and</strong> beam heated divertor discharges without gettering<br />
/1/. An increase of the density limit with additional heating<br />
was achieved both in B - or ID (1/q ) -scans(see Fig. 1). The<br />
I r a<br />
density limit, however, increases much less than proportional<br />
to the heating power. The Hugill-Murakami scaling was found to<br />
be valid in ohmic discharges but not with strong additional<br />
heating, where at given q -values M = n R/B at the density<br />
limit scales like 1//B • 3 © Xi<br />
In most cases edge cooling is believed to be responsible for<br />
the density limit. In low-q discharges (below about 2.7) the<br />
q=2 surface is obviously destabilized directly while at higher<br />
q -values thermal effects cause the current channel to shrink<br />
<strong>and</strong> as a consequence trigger the disruptive m=2-mode. In these<br />
cases the onset of marfes is always observed before the dis-<br />
charge shrinks. This kind of a two dimensional thermal<br />
instability increases edge radiation substantially <strong>and</strong> is thus<br />
strongly involved in the shrinking process.<br />
2. Pellet discharges<br />
Pellet injection as a tool for more efficient refuelling was<br />
expected to reduce edge cooling <strong>and</strong> permit higher densities. In<br />
fact an appreciable increase of the maximum density has been<br />
achieved by this method as well as an unexpected improvement of<br />
particle <strong>and</strong> energy confinement. Injection of a series of D«<br />
pellets with a centrifuge /2/, /3/ (size corresponding to an<br />
1 q _Q<br />
averaged density of 1 • 10 m , velocity of 650 m/s, repeti-<br />
tion rate less than 40 per second, penetration depth about a/2)
1/q-<br />
0.4-<br />
0.2-<br />
0<br />
Bt=19T *"»<br />
OH<br />
non-gettered<br />
a<br />
<strong>IAEA</strong>-CN-47/A-n-S 127<br />
nR/BT<br />
OH gettered ^ V<br />
y ?*<br />
, / N | 11.7 MWI<br />
S non-gettered<br />
Pellets<br />
1 OH caibonized<br />
T non-gettered<br />
B, =2.2 1<br />
FIG. 1. Maximum achievable densities for different types of divertor discharges plotted in the<br />
Hugill diagram.<br />
may cause a peaking of the density profile as already observed<br />
in experiments with smaller numbers of pellets /*»/, /5/, /6/,<br />
/7/. Penetration to the center is not necessary to get triangu-<br />
lar density profiles. Sufficient recycling, however, is a<br />
necessary condition for the onset of this regime. We attribute<br />
the change of the profile to an increased ratio of the inward<br />
drift velocity to the particle diffusion constant evidently<br />
caused by pellet injection. Unfortunately an accumulation of<br />
metal impurities in the plasma center results from the improved<br />
particle confinement <strong>and</strong> now central radiation determines the<br />
density limit. With wall carbonisation a Murakami parameter of<br />
19 20 — ^<br />
8.5 • 10 <strong>and</strong> a central density above 2 • 10 m can be<br />
achieved in ohmic discharges. Before excessive central radi-<br />
ation arises, the T -profiles are nearly unchanged compared to<br />
gas refuelling. With this strongly increased density high con-<br />
finement times of up to 160 ms in ohmic discharges are ob-<br />
tained. We surmise that the transport properties are changed as<br />
shown by the fact that triangular density profiles with nearly<br />
constant peak density are sustained for 300 ms after having<br />
stopped pellet injection. There are indications that even<br />
smaller pellet penetration depths are sufficient to cause<br />
10
128 NffiDERMEYER et al.<br />
density peaking. High power co-injection prevents peaking of<br />
the profiles. The few discharges with counter-injection per-<br />
formed so far show improved particle <strong>and</strong> energy confinement.<br />
This result <strong>and</strong> a remarkable curvature of the pellet trajec-<br />
tories as observed on photographs suggest that also during the<br />
ohmic phase toroidal plasma rotation plays an important role.<br />
3. Low-q discharges at high densities<br />
With only gas-puff refuelling a Murakami parameter of 7.2 •<br />
1 Q<br />
10 was reached in gettered divertor discharges at very low<br />
q -values of about 2 (cylindrical approximation) performed with<br />
a<br />
a plasma current near the design limit of 500 kA (Fig. 1). In<br />
earlier experiments on ASDEX a steep drop of the density limit<br />
with decreasing q has been found when approaching q = 2 in<br />
a a<br />
agreement with all known results of other tokamaks. At small<br />
q -values a strong saturated m=2-mode develops already at<br />
3.<br />
moderate densities <strong>and</strong> increases slowly with increasing density<br />
(Fig. 2). Finally it leads to a disruption. Now it has been<br />
discovered that at even smaller q -values the m=2-activity may<br />
suddenly drop to a very small level during the slow density<br />
rise (Fig. 2). It reappears again but then at much higher<br />
densities <strong>and</strong> determines the density limit, q -values of 1.9<br />
3<br />
were obtained, however, the optimum q is about 2.0. The only<br />
a<br />
difference in the external parameter settings of the two cases<br />
compared in Fig.2 is the plasma current. The attempt to raise<br />
the plasma density evidently results in an increase of MHD<br />
fluctuations for the lower plasma current, but in their<br />
decreas.e for the higher one. Due to the singularity induced by<br />
the stagnation point, the true q = 2 -surface for the two<br />
cases will always be inside <strong>and</strong> close to the separatrix, but at<br />
different locations: the qualitatively different response of<br />
the MHD signals might therefore result from the predicted<br />
reaction of tearing modes, which are stabilized by flattening
•ICQ 0<br />
500-<br />
<strong>IAEA</strong>-CN-47/A-II-5 129<br />
Us)<br />
# 19514<br />
FIG. 2. Time evolution of plasma current, mean density <strong>and</strong> MHD activity during discharges at<br />
qa = 2.15 {if = 420 kA) (top) <strong>and</strong> 2.05 (IF = 440 kA).<br />
of the current density profile (<strong>and</strong> hence by cooling) inside<br />
the resonant surface, but destabilized by it on the outside.<br />
Stable discharges with long density plateaus 5 % below the den-<br />
sity limit were run at q = 1.9. T profiles are trapezoidal<br />
a e<br />
with the flat central part extending to a/2 in ohmic discharges<br />
<strong>and</strong> high power beam heated discharges. Density profiles are<br />
parabolic in ohmic discharges, in beam heated discharges they<br />
are rather flat with a very high edge density. Confinement of<br />
ohmic discharges is good, -x is comparable to the ip-values of<br />
the saturation region away from the density limit (80 ms<br />
typically), the toroidal beta values rise with increasing<br />
density <strong>and</strong> with decreasing q . At q = 1.9, 8. = 0.61 % was<br />
3 3 L
130 NIEDERMEYER et al.<br />
Ip=0.38MA<br />
• P,c = 1.2 MW<br />
|c1.7 MW<br />
2nCK(D*/H*l<br />
2flCH OIH)<br />
0 2 4 6 8 10 0 2 4 6 8 0 2 4 6 8 10<br />
ne (10 13 cm" 3 )<br />
FIG. 3. Survey of confinement time values versus density in (a) ohmically, (b) NI <strong>and</strong> (c) ICRH heated<br />
plasmas, (a) BT = 2.2 T; gas puff: IP = 420 kA, pellet: IP = 380 kA; (b) BT = 2.2 T;<br />
(c)BT = 2.4T.<br />
reached compared to 0.43 % at q = 2.5. With beam injection at<br />
Q.<br />
a power level of 1.7 MW, L-mode confinement is being inter-<br />
rupted by short phases of the H-mode. At 2.6 MW the signature<br />
of the H-mode is more clearly pronounced. Measured confinement<br />
times of about 50 ms are only slightly higher than those<br />
expected from L-mode scaling. This might be attributed to<br />
strong impurity radiation present with high power beam heating<br />
which was not observed in ohmic discharges.<br />
4. Confinement<br />
On Asdex the most important confinement regimes which seem to<br />
be characterized by intrinsically different properties can be<br />
realized. Figure 3 summarizes density scans of the global<br />
confinement time !„ for ohmic <strong>and</strong> auxiliary heated discharges.
<strong>IAEA</strong>-CN-47/A-II-5 131<br />
The ohmic data represent pellet refuelled plasmas <strong>and</strong> scans in<br />
pure hydrogen or deuterium discharges with gas-puff refuelling.<br />
The auxiliary heated data comprise density scans of discharges<br />
in the L-regime heated either by NI or ICRH, <strong>and</strong> plasmas in the<br />
H-mode for the injection scenarios H -»• D <strong>and</strong> D •* D , <strong>and</strong><br />
finally, the result achieved in the quiescent H-mode when ELMs<br />
are suppressed /8/.<br />
The degradation of confinement with ICRH is less severe than<br />
that with NI. The reason is not clear but could be due to the<br />
better particle confinement with ICRH or the lack of toroidal<br />
rotation. Deuterium as working gas is superior to hydrogen both<br />
with ohmic <strong>and</strong> auxiliary heating. This isotope dependence im-<br />
proves the confinement of 2Q - ICRH applied to basically<br />
deuterium plasmas (with the minimum necessary hydrogen concen-<br />
tration of -20 %) or D(H) - minority heating at the fundamental<br />
frequency. Also the H-mode confinement is subject to the iso-<br />
tope effect.<br />
Pellet refuelling yields ir-values up to 160 ms /9/ <strong>and</strong> n T.,-<br />
19 , # e<br />
values up to 3.5 • 10 sm"->. In the quiescent H-mode (H ),<br />
*<br />
TE = 120 ms is found. (As the H -mode strongly suffers from<br />
impurity accumulation the core-radiation overlapping with the<br />
power deposition profile has been corrected for the -r^-analysis.<br />
M. 1. L-Regime<br />
The ohmic saturation <strong>and</strong> the L-regime are both regimes with<br />
degraded confinement. Common features are the lack of density<br />
dependence of T_ <strong>and</strong> a similar improvement with isotope mass.<br />
Another aspect common to OH-saturation <strong>and</strong> L-regime is "profile<br />
consistency" /10/: An increase of I (decrease of q ) broadens<br />
P 3<br />
the T profile in the same way. Figure *) shows the volume aver-<br />
aged electron temperature versus plasma current both for<br />
NI-heating at different heating power levels <strong>and</strong> for OH-heating<br />
for two different densities. Irrespective of the heating method
132 NIEDERMEYER et al.<br />
(keV)<br />
1.0-<br />
0.5-<br />
0.2<br />
• a 1.6 MW<br />
• A 0.4 MW<br />
> O OH<br />
0.3<br />
rp (MA)<br />
FIG. 4. Volume averaged electron temperature Te versus plasma current for different NI power levels<br />
<strong>and</strong> plasma densities. Solid symbols: fte = 2 x 10 13 cm' 3 ; open symbols: he = 3 x 10 l3 cm~ 3 .<br />
(OH or NI), increases with I in a similar way. These<br />
results indicate the same profile broadening <strong>and</strong> improvement in<br />
energy content for OH- <strong>and</strong> Nl-heated plasmas. The broadening of<br />
the Te-profile with increasing current leads ultimately to the<br />
proportinality of iv <strong>and</strong> current under auxiliary heating<br />
conditions. In the ohmic case, however, the i- of the satura-<br />
tion regime is independent of current despite the fact that the<br />
energy content also increases with current. The difference<br />
between ohmic <strong>and</strong> auxiliary heating is that in the ohmic case<br />
the heating power increases linearly with current while it is<br />
independent of current with auxiliary heating. Already under<br />
ohmic conditions, the heating power degrades confinement as it<br />
is known from auxiliary heated plasmas. Both plasma current <strong>and</strong><br />
heating power are two important parameters which determine the<br />
confinement both in the OH-saturation regime <strong>and</strong> the L-mode<br />
with the L-mode being the continuation of the OH-saturation<br />
regime towards higher power.<br />
Figure 5 shows the plasma energy content versus power for an<br />
ohmic current scan <strong>and</strong> for two Nl-power scans at two current<br />
0.4
<strong>IAEA</strong>-CN-47/A-H-5 133<br />
FIG. 5. Variation of energy content W with heating power P in Ohmic current scan <strong>and</strong> with NI at two<br />
plasma current values (the first data point of the NI scans represents the OH starting value). Curves<br />
represent non-linear relation between W <strong>and</strong> P at constant current; straight line is a fit through Ohmic<br />
data points.<br />
values. The solid lines tentatively indicate an inherent non-<br />
linear relation between W <strong>and</strong> P. Under OH conditions, this<br />
dependence is hidden, because the heating power <strong>and</strong> the plasma<br />
current rise simultaneously /11/. From this analysis it is<br />
obvious that there has to be a discontinuity of the slopes in a<br />
W versus P diagram at the transition from ohmic to auxiliary<br />
heating as shown in Fig. 5. The reason for the discontinuity is<br />
that an ohmic power scan occurs in a plane where I /P is<br />
constant; with auxiliary heating, however, a power scan is<br />
continued in an I =const. plane. The ohmic W vs. P-trace is not<br />
a scalable relation. The assumption of a special quality of 0H-<br />
heating does not seem to be justified. The reason for the<br />
current scaling which seems to be unique to all auxiliary<br />
heated plasmas at higher densities is not the introduction of a<br />
new confinement element. Rather it is the disappearance of a<br />
common element which is the dominance of the ohmic heating<br />
power <strong>and</strong> its proportionality to plasma current /10/. Therefore<br />
also in the H-mode T_ is proportional to Ip despite distinct<br />
1.6
134 NIEDERMEYER et al.<br />
differences in the development of L- <strong>and</strong> H-phases <strong>and</strong> in the<br />
absolute values of T_. The operational space with good<br />
confinement below the ohmic power is only accessible under<br />
highly efficient current drive conditions like with Lower-<br />
Hybrid heating or in non-thermal discharges. Indeed, such<br />
current drive scenarios indicate improved confinement.<br />
4.2. H-Regime<br />
Inspite of the large differences in the profile shapes there<br />
are common characteristics of the good pellet discharges <strong>and</strong><br />
the H-mode, for example the reduction of the divertor<br />
recycling, an improvement in runaway electron confinement, the<br />
tendency for impurity accumulation, <strong>and</strong> strong indications of<br />
the importance of the plasma edge conditions for confinement<br />
/12/. The H-mode is caused by the sudden development of an edge<br />
transport barrier /12/ which seems to require an edge electron<br />
temperature above 200-300 eV. The deep pellet refuelling obvi-<br />
ously prevents the detrimental effect of gas-puff refuelling on<br />
plasma edge conditions which leads to the T,, roll-over <strong>and</strong> the<br />
development of the saturation regime.<br />
Apart from the insight in the role of the plasma periphery for<br />
the H-transition a recipe for reaching the H-mode emerged from<br />
our studies. The crucial element seems to be the increase of<br />
T (edge) beyond a threshold requiring a minimal heating power<br />
(1.8 MW with NI in the double-null configuration) <strong>and</strong> giving<br />
rise to the preceding L-phase (until T (edge) is sufficiently<br />
heated up) /12/. The edge temperature threshold also causes the<br />
sensitivity of the H-transition on recycling <strong>and</strong> impurity<br />
radiation cooling. The intrinsically better confinement of deu-<br />
terium <strong>and</strong> helium facilitates the H-mode development: In pure<br />
hydrogen discharges (H -> H ) the power threshold is ~3 MW.<br />
Owing to the ion-electron coupling, the H-transition is eased<br />
when the ion temperature is also high at the edge. Because of
<strong>IAEA</strong>-CN-47/A-II-5 135<br />
these requirements, recycling has to be kept low <strong>and</strong> gas<br />
refuelling into the divertor instead of the main plasma chamber<br />
can reduce the power threshold. With low recycling, neoclas-<br />
sical ion transport may be dominant even at the plasma edge. In<br />
this case, a poloidal asymmetry of the energy sink distribution<br />
(as realized by the X-point) can reduce the ion heat transport<br />
<strong>and</strong> with it the power requirements for the H-transition /12/.<br />
In the poloidally asymmetric situation of the single null (SN)<br />
configuration, the power threshold is reduced to 1.2 MW if the<br />
ion grad-B-drift is toward the X-point. In the opposite case,<br />
the power threshold rises to ~3 MW /12/. With the X-point in<br />
the mid-plane, no improvement is expected. The above described<br />
recipe has been applied to successfully increase the oper-<br />
ational space of the H-mode. (1) In the low q -plasmas, de-<br />
scribed in Sec. 3. when additionally.edge radiation by oxygen<br />
is reduced owing to Ti-gettering, the H-mode can be realized in<br />
the most attractive corner of the Hugill-diagram (high current<br />
<strong>and</strong> high density); (2) reduced recycling in pellet refuelled<br />
discharges allowed an increase of the upper density limit of<br />
19-3<br />
the H-mode from n = 7-8 -10 m with gas puff refuelling to<br />
20 -3<br />
n > 1.1 • 10 m . (3) The application of ICRH in the<br />
deuterium dominated D(H)-minority heating scheme (instead of<br />
2flCH~heating in hydrogen) yielded the H-mode with a different<br />
heating method. In the SN-configuration, 1.7 MW ICRH-power is<br />
required. Another improvement in operational space is counter-<br />
NI which decreased the power threshold to 0.8 MW. The H-phase,<br />
however, is heavily affected by impurity accumulation <strong>and</strong><br />
therefore transient.<br />
REFERENCES<br />
[1] NIEDERMEYER, H., et al., in Controlled Fusion <strong>and</strong> Plasma Physics (Proc. 12th Europ. Conf.<br />
Budapest, 1985), Part 1, European Physical Society (1985) 159.<br />
[2] AMENDA, W., LANG, R.S., in Fusion Technology (Proc. 13th Symp. Varese, 1984), CEC,<br />
Brussels (1984) 243.
13 6 NIEDERMEYER et al.<br />
[3] AMENDA, W., LANG, R.S., to be published in J. Phys., E (London). Sci. Instrum. 19 (1986).<br />
[4] GREENWALD, M., et al., in Controlled Fusion <strong>and</strong> Plasma Physics (Proc. 11th Europ. Conf.<br />
Aachen, 1983), Part 1, European Physical Society (1983) 7.<br />
[5] SCHMIDT, G.L., et al., in Controlled Fusion <strong>and</strong> Plasma Physics (Proc. 12th Europ. Conf.<br />
Budapest, 1985), Part 2, European Physical Society (1985) 674.<br />
[6] SENGOKU, S., et al., Nucl. Fusion 25 (1985) 1475.<br />
[7] FONCK, R.J., et al., J. Nucl. Mater. 128 & 129 (1984) 330.<br />
[8] GRUBER, O., JILGE, W., BERNHARDI, H., EBERHAGEN, A., et al., in Controlled Fusion<br />
<strong>and</strong> Plasma Phys. (Proc. 12th Europ. Conf. Budapest, 1985), Vol. 1, European Physical Society<br />
(1985) 18.<br />
[9] KAUFMANN, M., Plasma Phys. Controll. Fusion 28 (1986) 1341.<br />
[10] WAGNER, F., GRUBER, O., LACKNER, K., MURMANN, H.D., SPETH, E., et al., Phys.<br />
Rev. Lett. 56 (1986) 2187.<br />
[11] WAGNER, F., et al., to be published in Nucl. Fusion.<br />
[12] WAGNER, F., et al., in Basic Physical Processes of Toroidal Fusion Plasmas (Proc. Workshop<br />
Varenna, 1985).<br />
[13] HINTON, F., Nucl. Fusion 25 (1985) 1457; WAGNER, F., BARTIROMO, R., BECKER, C,<br />
BOSCH, H.S., et al., Nucl. Fusion 25 (1985) 1490.<br />
DISCUSSION<br />
R.J. HAWRYLUK: How was qa defined?<br />
F. WAGNER: We used the cylindrical definition, so that 1/e represents the<br />
plasma current.<br />
S. YAMAMOTO: I should like to mention that in JAERI's JFT-2M, H-mode<br />
behaviour was observed in the limiter discharge with simultaneous co-NBI <strong>and</strong> 2wci<br />
ICRF. Recently, the limiter H-mode discharge was obtained with only co-NBI. In the<br />
limiter H-mode discharge, the plasma is restricted by the inside limiter only, <strong>and</strong><br />
there should be some clearance between the plasma surface <strong>and</strong> the vacuum chamber<br />
on the low field side.<br />
R.J. GOLDSTON: You showed that the power threshold for the H-mode transition<br />
was 1.2 MW for the grad-B drift in the direction of a single null divertor <strong>and</strong><br />
3 MW for the reverse configuration. Could you comment on the plasma parameters<br />
— radiated power, impurities, edge electron temperature — at, say, about 1 MW of<br />
input power in each case.<br />
F. WAGNER: The majority of the experiments were made at higher power<br />
(1.6 MW). No striking difference in these parameters has been observed in<br />
SN-discharges with different ion grad-B drift directions. But there remains the observation,<br />
even in these configurational studies, that the edge electron temperature tends<br />
to increase in the correct configuration (in grad-B drift to the X-point), causing<br />
H-transition when it exceeds a threshold of 200-300 eV.<br />
J. JACQUINOT: Can you comment on the stationary aspect of the H-mode?<br />
I am thinking of a comparison between the duration of good confinement <strong>and</strong> the<br />
duration of the heating pulse.
<strong>IAEA</strong>-CN-47/A-H-5 137<br />
F. WAGNER: At reduced power, when 0/0^ < 0.7-0.8, the H-mode<br />
remains in a quasi-steady state (parameters only modulated edge located discharges).<br />
Stationary H-mode phases have been maintained by stacking the beams for ~ 10TE.<br />
Approaching the beta limit, the confinement in the H-mode degrades after a maximum.<br />
This might be due to a reduction of the beta limit when the current profile<br />
broadens <strong>and</strong> q(0) rises on account of the high edge electron temperature.<br />
M.C. ZARNSTORFF: Could you comment on any dependence of the H-mode<br />
onset upon the angle of beam injection, i.e. co-injection versus counter-injection?<br />
F. WAGNER: The lowest power threshold for the H-transition occurs with<br />
counter-injection (~2 x P0H). Because of the tremendous impurity accumulation<br />
under these circumstances, the H-phases are short (-50 ms). The high-Z impurity<br />
problems can be avoided by wall carbonization. The required power for H-mode<br />
onset is, however, higher in this case.
STUDIES OF THE REGIME OF<br />
IMPROVED PARTICLE AND<br />
ENERGY CONFINEMENT FOLLOWING<br />
PELLET INJECTION INTO ALCATOR C<br />
M. GREENWALD, M. BESEN, F. CAMACHO, C. FIORE,<br />
M. FOORD, R. GANDY 1 , C. GOMEZ 2 , R. GRANETZ,<br />
D. GWINN, S. KNOWLTON, B. LaBOMBARD 3 ,<br />
B. LIPSCHULTZ, H. MANNING 4 , E. MARMAR,<br />
S.C. McCOOL 5 , J. PARKER 6 , R. PARKER, R. PETRASSO,<br />
P. PRIBYL 3 , J. RICE, D. SIGMAR, Y. TAKASE, J. TERRY,<br />
R. WATTERSON 4 , S. WOLFE<br />
Plasma Fusion Center,<br />
Massachusetts Institute of Technology,<br />
Cambridge, Massachusetts,<br />
United States of America<br />
Abstract<br />
<strong>IAEA</strong>-CN-47/A-ni-l<br />
STUDIES OF THE REGIME OF IMPROVED PARTICLE AND ENERGY CONFINEMENT<br />
FOLLOWING PELLET INJECTION INTO ALCATOR C.<br />
Pellet fueling in Alcator C can result in a plasma regime in which both energy <strong>and</strong> particle confinement<br />
are dramatically improved. In this regime, ion thermal losses (highly anomalous in gas fueled<br />
plasmas) are reduced to approximately neoclassical values, resulting in increased global energy confinement<br />
for high density discharges where ion losses are important. There is little or no change in electron<br />
thermal conductivity. The pellet fueled discharges exhibit peaked density profiles, which tends to confirm<br />
the importance of the ij( parameter in determining ion thermal diffusivity. At the same time,<br />
impurity particle transport is reduced to neoclassical levels, leading to accumulation of impurities <strong>and</strong><br />
strong peaking of impurity profiles. Confinement of the hydrogenic species in the discharge core is also<br />
increased. The modifications of ion thermal transport, central particle transport, <strong>and</strong> impurity transport<br />
are well correlated; there are no discharges where only one or two of these parameters change. In the<br />
favourable transport regime, sawteeth are partially or completely suppressed. This is probably due to<br />
the strong peaking of low Z impurities which flatten the central current profile by increasing the plasma<br />
resistivity. Radiation does not play an important role in the power balance of these discharges. For<br />
plasmas in which the sawteeth are suppressed, the improved confinement is sustained for the remainder<br />
of the discharge.<br />
1<br />
Auburn University, AL, USA.<br />
2<br />
Los Alamos National Laboratory, NM, USA.<br />
3<br />
University of California, Los Angeles, CA, USA.<br />
4<br />
Science Research Laboratory, Somerville, MA, USA.<br />
5<br />
Texas University, Austin, TX, USA.<br />
6<br />
Lincoln Laboratory, Lexington, MA, USA.<br />
139
140 GREENWALD et al.<br />
1. Introduction<br />
Previous work on Alcator C demonstrated that pellet fueling could<br />
increase global energy confinement in the "saturated" regime of ohmic discharges<br />
[1]. Detailed analysis showed that pellet fueling reduces ion thermal<br />
transport to levels near the predictions of neo-classical theory [2,3]<br />
(FIG. 1). It is important to note that for gas fueling in Alcator C, the<br />
ion transport is always anomalous. The confinement saturation becomes<br />
apparent at high densities where significant power is lost through the ion<br />
channel. The effect of pellets is to reduce ion losses at all densities which<br />
causes the observed increase in global confinement at high density. These<br />
results are consistent with theories of ion temperature gradient driven<br />
turbulence [4], the so-called T)I or ion-mixing modes [5,6]. Our latest experiments<br />
have concentrated on the behavior of particle transport with<br />
pellet fueling. A coherent picture has emerged, in which particle <strong>and</strong> energy<br />
confinement are inextricably linked <strong>and</strong> which may shed light on the<br />
mechanisms of anomalous transport for both electrons <strong>and</strong> ions. Recent<br />
results from ASDEX <strong>and</strong> TFTR have shown some of these same features<br />
<strong>and</strong> comparisons may yield additional insights [7,8].<br />
2. Particle transport experiments<br />
There were a number of reasons to expect little change in particle<br />
transport with pellet fueling. Conventional wisdom has linked particle<br />
Ion Transport Anomaly<br />
0.25 0.3 0.35<br />
0.4 0.45<br />
Time (sec)<br />
FIG. 1. Anomaly factor for neo-classical ion transport versus time. A single pellet is injected at 0.3 sec.
16<br />
14<br />
'"c 10<br />
<strong>IAEA</strong>-CN-47/A-III-l 141<br />
+ v<br />
Molybdenum (20 -29 ) Brightness<br />
gas fueled<br />
pellet fueled<br />
0.1 0.2 0.3 0.4<br />
Time (sec)<br />
FIG. 2. Brightness of lines from highly ionized molybdenum versus time. Pellet injection at 0.3 sec.<br />
Limiter Radius<br />
FIG. 3. Profiles of soft X-ray emission before <strong>and</strong> after injection.<br />
diffusivity to anomalous electron thermal conductivity in impurity free<br />
plasmas, (Dp oc Xe)> which is unchanged in our experiments. Empirical<br />
studies of impurity confinement in impure plasmas have shown scalings<br />
quite different from those for electron energy transport [9]:<br />
oc q Zbg<br />
0.6
142 GREENWALD et al.<br />
0.4<br />
0.2<br />
Normalized Density Profiles<br />
2 3 4<br />
minor radius (cm)<br />
FIG. 4. Carbon <strong>and</strong> molybdenum profiles inferred from X-ray data <strong>and</strong> a comparison with<br />
neo-classical theory.<br />
.3 0.8<br />
'c 3<br />
g 0.6<br />
I 01 0.4<br />
W<br />
i<br />
Decay of Injected V +20<br />
pellet fueled<br />
gas fueled -<br />
0.36 0.38 0.4 0.42 0.44 0.46 0.48 0.5 0.52<br />
Time (sec)<br />
FIG. 5. Comparison of decay limes for injected vanadium before <strong>and</strong> after pellet fueling.<br />
where mbg <strong>and</strong> Zbg are, respectively, the atomic mass <strong>and</strong> charge of the<br />
background plasma. None of the parameters in this expression is significantly<br />
altered by pellet fueling. In contrast, the experiments demonstrate<br />
that particle confinement is substantially increased by pellet fueling.<br />
Transport coefficients for hydrogen cannot be unambiguously obtained for<br />
the gas fueled discharges, but analysis of density profiles after injection
<strong>IAEA</strong>-CN-47/A-m-l 143<br />
FIG. 6. Enhancement of impurity confinement with pellet fueled density increase.<br />
shows an increase in the ratio of inward convection to diffusion <strong>and</strong> indicates<br />
an increase in central particle confinement of about a factor of 2.<br />
Densities of intrinsic impurities, mainly carbon <strong>and</strong> molybdenum,begin to<br />
increase substantially in the plasma core after pellet injection. This can<br />
be seen in FIG. 2, which shows the time history of lines of highly ionized<br />
molybdenum. The source, as indicated by the intensity of lines from low<br />
ionization states of these impurities, shows little change.<br />
Further evidence of the improved impurity confinement is seen in data<br />
from arrays of soft x-ray diodes. Radiation in this spectral range is sensitive<br />
to plasma density, temperature, <strong>and</strong> impurity concentration. After<br />
an initial drop due to plasma cooling by the pellet, the signals increase<br />
<strong>and</strong> peak strongly as the impurities build up on axis (FIG. 3). The impurity<br />
peaking is even greater than would be apparent at first glance, since<br />
the x-ray profile is dominated by the electron temperature profile before<br />
the pellet <strong>and</strong> by the impurities afterwards. Careful analysis of data from<br />
arrays with different spectral filtering has determined the time histories of<br />
profiles of carbon <strong>and</strong> molybdenum [10] <strong>and</strong> shown them to be in reasonably<br />
good agreement with the theory of neo-classical impurity transport<br />
[11] FIG. 4. Experimental values for the diffusivity D <strong>and</strong> convective<br />
velocity V of the carbon were 300 cm 2 /s <strong>and</strong> 1000 cm/s, respectively.<br />
Comparisons of plasmas before <strong>and</strong> after injection indicate that the principal<br />
change is a drop in D by about an order of magnitude.<br />
These observations are confirmed by measuring the confinement of<br />
injected impurities [12]. In these experiments, trace quantities of nonintrinsic,<br />
non-recycling impurities are injected by the laser blow-off method
144<br />
1000<br />
10<br />
0.01<br />
GREENWALD et al.<br />
At (msec)<br />
FIG. 7. Correlation ofTt, the impurity confinement time, <strong>and</strong> rTe, the relaxation time for the central<br />
electron temperature.<br />
<strong>and</strong> their time histories followed by UV <strong>and</strong> X-ray spectroscopy [9]. Figure<br />
5 shows results of such an experiment which compares the confinement of<br />
injected vanadium in pellet <strong>and</strong> gas fueled plasmas. The vanadium confinement<br />
time before injection is 16 msec,which is in agreement with the<br />
empirical scaling law. After injection, the time increases to 125 msec.<br />
(Actually, the empirical law would predict a slight decrease since in this<br />
case the deuterium plasma was diluted with hydrogen from the pellet.)<br />
Typically, the increases are factors of 5 - 20. When the increase in injected<br />
impurity confinement is plotted against the normalized density increase<br />
(An/n) a threshold is seen at about An/n = 1 (FIG. 6). This same<br />
threshold is also observed for the accumulation of intrinsic impurities, the<br />
reduction of ion thermal transport <strong>and</strong> for peaking of the electron density<br />
profile. An/n is not a unique parameter for characterizing the threshold.<br />
Because of the relationship between pellet size <strong>and</strong> ablation rate [13], the<br />
threshold could also be expressed in terms of the pellet penetration depth.<br />
This same threshold is seen in an apparently unrelated measurement,<br />
the rate of fall of the central electron temperature in the first few hundred<br />
^seconds after injection. The pellets in these experiments were injected<br />
at about 8.0 x 10 4 cm/sec <strong>and</strong> were completely evaporated after travelling<br />
less than 8-12 cm, thus they never reached the magnetic axis (or<br />
even the sawtooth mixing radius). The expected result would have been<br />
a cold annulus of plasma surrounding an unperturbed hot core. With ordinary<br />
(albeit anomalous) heat transport, Xe ~ 1 ~ 2 x 10 3 cm 2 /s, the
<strong>IAEA</strong>-CN-47/A-III-l 145<br />
relaxation time would be a few msecs. Nonetheless, the central temperature,<br />
as measured by electron cyclotron emission <strong>and</strong> Thomson scattering,<br />
typically fell much more rapidly, maintaining its shape <strong>and</strong> reaching equilibrium<br />
in as little as 100 ^tsec [14,15]. The surprising result is that the<br />
relaxation time shows the same threshold <strong>and</strong> is strictly correlated with<br />
the confinement improvements described above (FIG. 7). This observation<br />
suggests that the bifurcation in plasma regimes occurs immediately<br />
after injection. The transport analysis is consistent with models where<br />
transport coefficients change promptly at injection.<br />
3. Sawtooth effects<br />
A common feature of pellet fueled discharges is the modification of<br />
the sawtooth oscillations [16]. Typically the sawteeth continue through the<br />
injection, initially with little change in period or amplitude. Gradually the<br />
period increases, culminating in either one or more very large sawteeth or<br />
in their complete suppression. The variation in behavior is correlated with<br />
the peaking of the electron <strong>and</strong> impurity densities <strong>and</strong> thus with particle<br />
confinement; plasmas with the most peaked profiles have no sawteeth.<br />
Sorting out cause <strong>and</strong> effect is difficult. It appears that the sawteeth do<br />
not have a direct influence on the regime of particle transport but rather<br />
the reverse. As impurities peak on axis the central resistivity increases.<br />
The effect on the plasma current profile can be seen by considering the<br />
equation for the evolution of the poloidal field<br />
4TT [ dr \r
146 GREENWALD et al.<br />
Carbon Density<br />
0.05 0.1<br />
Time (msec)<br />
Safety Factor — q<br />
0.15 0.05 0.1<br />
Time (msec)<br />
FIG. 8. Contours of carbon density <strong>and</strong> plasma qfrom a simulation of impurity <strong>and</strong> current diffusion.<br />
resistivity was used for the current diffusion <strong>and</strong> the particle transport<br />
coefficients were adjusted to match experimental data. The results can be<br />
seen in FIG. 8 where contours of carbon density <strong>and</strong> plasma safety factor<br />
q are plotted against space <strong>and</strong> time. After a single pellet, injected at<br />
30 msec, the central value of q goes from an initial value of .95 to above<br />
1.0 in 25 msec. This is in agreement with our observations of sawtooth<br />
suppression. It should be noted that in the plasmas considered here, radiation<br />
has negligible effect on central power balance. We also note that<br />
sawteeth can have an indirect effect on the transport regime. If the sawteeth<br />
are not completely eliminated, they flatten the density profile <strong>and</strong><br />
the plasma reverts to the pre-injection confinement mode.<br />
4. Density limit studies<br />
Pellet injection has also provided a tool to study the physics of the<br />
density limit. For gas fueling, a limit n« oclp has been seen on most tokamaks<br />
[17]. The st<strong>and</strong>ard explanation for this limit is that high plasma<br />
densities lead to a radiative collapse of the plasma column to an unstable<br />
MHD equilibrium [18]. This explanation does not seem consistent with<br />
the relative insensitivity of the limit to auxiliary power or Zeff. (The<br />
limit considered here must be distinguished from the Murakami limit with<br />
n,. ~ B/R which is sensitive to both these factors [19].) Analysis of the<br />
density decay after pellet fueling showed that the central particle confinement<br />
degraded markedly as the density limit was approached. With<br />
pellets, the limit could be surpassed (briefly) without disruption,but the
<strong>IAEA</strong>-CN-47/A-HI-l 147<br />
FIG. 9. Density decay time after pellet injection plotted versus Jin, the average current density<br />
(MA/m 2 ) over average density (10 14 cm~ 3 ).<br />
plasma shed the excess particles extremely rapidly. Figure 9 shows the<br />
decay time vs J/ne, where J is the plasma current divided by the plasma<br />
cross-sectional area. This suggests that this density limit is due to the<br />
degradation of particle confinement, <strong>and</strong> the disruptive limit that is commonly<br />
observed with gas puffing occurs when the plasma is "choked" with<br />
gas that it cannot absorb [20]. The same scaling may explain the onset<br />
of Marfes at densities somewhat below the limit. As particle confinement<br />
degrades with respect to energy confinement, the average energy of an<br />
edge particle drops <strong>and</strong> triggers a thermal/radiative collapse.<br />
5. Discussion <strong>and</strong> Summary<br />
Several features of these experiments have implications for theories<br />
of plasma transport. The observation that ion thermal conductivity decreases<br />
as the density gradient is increased (with constant temperature<br />
profiles) is consistent with theories of the T)\ mode. However, electron<br />
thermal transport, if driven by drift wave turbulence [21,22], should increase<br />
under these conditions <strong>and</strong> this is not observed. Further, ion energy<br />
<strong>and</strong> particle transport appear to be tightly coupled <strong>and</strong> both uncoupled<br />
from electron energy confinement. Electron, ion <strong>and</strong> impurity particle<br />
fluxes are always tied through the ambipolarity constraint, with net particle<br />
flux limited by the less diffusive species. It seems reasonable that<br />
the electrons, which remain highly anomalous, are "held back" by the<br />
ions <strong>and</strong> that particle confinement is governed by the same mechanisms<br />
which determine ion energy transport. (The r)-s modes are predicted to
148 GREENWALD et al.<br />
drive particle diffusion in collisionless plasmas [23] <strong>and</strong> an inward pinch in<br />
the collisional regime [5].) The decoupling of particle <strong>and</strong> electron thermal<br />
transport might suggest that electron transport is not driven by purely<br />
electrostatic modes which would give rise to intrinsically ambipolar particle<br />
transport through the E X B drift. With this interpretation, the<br />
experimental observation can be taken as support for electron transport<br />
driven by electro-magnetic mechanisms [24].<br />
In summary, with pellet fueling we have attained a regime in which the<br />
ion species show nearly neo-classical transport. The improvement seems<br />
to be linked to steep density profiles <strong>and</strong> may be related to suppression<br />
of 7j; modes. This could have important implications for future machines<br />
as these modes are predicted to seriously degrade ion energy confinement<br />
as the reactor regime is approached. On the other h<strong>and</strong>, suppression of<br />
this turbulence <strong>and</strong> the ensuing neo-classical accumulation of impurities<br />
presents problems for long pulse ignited plasmas.<br />
ACKNOWLEDGEMENT<br />
This work was supported by the United States Department of Energy, under<br />
Contract No. DE-AC02-78ET51013.<br />
REFERENCES<br />
[1] GREENWALD, M., et al., Phys. Rev. Lett. S3 4 (1984) 352.<br />
[2] WOLFE, S., et al., Nucl. Fusion 26 (1986) 329.<br />
[3] CHANG, C.S., HINTON, F.L., Phys. Fluids 25 9 (1982) 1493.<br />
[4] LEE, G.S., DIAMOND, P.H., Rep. IFSR-209, Institute for Fusion Studies, Texas Univ., Austin<br />
(1986); Phys. Fluids 29 10 (1986) 3291.<br />
[5] COPPI, B., SPIGHT, C, Phys. Rev. Lett. 41 8 (1978) 551.<br />
[6] ANTONSEN, T.( COPPI, B., ENGLADE, R., Nucl. Fusion 19 (1979) 641.<br />
[7] KAUFMANN, M., in Controlled Fusion <strong>and</strong> Plasma Heating (Proc. 13th Europ. Conf.<br />
Schliersee, 1986), Vol. 28, No. 9A, European Physical Society (1986) 1341.<br />
[8] SCHMIDT, G.L., MILORA, S.L., et al., in Controlled Fusion <strong>and</strong> Plasma Physics (Proc. 12th<br />
Europ. Conf. Budapest, 1985), Vol. 2, European Physical Society (1985) 674.<br />
[9] MARMAR, E., et al., Nucl. Fusion 22 (1982) 1567.<br />
[10] PETRASSO, R., et al., Phys. Rev. Lett. 57 6 (1986) 707.<br />
[11] HIRSHMAN, S.P., SIGMAR, D.J., Nucl. Fusion 21 (1981) 1079.<br />
[12] TERRY, J., et al., Particle Transport Following Pellet Injection into the Alcator C Tokamak,<br />
Rep. PFC/JA-86-23, Plasma Fusion Center, Massachusetts Inst. of Tech., Cambridge (1986).<br />
[13] MILORA, S.L., FOSTER, C.A., et al., Nucl. Fusion 20 (1980) 1491.<br />
[14] GREENWALD, M., et al., in Controlled Fusion <strong>and</strong> Plasma Physics (Proc. 11th Europ. Conf.<br />
Aachen, 1983), Vol. 1, European Physical Society (1983) 7.
<strong>IAEA</strong>-CN-47/A-IH-l 149<br />
[15] GOMEZ, C., Study of Electron Temperature Evolution during Sawtoothing <strong>and</strong> Pellet Injection<br />
Using Thermal Electron Cyclotron Emission in the Alcator C Tokamak, Rep. PFC/RR-86-8,<br />
Plasma Fusion Center, Massachusetts Inst. of Tech., Cambridge (1986).<br />
[16] GREENWALD, M., et al., in Plasma Physics <strong>and</strong> Controlled <strong>Nuclear</strong> Fusion Research 1984<br />
(Proc. 10th Int. Conf. London, 1984), Vol. 1, <strong>IAEA</strong>, Vienna (1985) 45.<br />
[17] AXON, K.B., et al., in Plasma Physics <strong>and</strong> Controlled <strong>Nuclear</strong> Fusion Research 1980 (Proc. 8th<br />
Int. Conf. Brussels, 1980), Vol. 1, <strong>IAEA</strong>, Vienna (1981) 413.<br />
[18] WESSON, J., et al., in Controlled Fusion <strong>and</strong> Plasma Physics (Proc. 12th Europ. Conf.<br />
Budapest, 1985), Vol. 1, European Physical Society (1985) 147.<br />
[19] MURAKAMI, M., CALLEN, J.D., BERRY, L.A., Nucl. Fusion 16 (1976) 347.<br />
[20] GREENWALD, M., et al., A New Look at Density Limits in Tokamaks, Rep. PFC/JA-86-22,<br />
Plasma Fusion Center, Massachusetts Inst. of Tech., Cambridge (1986).<br />
[21] PERKINS, F., in Heating in Toroidal Plasmas (Proc. 4th Int. Symp. Rome, 1984), Vol. 2, ISPP<br />
<strong>and</strong> ENEA (1984) 977.<br />
[22] TANG, W., et al., in Plasma Physics <strong>and</strong> Controlled <strong>Nuclear</strong> Fusion Research 1984 (Proc. 10th<br />
Int. Conf. London, 1984), Vol. 2, <strong>IAEA</strong>, Vienna (1985) 213.<br />
[23] DIAMOND, P.H., presented at Int. Workshop on Small Scale Turbulence in Magnetized<br />
Plasmas, Cargese, July 1986.<br />
[24] CALLEN, J.D., Phys. Rev. Lett. 39 24 (1977) 1540.<br />
DISCUSSION<br />
F. WAGNER: rE in the Ohmic saturation regime depends on the isotopic mass<br />
of the target plasma. It had been shown in the ALCATOR <strong>and</strong> ASDEX devices that<br />
TE is smaller for hydrogen than for deuterium. This scaling is different from the<br />
scaling of neoclassical ion transport <strong>and</strong> I wonder whether the ion transport in the<br />
saturation regime should be described by an enhancement factor \^ c -<br />
M. GREENWALD: I agree. I don't think ion transport at levels that are three<br />
to six times those of neoclassical transport is really neoclassical. It is simply a way<br />
to benchmark the discrepancy between experiment <strong>and</strong> theory. In our experiments,<br />
the anomalous ion confinement does not have neoclassical scaling either concerning<br />
the plasma current or the isotope chosen.<br />
M. KAUFMANN: I would like to comment on your statement that the<br />
improved energy confinement in pellet fuelled discharges might be due to -qc. On<br />
ASDEX we also observed that confinement was enhanced while the temperature profile<br />
remained unchanged. In cases with relatively small pellets <strong>and</strong> moderate penetration<br />
we found a remarkable improvement in the particle confinement as well as in<br />
the energy confinement before ^ changed.
CONFINEMENT STUDIES OF<br />
ADDITIONALLY HEATED PLASMA<br />
IN THE JFT-2M TOKAMAK<br />
K. ODAJIMA, A. FUNAHASHI, K. HOSHINO, S. KASAI,<br />
T. KAWAKAMI, H. KAWASHIMA, T. MATOBA,<br />
T. MATSUDA, H. MATSUMOTO, Y. MIURA, M. MORI,<br />
H. OGAWA, T. OGAWA, H. OHTSUKA, S. SENGOKU,<br />
T. SHOJI, N. SUZUKI, H. TAMAI, Y. UESUGI,<br />
T. YAMAMOTO, T. YAMAUCHI, M. HASEGAWA 1 ,<br />
S. TAKADA 2 , K. HASEGAWA, A. HONDA, I. ISHIBORI,<br />
T. KASHIMURA, Y. KASHIWA, M. KAZAWA,<br />
K. KIKUCHI, Y. MATSUZAKI, K. OHUCHI, H. OKANO,<br />
T. SHIBATA, T. SHIBUYA, T. SHIINA, K. SUZUKI,<br />
T. TANI, K. YOKOYAMA<br />
Japan Atomic Energy Research Institute,<br />
Tokai-mura, Naka-gun, Ibaraki-ken, Japan<br />
Abstract<br />
<strong>IAEA</strong>-CN-47/A-m-2<br />
CONFINEMENT STUDIES OF ADDITIONALLY HEATED PLASMA IN THE JFT-2M<br />
TOKAMAK.<br />
The H-mode can be achieved in NBI <strong>and</strong>/or ICRF heated open divertor discharges, <strong>and</strong> an<br />
H-transition with improved energy confinement is also observed in limiter discharges with both heating<br />
methods. The gross energy confinement time TEC in the H-mode recovers that of the Ohmic plasma.<br />
A large improvement in gross energy confinement is also observed after injection of a single pellet into<br />
an NBI heated plasma, where during the first 40 ms after pellet injection 70% of the NBI power is stored<br />
in the plasma. TEG reaches 70 ms, which is about twice the Ohmic value. In an additionally heated<br />
plasma, the incremental stored energy behaves as if it had its own energy confinement time Tad, which<br />
is independent of the heating power. In some cases of H-modes, rad is equal to the doubled L-mode<br />
value.<br />
1. INTRODUCTION<br />
Recent additional heating experiments in JFT-2M have been devoted to the<br />
improvement of energy confinement <strong>and</strong> to the underst<strong>and</strong>ing of its properties during<br />
additional heating. This paper reports the achievement of the H-mode in both diverted<br />
<strong>and</strong> limiter bounded discharges, with NBI <strong>and</strong>/or ICRF heating, <strong>and</strong> of improved<br />
confinement with pellet injection. The confinement properties of the H- <strong>and</strong> L-modes<br />
are discussed on the basis of the concept of stored energy.<br />
1 Mitsubishi Electric Corp., Tokyo, Japan.<br />
2 Mitsubishi Electric Computer System Corp., Tokyo, Japan<br />
151
152 ODAJIMA et al.<br />
2. EXPERIMENTAL ARRANGEMENT<br />
JFT-2M is a tokamak with a D-shaped vacuum vessel of major radius 1.31 m,<br />
inside which both D-shaped limiter <strong>and</strong> open single or double null divertor configurations<br />
have been realized [1]. The minor radius a is 0.35 m with full size D-shaped<br />
limiter <strong>and</strong> 0.26 m for the smallest diverted discharges. The divertor plates <strong>and</strong> both<br />
the fixed poloidal <strong>and</strong> the movable rail limiters are made of graphite. The working<br />
gas is deuterium in the H° NBI heating experiment or mixed gas (H/D = 0.4) in the<br />
ICRF heating experiments. NBI heating experiments using hydrogen gas as a<br />
working gas exhibit the same phenomena as are described in this paper, except for<br />
a slightly poorer confinement <strong>and</strong> a slightly higher threshold power for the transition.<br />
The ICRF heating power PICH = PG(Rp—Rv)/Rp by definition, where RP <strong>and</strong><br />
Rv are the loading resistance of the antennas, with <strong>and</strong> without plasma,<br />
respectively, <strong>and</strong> the PG is the generator output power. The NBI heating power PNB]<br />
is defined by PNB] = PtOruS-Pioss> where Ptonis is the measured input power to the<br />
torus <strong>and</strong> P,oss represents the shinethrough, ion orbit <strong>and</strong> charge exchange losses.<br />
P,oss is calculated to be 0.1P,orus. The total stored energy WT is determined from<br />
/3p [=A - (^- l)/2] by a poloidal magnetic field fitting code using 24 magnetic<br />
probes <strong>and</strong> eight saddle loops [1] <strong>and</strong> the value determined in this way is crosschecked<br />
by a diamagnetic measurement.<br />
3. ACHIEVEMENT OF H-MODE<br />
JFT-2M has achieved the H-mode in the open divertor configuration with NBI<br />
heating [2]. Later, H-like transitions were observed not only in ICRF heated, open<br />
divertor discharges [3], but also in D-shaped, limiter bounded plasmas [4].<br />
Figure 1-A shows an example for H-transition (thick line) with ICRF heating. After<br />
reaching the quasi-steady state, WT increases again simultaneously with an abrupt<br />
decrease in the Ha/Da line emission. Following the transition, the electron density<br />
ne increases, which is in contrast to the case without transition. The radiation losses<br />
PR after an initial small dip also increase strongly. As is shown in Fig. 1-A-e, an<br />
increased emission from highly ionized metals near the centre correlates with<br />
increased radiation losses in spite of a decrease in the emission from metals in the<br />
low ionization states (Fig. 1-A-f). This indicates a decrease in the impurity influx <strong>and</strong><br />
an impurity accumulation by the improved confinement. The dip in PR at the transition<br />
is due to the sudden decrease of the impurity influx, at first overcompensating<br />
the increase of the radiation loss due to central accumulation.<br />
In The case of D-shaped limiter discharges, an example for H-like transition is shown<br />
in Fig. 1-B (thick lines). For the H-transition in a limiter discharge, an inner shift<br />
of the plasma is necessary. Following the abrupt decrease of the Ha/Da line<br />
emission, we also observe an increase in WT, n,. <strong>and</strong> PR. At the transition, PR also<br />
dips briefly. These observations clearly show that the transition has the same properties<br />
as are observed in diverted discharges. In some cases, ELM-like spikes [5] in
<strong>IAEA</strong>-CN-47/A-I1I-2<br />
FIG. 1. Temporal behaviour of plasma parameters of: (A) 0.74 MW, ICRF heated H-mode in single<br />
null diverted discharge. IP = 220 kA, BT - 1.27 T, a = 0.30 m, K = 1.4 (note that line emission of<br />
Fe X is obtained in different shots, where the H-transition occurs at different times); (B) H-like transition<br />
in limiter D-shaped discharge with 0.65 MWNBI. 1P = 220 kA, BT = 1.18 T, a = 0.32 m, K = 1.4,<br />
Tlb is measured at R = 1.03 m (limiter at R = 0.96 m); (C) Improvement after injection of single pellet<br />
into 0.7 MW, NBI heated divertor discharge. IP = 220 kA, a = 0.26 m, K = 1.4. Traces of ne are at<br />
central chord for the larger values <strong>and</strong> at r = 21 cm chord for the smaller ones.<br />
the H^/DQ, emission are observed, <strong>and</strong> the appearance of the spikes suppresses the<br />
further increase in stored energy <strong>and</strong> radiation losses.<br />
In Fig. 1-B-e, the electron temperature near the edge of the plasma Teb is<br />
shown. At the transition, Teb increases abruptly, which indicates the formation of a<br />
temperature pedestal. The line average density traces in Figs 1-A-c <strong>and</strong> 1-B-c suggest<br />
the formation of a density pedestal: at the transition, the line density n
154 ODAJIMA et al.<br />
0.6 Single-null<br />
ne (io l9 m~ 3 )<br />
FIG. 2. (A) Threshold power for H-transition Plh versus cylindrical q value, q^; (B) Gross energy<br />
confinement time TEG as a function ofne in H- <strong>and</strong> L-modes. The improvement with pellet injection is<br />
also plotted. IP = 220 kA, BT = 1.18 T, a = 0.26 m, K = 1.4, PNBI = 0.7 MW.<br />
null diverted <strong>and</strong> 0.5 MW for limiter discharges <strong>and</strong> is roughly the same for NBI <strong>and</strong><br />
ICRF heating. A low qa value is more favourable to the transition <strong>and</strong> the threshold<br />
power decreases as qa decreases as is shown in Fig. 2-A.<br />
4. IMPROVED CONFINEMENT WITH PELLET INJECTION<br />
Confinement improvement is also observed transiently with pellet injection into<br />
an NBI heated divertor discharge [6], as is shown in Fig. 1-C. If a single pellet is<br />
injected before the H-transition occurs, the stored energy starts increasing linearly.<br />
During the first 40 ms after pellet injection, about 70% of NBI power is stored in<br />
the plasma. WT reaches 35 kJ, <strong>and</strong> then the plasma collapses, because of the growth<br />
of an MHD instability. The gross energy confinement time, rEG, defined as<br />
TEQ = WT/(PT - WT), increases up to 70 ms (Fig. 1-C-e), which is about three<br />
times as high as Kaye-Goldston scaling [7] <strong>and</strong> is twice the Ohmic value at the same<br />
density. For a smaller pellet, WT also increases linearly with the same slope, but<br />
then saturates abruptly, following the growth of an MHD fluctuation. This saturation<br />
level of WT is almost the same as the value achieved in the gas fuelled H-mode.<br />
5. CONFINEMENT PROPERTIES IN H- AND L-MODES<br />
The gross energy confinement times, TEG, of the H- <strong>and</strong> L-modes are plotted<br />
as a function of n^ in Fig. 2-B. The improvement by pellet injection is also shown<br />
in this figure. The NBI heating power is 0.7 MW, which is four to five times the<br />
Joule heating power. To obtain the L-mode at the same heating power for the sake<br />
of comparison, a lower rail limiter is inserted near the separatrix. In the optimized<br />
H-mode, TEG is almost the same as in an Ohmic plasma over the whole density<br />
range, which is in contrast to the deterioration in the L-mode plasma.
<strong>IAEA</strong>-CN-47/A-IH-2 155<br />
PT(MW)<br />
FIG. 3. (A) Total stored energy WT as a Junction of nc, for the scone conditions as in Fig. 2-B;<br />
(B) Total stored energy WT as a function of total input power PT in H- <strong>and</strong> L-modes with NBI heated,<br />
single null divertor discharge, witha = 0.28 m <strong>and</strong> K = 1.45 (note that the L-<strong>and</strong> H-data are at different<br />
plasma currents, but for lr > 200 kA, in the L-mode, the dependence of r^ on current<br />
is weak).<br />
If we study the confinement properties from the point of view of the total stored<br />
energy, we see some features of the energy confinement. Figure 3-A shows WT as<br />
a function of n,.. The dependence of WT on density with additional heating parallels<br />
that in the Ohmic phase. This indicates that the following model is pausible:<br />
WT = W0H + Wad, where WOH is the stored energy of the Ohmic base plasma <strong>and</strong><br />
Wad is the incremental stored energy from the additional heating with its own<br />
confinement time, rad (= AWT/APT|St=consl). Earlier experiments in JFT-2M have<br />
shown that rad is almost indepent of n,. <strong>and</strong> Ip(>200 kA) as well as of PT in the<br />
L-mode [8]. Taking into account the above model, we infer, from Fig. 3-A, the<br />
following features of energy confinement: (1) If h^ is affected by the heating, then<br />
the increase in WT becomes the sum of Wad <strong>and</strong> AWOH (because of its dependence<br />
on density); therefore, the apparent increase in WT is affected by the change in n^;<br />
(2) in the high n,, region, where the increase in W0H with % saturates <strong>and</strong>/or in the<br />
high Pad region, where Wad > W0H, WT <strong>and</strong> rEG are independent of n^; (3) in the<br />
low density region, where TOH « rad, no deterioration of rEG with additional heating<br />
is seen, as compared to TOH> this can also be seen from the L-mode of Fig. 2-B,<br />
where TEG, with additional heating, approaches TOH with decreasing %.<br />
In the H-mode, the incremental stored energy, Wad, of the plasma can amount<br />
to the double value of that of the L-mode plasma, as is shown in Fig. 3-A. Figure 3-B<br />
shows WT versus PT with fixed n,. om the H- <strong>and</strong> L-modes in NBI heated, diverted<br />
discharges. The power dependence of WT is almost linear, <strong>and</strong> the slope gives<br />
Tad = 27 ms <strong>and</strong> Tad = 12.5 ms, for the H- <strong>and</strong> L-modes, respectively. In the case<br />
of Fig. 3-B, the H-transition, thus, improves rad by a factor of two. In the other<br />
cases, the improvement factor takes different values <strong>and</strong> is closely correlated with the<br />
decrease in Ha/Da emission. A large decrease in the Ha/Do emission yields good<br />
improvement, <strong>and</strong> a small decrease, or a spiked emission, results in poor<br />
improvement.<br />
(8)
156 ODAJIMAetal.<br />
6. SUMMARY AND DISCUSSIONS<br />
(1) An H-mode plasma is demonstrated in NBI <strong>and</strong>/or ICRF heated open divertor<br />
discharges, <strong>and</strong> an H-like transition with improved energy confinement is also<br />
observed in limiter discharges with both heating methods, separately <strong>and</strong><br />
combined. Therefore, we may conclude that the H-transition does not depend<br />
on the microscopic nature of the heating method, <strong>and</strong> that a diverted magnetic<br />
configuration is not a necessary condition for an H-transition.<br />
(2) A large improvement in gross energy confinement is observed after injection of<br />
a single pellet into an NBI heated plasma, where during the first 40 ms after<br />
pellet injection 70% of the NBI power is stored in the plasma. TEG reaches<br />
70 ms, which is twice the Ohmic value.<br />
(3) At the H-transition, suddenly temperature <strong>and</strong> density pedestals are formed<br />
before the total stored energy increases. This fact suggests that the energy <strong>and</strong><br />
particle transport near the plasma edge are abruptly improved at the transition.<br />
If this is really the case, the H-transition provides evidence that the energy<br />
confinement of the tokamak is determined by transport effects in the edge region<br />
of the plasma [9, 10].<br />
(4) In an additionally heated plasma, the incremental stored energy behaves as if<br />
it had its own energy confinement time Tad, which is independent of the heating<br />
power. In some cases to the H-mode, rad is doubled with respect to the<br />
L-mode.<br />
ACKNOWLEDGEMENTS<br />
The authors are grateful to Drs M. Tanaka, K. Tomabechi, <strong>and</strong> S. Mori for continuous<br />
encouragement. They also thank Dr. J.-M. Noterdaeme for useful<br />
discussions.<br />
REFERENCES<br />
[1] SHOJI, T., et al., in Controlled Fusion <strong>and</strong> Plasma Physics (Proc. 11th Europ. Conf. Aachen,<br />
1983), Vol. 1, European Physical Society (1983) 55.<br />
[2] SENGOKU, S., et al., Confinement <strong>and</strong> fuelling studies during additional heating phase in<br />
JFT-2M tokamak, in Plasma-Surface Interaction (Proc. 7th Conf. Princeton, 1986), to be<br />
published in J. Nucl. Mater.<br />
[3] MATSUMOTO, H., et al., Improved Confinement during ICRF Heating on JFT-2M,<br />
Rep. JAERI-M-86-147 (submitted to Nucl. Fusion).<br />
[4] SENGOKU, S., et al., Regime of improved confinement in neutral-beam-heated limiter discharge<br />
of the JFT-2M tokamak, submitted to Phys. Rev. Lett.<br />
[5] WAGNER, F., et al., Phys. Rev. Lett. 42 (1982) 1408.<br />
[6] MIURA Y., et al., Characteristics of Improved Confinement <strong>and</strong> High Beta in Pellet <strong>and</strong> Neutral-<br />
Beam Injected Single Null Divertor Discharges of the JFT-2M Tokamak, Rep. JAERI-M-86-148,<br />
Japan Atomic Energy Research Institute, Tokyo (1986).
<strong>IAEA</strong>-CN-47/A-III-2 15 7<br />
[7] KAYE, S.M., GOLDSTON, R.J., Nucl. Fusion 25 (1985) 65.<br />
[8] ODAJIMA, K., et al., Scaling of incremental energy confinement time in the JFT-2M, to be<br />
published in Phys. Rev. Lett.<br />
[9] OHYABU, N., et al., Nucl. Fusion 23 (1986) 593.<br />
[10] FURTH, H.P., Plasma Phys. Controll. Fusion 28 (1986)1305.<br />
DISCUSSION<br />
K. McGUIRE: In your H-mode limiter discharges, does the plasma contact the<br />
inner limiter during the H-mode phase <strong>and</strong> is the inner shift of the plasma important<br />
in obtaining the H-mode in limiter discharges?<br />
K. ODAJIMA: Yes, in our H-mode limiter discharges the plasma is bounded<br />
only by the inner limiter <strong>and</strong> is always in contact with the limiter during the H-phase.<br />
But we cannot really say whether a point contact with the limiter or a separation from<br />
the outer limiter is important or not to obtain the H-mode.<br />
J. JACQUINOT: Have your observed the H-mode with circular plasmas lying<br />
on the inner wall?<br />
K. ODAJIMA: Yes, we have observed H-transition in circular plasmas with<br />
ICRF heating.<br />
A. GONDHALEKAR: In your pellet injection experiments, there is an apparent<br />
increase in the energy confinement time. The duration of the apparent increased<br />
confinement is shorter than the confinement time itself. What significance do you<br />
attach to this increase in energy confinement time?<br />
K. ODAJIMA: The saturation value of WT before the collapse is almost the<br />
same as that in gas fuelled H-mode discharges or slightly higher. Hence, no improvement<br />
has been brought about in the steady state phase with pellet injection so far.
INITIAL RESULTS<br />
FROM THE Dffl-D TOKAMAK*<br />
<strong>IAEA</strong>-CN-47/A-HI-3<br />
J. LUXON, P. ANDERSON, F. BATTY 1 , C. BAXI, G. BRAMSON,<br />
N. BROOKS, B. BROWN, B. BURLEY, K.H. BURRELL, R. CALLIS,<br />
G. CAMPBELL, T. CARLSTROM, A. COLLERAINE, J. CUMMINGS,<br />
L. DAVIS, J. DeBOO, S. EJIMA, R. EVANKO, H. FUKUMOTO 2 , R. GALLIX,<br />
J. GILLELAND, T. GLAD, P. GOHIL, A. GOOTGELD, R.J. GROEBNER,<br />
S. HANAI 3 , J. HASKOVEC, E. HECKMAN, M. HEIBERGER, F.J. HELTON,<br />
P. HENLINE, D. HILL 4 , D. HOFFMAN 1 , E. HOFFMANN, R. HONG,<br />
N. HOSOGANE 5 , C. HSIEH, G.L. JACKSON, G. JAHNS, G. JANESCHITZ 6 ,<br />
E. JOHNSON, A. KELLMAN, J.S. KIM, J. KOHLI, A. LANGHORN, L. LAO,<br />
P. LEE, S. LIGHTNER, J. LOHR, M. MAHDAVI, M. MAYBERRY,<br />
B. McHARG, T. McKELVEY, R. MILLER, C.P. MOELLER, D. MOORE,<br />
A. NEREM, P. NOLL 7 , T. OHKAWA, N. OHYABU, T. OSBORNE,<br />
D. OVERSKEI, P. PETERSEN, T. PETRIE, J. PHILLIPS, R. PRATER,<br />
J. RAWLS, E. REIS, D. REMSEN, P. RIEDY, P. ROCK, K. SCHAUBEL,<br />
D. SCHISSEL, J. SCOVILLE, R. SERAYDARIAN, M. SHIMADA 5 , T. SHOJI 5 ,<br />
B. SLEAFORD, J. SMITH, Jr., P. SMITH, T. SMITH, R.T. SNIDER,<br />
R.D. STAMBAUGH, R. STAV, H. St. JOHN, R. STOCKDALE, E.J. STRAIT,<br />
R. STREET, T.S. TAYLOR, J. TOOKER, M. TUPPER, S.K. WONG,<br />
S. YAMAGUCHI 8<br />
GA Technologies Inc.,<br />
San Diego, California,<br />
United States of America<br />
Abstract<br />
INITIAL RESULTS FROM THE DIII-D TOKAMAK.<br />
The DIII-D tokamak was designed to exploit both (a) the strong dependence of limiting beta<br />
values <strong>and</strong> plasma energy confinement on high current, <strong>and</strong> (b) the effectiveness of the divertor configuration<br />
in obtaining good confinement. Initial operation of the device has resulted in Ohmic confinement<br />
(r = 150 ms) comparable to that of other large tokamaks <strong>and</strong> in low levels of plasma impurities<br />
(Zefr = 1.5 at ne = 6 x 10" m~ 3 ). Both single null divertor <strong>and</strong> elongated dee shaped limiter<br />
plasmas have been produced. The paper reports both attaining H-mode confinement during beam heating<br />
of plasmas in open divertor configurations <strong>and</strong> values of the Troyon scaling quantity (I/aB « 2) large<br />
enough to allow future studies of beta limits in regimes heretofore unattainable.<br />
* Work sponsored by the United States Department of Energy, under Contract No.<br />
DE-AC03-84ER51044, <strong>and</strong> by the Japan Atomic Energy Research Institute, under a<br />
co-operative agreement.<br />
1<br />
Oak Ridge National Laboratory, Oak Ridge, TN, USA.<br />
2<br />
On leave from Hitachi Ltd., Japan.<br />
3<br />
On leave from Toshiba Corp., Japan.<br />
4<br />
Lawrence Livermore National Laboratory, Livermore, CA, USA.<br />
5<br />
Japan Atomic Energy Research Institute, Japan.<br />
6<br />
Euratom-IPP Association, Max-Planck-Institut fur Plasmaphysik, Garching,<br />
Fed. Rep. Germany.<br />
7<br />
JET Joint Undertaking, Abingdon, Oxfordshire, United Kingdom.<br />
8<br />
On leave from Mitsubishi Electric Corp., Tokyo, Japan.<br />
159
160<br />
1. INTRODUCTION<br />
LUXON.et al.<br />
The DIII-D device has been in operation since February 1986 [l],<br />
<strong>and</strong> is now operating at parameters comparable to other large tokamaks.<br />
Doublet III [2,3,4] <strong>and</strong> other devices have demonstrated the role of plasma<br />
current in attaining high beta <strong>and</strong> good confinement, <strong>and</strong> the importance<br />
of the divertor in attaining regimes of good confinement with neutral beam<br />
heating. The DIII-D was designed to exploit this underst<strong>and</strong>ing.<br />
DIII-D is a non-circular cross section, low aspect ratio tokamak<br />
designed to achieve high performance in a modest sized device (Fig. 1)<br />
[l]. The parameters of the device are presented in Table I. The indicated<br />
design capability of the device is attainable with additional shaping power<br />
supplies, auxiliary plasma heating, <strong>and</strong> internal vessel protection armor.<br />
L 2 m<br />
DHMIC HEATING COIL<br />
TOROIDAL<br />
FIELD COILS<br />
PORT<br />
ACCESS<br />
LIMITER<br />
^PUMPED)<br />
TOROIDAL<br />
FIELD<br />
COIL BUS<br />
COIL&<br />
.VESSEL<br />
SUPPORT<br />
VACUUM<br />
VESSEL<br />
POLOIDAL HELD COILS<br />
FIG. 1. Cross-section of the DIII-D device. Areas not shown in gray are new. Superimposed is the<br />
MHD equilibrium of a high beta divertor discharge (Fig. 3 at 2280 ms).
TABLE I. Dlll-D PARAMETERS<br />
Major radius (m)<br />
Minor radius (m)<br />
Vessel elongation<br />
Aspect ratio<br />
Maximum toroidal field on axis (T)<br />
Maximum plasma current (MA)<br />
Limiter<br />
Divertor<br />
Neutral beam power (MW)<br />
Neutral beam pulse length (s)<br />
ICRH power at 30-60 MHz (MW)<br />
ECH power at 60 GHz (MW)<br />
<strong>IAEA</strong>-CN-47/A-III-3 16]<br />
Oct.<br />
1986<br />
1.67<br />
0.67<br />
2.0<br />
2.5<br />
2.2<br />
2.5<br />
2.0<br />
6<br />
0.4<br />
—<br />
—<br />
1987<br />
1.67<br />
0.67<br />
2.0<br />
2.5<br />
2.2<br />
3.5<br />
2.5<br />
12<br />
0.7<br />
2<br />
1.8<br />
Design<br />
Capability<br />
1.67<br />
0.67<br />
2.0<br />
2.5<br />
2.2<br />
Neutral beam injection is the principal source of auxiliary heating<br />
power. The beamlines have been reconstructed to improve beam transmission<br />
<strong>and</strong> to accommodate the new 5 sec sources which are now being<br />
delivered. The beamlines inject at an average angle of 19.5° from radial<br />
in the co-direction. The results reported here were obtained using two of<br />
the beamlines fitted with 0.5 sec sources producing up to 6.0 MW of power<br />
at energies up to 70 keV for 0.45 sec pulses into the plasma. Conversion<br />
to long pulse sources with a capability of up to 14 MW of power should<br />
be complete in the spring of 1987.<br />
2. NON-CIRCULAR PLASMA PRODUCTION AND SHAPING<br />
Both divertor <strong>and</strong> limiter plasmas with elongations up to 2.1 have<br />
been formed in the device (Fig. 2). The shape <strong>and</strong> position of the plasma<br />
is controlled by the 18 independently powered shaping coils. The low<br />
error fields <strong>and</strong> precise field nulling which can be attained with the coil<br />
system allows discharges to be routinely initiated with one-turn voltages<br />
of 11 volts or less. Owing to the small amount of field due to the ohmic<br />
heating coil in the plasma region <strong>and</strong> the precise control afforded by the<br />
plasma shaping coils, the chosen plasma configuration can be maintained<br />
over the entire duration of the discharge. The position, elongation <strong>and</strong><br />
triangularity are separately controlled, <strong>and</strong> the plasmas exhibit no vertical<br />
instability over the range of configurations tested (K — 1.2 to 2.1).<br />
5.0<br />
3.5<br />
14<br />
5<br />
20<br />
10
162 LUXON et al.<br />
D<br />
CT<br />
FIG. 2. MHD equilibrium cross-sections for Ohmic discharges produced in DIII-D. (a) K = 1.2<br />
limiter discharge, (b) K = 2.1 dee shaped discharge, (c) double null divertor, (d) single null divertor.<br />
Single null divertor configurations have been obtained with elongations<br />
K from 1.6 to 1.97 <strong>and</strong> triangularities of up to 0.35. The separatrix<br />
flux surfaces intersect two toroidal b<strong>and</strong>s of graphite armor at the bottom<br />
of the vacuum vessel (see Fig. 1). The spacing between the X-point <strong>and</strong><br />
the vessel bottom is controlled to an accuracy of 1 cm within a range of<br />
from 8 to 30 cm. Currents of as high as 2.0 MA have been achieved in<br />
divertor configurations, <strong>and</strong> currents of 1 MA have been maintained for<br />
4 sec. Values of I/aB of up to 1.9 have been attained (q* = 3.3), making<br />
them particularly attractive for auxiliary heating. Double null divertor<br />
configurations have also been produced, but extensive use of these configurations<br />
must await the installation of protective armor in the upper<br />
inside corner of the vacuum vessel.<br />
Limiter plasma configurations have been obtained with elongations<br />
of from 1.2 to 2.1. These discharges have been run on both the inside<br />
wall graphite armor <strong>and</strong> the outside limiters. A current of 2.5 MA has<br />
been achieved using the dee-shaped configuration of Fig. 2 with a flattop<br />
duration of 0.5 sec. This resulted in I/aB = 1.8 with q$ =4.1 <strong>and</strong><br />
triangularity of 6 = 0.5.<br />
The flux necessary to reach a given plasma current is supplied by<br />
both the ohmic heating coil (total capacity 12 V-s) <strong>and</strong> the plasma shaping<br />
system which contributes about 1.0 V-s/MA essentially from the vertical<br />
field. The flux required from the ohmic heating coil transformer is found to<br />
be 2.1 V-s/MA <strong>and</strong> constant over a variety of plasma shapes <strong>and</strong> currents.<br />
This indicates adequate flux is available to reach plasma currents of 5 MA.<br />
(c)<br />
O<br />
D
3. CONFINEMENT AND PLASMA HEATING<br />
<strong>IAEA</strong>-CN-47/A-HI-3 163<br />
Vessel cleanup has progressed significantly in the last nine months.<br />
The vessel is constructed of Inconel with Inconel protective plates (35% of<br />
surface) <strong>and</strong> graphite armor (15%) used to protect the interior surface of<br />
the vessel in areas of high heat flux. The limiters consist of two 0.4 X 0.8 m<br />
shaped graphite blades located on the outside midplane. Vacuum pumping<br />
rates of up to 10,000 tjs are obtained using two turbo molecular <strong>and</strong> two<br />
cryo pumps. The partial pressure of non-hydrogen components st<strong>and</strong>s at<br />
~ 5 x 10~ 9 torr with a leak rate for air of less than 5 x 10~ 5 torr-t/s.<br />
(MA)<br />
'V.<br />
0<br />
0.4<br />
0.0<br />
1<br />
MHO<br />
TOTAL<br />
ENERGY<br />
(MJ)<br />
0<br />
S<br />
Te (kV)<br />
0<br />
200<br />
100<br />
(ms)<br />
0<br />
Ip<br />
•KINETIC<br />
DIAMAG<br />
MHD<br />
1900 2100 2300 2500 2700<br />
TIME (ms)<br />
VOLTAGE<br />
0<br />
6<br />
GAS PUFF<br />
(torr-Ls" 1 )<br />
0<br />
1.4<br />
0.0<br />
8<br />
NEUTRAL<br />
BEAM<br />
POWER<br />
(MW)<br />
FIG. 3. Time history of a beam heated discharge exhibiting H- <strong>and</strong> L-mode behaviour. The start of<br />
the current rise is time = 0.
164 LUXON et al.<br />
In<br />
85-<br />
o a. •»-<br />
5<br />
aCQs - _J<br />
U •--<br />
o = H-MODE<br />
• = L-MODE<br />
• 0 °° 0 °<br />
_ • O -<br />
•• o °<br />
• n 0<br />
0 1 2 3 4<br />
ne(10"m"') BEFORE NBI<br />
FIG. 4. Characterization of the H-mode threshold for divertor discharges with Ip = 1.0 MA,<br />
Hydrocarbons cleaned up rapidly with baking to 400°C. Baking, glow<br />
discharge cleaning, <strong>and</strong> rapid pulse discharge cleaning are used to clean<br />
up water <strong>and</strong> other sources of oxygen. Substantial cleanup time including<br />
tokamak discharges is required after the vessel is exposed to air. After<br />
one to two months, Z€ff = 1.5 can be attained in ohmic discharges at<br />
ne ~ 3 - 6 x 10 19 m~ 3 . The principal impurity is oxygen. No gettering of<br />
the vessel walls has been done.<br />
Ohmic DIII-D discharges exhibit the characteristics of clean tokamak<br />
discharges. The ohmic confinement observed in DIII-D is comparable<br />
to that seen in other larger tokamaks. The confinement in ohmic hydrogen<br />
discharges is estimated from magnetic measurements to be TE =<br />
150 ± 50 ms for densities in the range ne = 0.7 - 5 x 10 19 m~ 3 . This<br />
produces values of TEJne which equal or exceed those expected from the<br />
scaling TE/ne = 1.92 .ft 2 ' 04 a 1 - 04 [5]; the explicit dependence of r on n has<br />
not been demonstrated from the limited operation to date.<br />
Initial application of up to 6.0 MW of hydrogen neutral beam power<br />
to single null diverted deuterium discharges (BT = 2.1 T) has resulted in<br />
attaining regimes of good confinement commonly referred to as H-mode<br />
[6]. The time history of the parameters for an H-mode discharge is shown<br />
in Fig. 3, <strong>and</strong> the MHD equilibrium is shown in Pig. 1. The plasma<br />
current is maintained constant, <strong>and</strong> the one-turn voltage is measured at<br />
the surface of the plasma. The onset of the H-mode is characterized by a<br />
rapid, to date uncontrolled, rise in the line average plasma density. The<br />
gas puff to the plasma was held constant. The Da radiation in both the<br />
divertor X-point region <strong>and</strong> the central plasma also drops to a fraction<br />
of the ohmic value. The central electron temperature is seen to rise, <strong>and</strong><br />
•
<strong>IAEA</strong>-CN-47/A-m-3 165<br />
the total energy rises dramatically as the global energy confinement time<br />
returns to values comparable to the ohmic confinement.<br />
A well defined threshold in both plasma density <strong>and</strong> neutral beam<br />
power must be exceeded in order to attain H-mode confinement, otherwise<br />
poor (L-mode) confinement is obtained (Fig. 4). At a current of 1 MA<br />
the power threshold is less than 2.8 MW <strong>and</strong> the density must exceed<br />
2 x 10 19 m~ 3 . The transition to the H-mode is delayed from the initial<br />
application of beam power. This period is characterized by little density<br />
rise, a sharp increase in Da radiation, <strong>and</strong> a period of poor (L-mode)<br />
confinement.<br />
The ion temperature profile % (r) from charge exchange recombination<br />
<strong>and</strong> the electron temperature profile Te (r) from absolutely calibrated<br />
electron cyclotron emission are shown in Fig. 5 at 2280 ms. The line average<br />
density is determined from a single vertical CO2 interferometer chord.<br />
The absolutely calibrated visible bremsstrahlung radiation (dependent on<br />
Te,ne, <strong>and</strong> Ze/f) is measured along 16 chords. These data were combined<br />
along with the assumption Zeff = const, to obtain the set of profiles shown<br />
in Fig. 5 for the ohmic (t = 2000,ne = 2.5x 10 19 m~ 3 , Zeff = 1.5), <strong>and</strong> Hmode<br />
(t = 2280, ne = 5.2 x 10 19 m~ 3 , Zeff = 2.9) phases of the discharge.<br />
-<br />
• _,.,.<br />
1 1 1<br />
0.2 0.4 0.6<br />
r/a<br />
FIG. 5. Temperature, density, <strong>and</strong> radiated power profiles:H-mode from the discharge of Fig. 3 at<br />
2280 ms; Ohmic at 2000 ms. L-mode is from a similar discharge (P = 4.5 MW).<br />
0.8
166<br />
200<br />
•5 150<br />
ui<br />
UJ<br />
•<br />
100 -<br />
•<br />
' 9\<br />
. \<br />
'_ Q \<br />
; \<br />
o 50 -<br />
• Ip - 1.0<br />
• Bt - 2.10<br />
\ Kappa - 1.75<br />
,<br />
LUXON et al.<br />
8<br />
0<br />
o<br />
A<br />
A<br />
A<br />
O<br />
0<br />
<strong>IAEA</strong>-CN-47/A-m-3 167<br />
Spikes occur in the Da radiation during the H-mode coincident with<br />
the rapid expulsion of substantial amounts (up to 15%) of energy <strong>and</strong> particles.<br />
These losses appear to propagate from the edge into the plasma.<br />
The discharge described in Fig. 3 only exhibited this feature after the<br />
power was turned off. Initial evidence is that these bursts are likely associated<br />
with edge localized modes (ELM) [6]. The highest values of total<br />
plasma energy WT occur in discharges with no Da bursts.<br />
Additional information on the nature of the ELM can be obtained<br />
from ICH coupling experiments carried out using cavity wave launchers<br />
constructed by Oak Ridge National Laboratory. Satisfactory loading can<br />
be achieved in both ohmic limiter <strong>and</strong> divertor plasmas, but with H-mode<br />
heating the loading drops by a factor of ~ 2 from the L-mode coupling.<br />
However, this loading is seen to increase abruptly by a factor of 2 or more<br />
coincident with the Da bursts. These results suggest particularly low<br />
density in the region outside the separatrix during H-mode <strong>and</strong> a sharp<br />
rise in this density associated with the ELM.<br />
Once H-mode confinement has been attained, it remains for the<br />
entire duration of the neutral beam pulse. H-mode confinement has been<br />
sustained for up to 740 ms with 3 MW of power applied. Burst free Hmode<br />
has been sustained for 300 ms before the heating ended. H-modes<br />
have been achieved over the entire current range 0.7 < Ip (MA) < 2.0 <strong>and</strong><br />
toroidal field range 1.2 < BT (T) < 2.1 studied to date. The maximum<br />
line average denisty attained is 8.4 x 10 19 m~ 3 .<br />
4. SUMMARY<br />
The first nine months of DIII-D operation have demonstrated that<br />
the tools necessary to carry the study of confinement <strong>and</strong> beta into new<br />
regimes will be available in the upcoming years. Discharges with good (Hmode)<br />
confinement have been demonstrated with neutral beam heating<br />
in the open divertor configuration. H-mode confinement times are comparable<br />
to ohmic confinement times <strong>and</strong> about three times the L-mode<br />
confinement (rg ~ r£ H ~ 3 rjf ~ 175 ms). This result clearly shows that<br />
this important confinement improvement can be scaled to larger devices.<br />
It also shows that this enhanced confinement can be achieved in simplified<br />
divertor configurations which can be more readily incorporated into larger<br />
devices. The substantial range of divertor shapes available, including the<br />
double null, along with the precise control demonstrated by the shaping<br />
system, should allow the role of cross sectional shape in attaining good<br />
confinement to be thoroughly explored.
168 LUXON et al.<br />
DIII-D has demonstrated the tools necessary for an aggressive study<br />
of plasma shape in attaining high values of beta. Values of I/aB ~ 2 have<br />
already been attained in both limiters <strong>and</strong> divertors, <strong>and</strong> substantially<br />
higher values are anticipated in the future. The plasma cross section can<br />
be precisely controlled in both space <strong>and</strong> time over a range of elongations<br />
from near circular to elongations greater than two. Triangularity can be<br />
independently varied. With the addition of the new long pulse sources<br />
beam heated discharge durations are anticipated to be sufficiently long to<br />
attain quasi steady state conditions.<br />
It is anticipated that during the next year the tokamak will be operated<br />
in regimes of high current <strong>and</strong> higli I/aB (Table I) <strong>and</strong> that all of<br />
the neutral beamlines will be brought into operation <strong>and</strong> fitted with long<br />
pulse sources capable of a total of 14 MW of power with multisecond pulse<br />
durations. This capability should allow extension of confinement studies<br />
to substantial values of current <strong>and</strong> power <strong>and</strong> a definitive test of the beta<br />
limits of the machine.<br />
ECH outside launch heating experiments in both the extraordinary<br />
<strong>and</strong> ordinary mode are planned through early 1987. This system will<br />
be capable of 1.4 MW of power at 60 GHz <strong>and</strong> will allow profile control<br />
experiments using edge heating to be carried out. Installation of inside<br />
launch ECH with a total of 2 MW of power is anticipated in late 1987.<br />
This will allow both edge heating <strong>and</strong> current drive experiments. The<br />
present ICH coupling experiments will be complete in early 1987, <strong>and</strong><br />
2 MW of heating using cavity resonators to couple power at 30-60 MHz<br />
is planned for late 1987.<br />
REFERENCES<br />
[1] LUXON, J.L., DAVIS, L.G., Fusion Technol. 8 (1985) 441.<br />
[2] STAMBAUGH, R.D., in Plasma Physics <strong>and</strong> Controlled <strong>Nuclear</strong> Fusion 1984 (Proc. 10th Int.<br />
Conf. London, 1984), Vol. 1, <strong>IAEA</strong>, Vienna (1985) 217.<br />
[3] BURRELL, K.H., ibid., p. 131.<br />
[4] KITSUNEZAKI, A., ibid., p. 57.<br />
[5] PARKER, R.R., et al., Nucl. Fusion 25 (1985) 1127.<br />
[6] WAGNER, F., et al., Phys. Rev. Lett. 49 (1982) 1408.<br />
[7] KAYE, S.M., et al., Nucl. Fusion 24 (1984) 1303.<br />
DISCUSSION<br />
Y. SHIMOMURA: Did you observe the H-mode in the hydrogen plasma?<br />
J. LUXON: No, we have not yet had an opportunity of doing so.<br />
M. KEILHACKER: I would like to make a comment. The recent observation<br />
of H-mode discharges in large tokamak experiments, such as JET <strong>and</strong> DIII-D, allows
<strong>IAEA</strong>-CN-47/A-III-3 169<br />
the size scaling of H-mode confinement times to be studied. A comparison of DIII-D<br />
<strong>and</strong> JET results with those from ASDEX seems to indicate that the global energy confinement<br />
time of H-mode discharges scales linearly with total plasma current, but has<br />
no additional separate size scaling.<br />
F. WAGNER: Dr. Luxon, you mentioned in your presentation that the H-mode<br />
is often preceded by an L-phase. Having in mind the previous D-III results where<br />
the L- <strong>and</strong> H-modes were different, from the very beginning of the beam pulse, I<br />
would like to know whether there are still cases without a preceding L-phase. Do you<br />
attribute the difference in H-mode development between D-III <strong>and</strong> BIG-D to the<br />
change in the ion grad-B drift direction?<br />
J. LUXON: At present, the onset of the H-mode is always preceded by some<br />
period of delay, although the duration varies. The ion grad-B drift is into the divertor<br />
for DIII-D <strong>and</strong> away from the divertor for Doublet III. But I think that there are so<br />
many other differences that we should carry out the experiment rather than infer the<br />
result.
PELLET INJECTION RESULTS DURING<br />
TFTR OHMIC AND NEUTRAL BEAM<br />
HEATING EXPERIMENTS*<br />
<strong>IAEA</strong>-CN-47/A-m-4<br />
G.L. SCHMIDT, S.L. MILORA 1 , V. ARUNASALAM, M.G. BELL,<br />
M. BITTER, C.E. BUSH 1 , S.K. COMBS 1 , H.F. DYLLA, P.C. EFTHIMION,<br />
E. FREDRICKSON, R.J. GOLDSTON, B. GREK, L.R. GRISHAM,<br />
G. HAMMETT, R.J. HAWRYLUK, W.W. HEIDBRINK 2 , H.W. HENDEL,<br />
K.W. HILL, H. HSUAN, D.W. JOHNSON, L.C. JOHNSON, P.H. LaMARCHE,<br />
R. LITTLE, D.K. MANSFIELD, D.C. McCUNE, K. McGUIRE, D.M. MEADE,<br />
S.S. MEDLEY, D. MUELLER, W. MORRIS 3 , E.B. NIESCHMIDT 4 ,<br />
J. O'ROURKE 5 , D.K. OWENS, H. PARK, A.T. RAMSEY, M.H. REDI,<br />
J. SCHIVELL, D. SCHURESKO 1 , T. SENKO, S. SESNIC,<br />
F.J. STAUFFER 6 , B.C. STRATTON, G.D. TAIT, G. TAYLOR,<br />
J.R. TIMBERLAKE, H.H. TOWNER, M. ULRICKSON, R. WIELAND,<br />
J.B. WILGEN 1 , M. WILLIAMS, M.C. ZARNSTORFF, S.J. ZWEBEN<br />
Princeton Plasma Physics Laboratory,<br />
Princeton University,<br />
Princeton, New Jersey,<br />
United States of America<br />
Abstract<br />
PELLET INJECTION RESULTS DURING TFTR OHMIC AND NEUTRAL BEAM HEATING<br />
EXPERIMENTS.<br />
In Ohmic discharges, pellet injection experiments on TFTR have increased density limits <strong>and</strong><br />
energy confinement. Injecting multiple pellets sustains the improved confinement <strong>and</strong> increases the central<br />
density <strong>and</strong> peaked character of the profile, producing significant increases in ne(O)rE(a). A value<br />
of (1.4 ± 0.3) x 10 20 m" 3 -s has been achieved at a central electron temperature of 1.4 keV. Decay<br />
of the central density for strongly peaked profiles in Ohmic discharges is consistent with central particle<br />
diffusion coefficients of 0.1 m 2 /s <strong>and</strong> flow velocities on the order of neoclassical velocities. Concentrations<br />
of sc<strong>and</strong>ium injected following pellet injection (nSc/ne) exhibit an extended rise time <strong>and</strong> then<br />
remain roughly constant during the subsequent slow decay of the electron density. In pellet-fueled discharges<br />
heated by tangential neutral beams at high density, heating profiles vary from a fiat radial shape<br />
to a profile that is peaked near the q = 2 radius. Global confinement is comparable to that obtained<br />
in gas-fueled discharges with similar total input power but with heating profiles more strongly peaked<br />
on axis. Central confinement in pellet-fueled discharges exceeds values obtained in gas-fueled<br />
discharges.<br />
* Research sponsored by the Office of Fusion Energy, United States Department<br />
of Energy, under Contract No. DE-AC02-76-CHO-3073 with Princeton<br />
University <strong>and</strong> under Contract No. DE-AC05-84OR21400 with Martin<br />
Marietta Energy Systems, Inc.<br />
1 Oak Ridge National Laboratory, Oak Ridge, TN, USA.<br />
2 GA Technologies Inc., San Diego, CA, USA.<br />
3 Balliol College, Oxford University, Oxford, United Kingdom.<br />
4 EG&G Idaho, Inc., Idaho Falls, ID, USA.<br />
5 JET Joint Undertaking, Abingdon, Oxfordshire, United Kingdom.<br />
6 University of Maryl<strong>and</strong>, College Park, MD, USA.<br />
171
172 SCHMIDT etal.<br />
1. INTRODUCTION<br />
Fueling by injection of single <strong>and</strong> multiple pellets of frozen deuterium<br />
at speeds up to 1500 m/s has been carried out in TFTR Ohmic <strong>and</strong><br />
neutral-beam-heated discharges using gas-driven injectors developed at<br />
Oak Ridge National Laboratory [1,2]. A carbon inner wall with a large<br />
surface area, conditioned by extensive operation with helium plasmas,<br />
has been used as the discharge limiter. Operation in Ohmic discharges<br />
at ne > 2 X 10 19 m"~ 3 is characterized by minimal metal impurities <strong>and</strong><br />
significant pumping of recycling plasma [3].<br />
2. OHMIC DISCHARGES<br />
2.1. Overview<br />
Injection of multiple pellets produces increased penetration of successive<br />
pellets as the plasma is cooled by the introduction of pellet mass.<br />
The final pellets penetrate to the plasma magnetic axis, as illustrated in<br />
Fig. 1. Penetration calculations, based on a neutral gas shielding model<br />
modified to include a Maxwellian distribution of electrons, a cold plasma<br />
shield extending along the magnetic field lines, <strong>and</strong> a finite electron heat<br />
bath,reproduce this effect <strong>and</strong> correctly predict penetration at 3 keV.<br />
Deep pellet penetration produces strongly peaked density profiles at<br />
higher line-average density than is attainable by gas puffing. Central<br />
densities up to 4 x 10 20 m~ 3 have been produced. This is roughly four<br />
times the highest value obtained with gas puffing [4j. Plasma line-average<br />
densities of 1.4 x 10 20 m~ 3 have been obtained, corresponding to a value<br />
of neR/BT = 6.5 x 10 19 m" 2 ^" 1 , twice that achieved with gas puffing.<br />
As illustrated in Fig. 1, central electron temperatures decrease from<br />
approximately 3 keV to 160 kHz, is observed<br />
on Mirnov loops located at the vessel wall. Following this period, a 1/1<br />
mode, possibly associated with poloidal <strong>and</strong> toroidal propagation of the<br />
pellet density perturbation [6,7], is often observed. The mode decays on<br />
a 1- to 10-ms time-scale ana propagates at roughly the ion sound speed.<br />
During an extended period following the pellet perturbation, sawtooth<br />
oscillations either can dominate the MHD behavior or are suppressed.<br />
When sawtooth oscillations are dominant, they appear shortly after the<br />
pellet event, are of large amplitude, <strong>and</strong> have a period of roughly 100 to<br />
200 ms, compared with 20 to 50 ms before pellet injection. In discharges<br />
associated primarily with strong pellet penetration, sawtooth oscillations
OJ O _<br />
5<br />
I I<br />
R<br />
o<br />
t-<br />
2.0<br />
1<br />
<strong>IAEA</strong>-CN-47/A-III-4 173<br />
R (m)<br />
1<br />
/<br />
J<br />
I<br />
2.5<br />
I I<br />
\<br />
5 I<br />
wi<br />
5 /<br />
2.3 2.4 2.5 2.6 2.7<br />
R (m)<br />
/<br />
3.0<br />
1 1<br />
X<br />
2.5<br />
R (m)<br />
1<br />
1<br />
3.0<br />
1<br />
2.8 2.9 3.0<br />
FIG. 1. (a) Density profile at 3.35 s, after injection of five 2.67 mm pellets, (b) Electron temperature<br />
profiles at 2.15 s, before injection of first pellet; at 3.13 s, before injection of fifth pellet; <strong>and</strong> at<br />
3.35 s. (c) Measured light during pellet ablation, indicating penetration depths of the first <strong>and</strong> fifth<br />
pellets. Calculated penetration depths, allowing for a 10% uncertainty in electron temperature, are<br />
indicated by the bars.<br />
can be suppressed for a period of 1 s. These discharges either exhibit<br />
no mode structure or are dominated by strong, continuous m = 1 oscillations.<br />
In these cases a large <strong>and</strong> very narrow central x-ray peak<br />
forms during the plasma reheat. During this period, off-axis, sawtoothlike<br />
relaxations that do not alter the central peak can be observed. Such<br />
events imply a broad, flat ^-profile within the plasma core. In some discharges<br />
that initially exhibit these characteristics, sawtooth oscillations<br />
can reappear. When this occurs, the continuous m = 1 oscillations cease,<br />
the formation of the strong central x-ray emission is terminated, <strong>and</strong> the<br />
discharge becomes sawtooth dominated.<br />
2.2. Particle transport<br />
Following pellet injection, particle content in strongly peaked discharges<br />
decays on a 1- to 2-s time-scale, while central density initially<br />
decays on a time-scale greater than 2 s. A strong interior density<br />
gradient forms during the first phase of this decay, as does a density<br />
pedestal with the approximate profile shape of gas-fueled discharges.<br />
Such a case is shown in Fig. 2. The central density profile decay under<br />
these conditions is reproduced by calculations assuming a fixed particle<br />
diffusion coefficient of 0.1 m 2 /s for r/a < 0.5 [D =• 0.1 + {r/a) e m 2 /s].
174 SCHMIDT et al.<br />
2.5<br />
2.0<br />
(.5<br />
1.0<br />
0.5<br />
2.0 2.5 3.0<br />
MAJOR RADIUS (m)<br />
3.5 4.0<br />
FIG. 2. (a) Electron density profile evolution following pellet injection, obtained from Abel inversion<br />
of FIR laser interferometer data (10 channels), (b) Measured <strong>and</strong> calculated decay ofne at four radial<br />
positionsr: ±0.08m (A), ±0.2m (B), ±0.3 m (C), <strong>and</strong> ±0.5 m (D), averaged about the plasma center.<br />
The inward pinch term determined by this diffusion coefficient <strong>and</strong> the<br />
measured ratio D/v evaluated at 3.7 s is less than 0.3 m/s within this region.<br />
This value is roughly only five times the neoclassical value. These<br />
terms represent a time average of the transport. They are consistent<br />
with results from a similar discharge based on a least-squares fit to a <strong>and</strong><br />
0 in the equation T = an + 0 dnjdr. Data are fitted over a range of<br />
time separately at a given radius; F is obtained from a calculation using<br />
measured values of ne(r,t) <strong>and</strong> a computed source term. As indicated in<br />
the figure, the initial transport deviates from the average, with density<br />
decaying slowly at the center <strong>and</strong> more rapidly at larger radii, suggesting<br />
some variation about the average values.<br />
Impurity transport during this decay has been evaluated with sc<strong>and</strong>ium<br />
injection. Sc<strong>and</strong>ium concentrations {nsc/ne) within the plasma<br />
core have been deduced from pulse-height analyzer measurements, assuming<br />
the same profile shape for sc<strong>and</strong>ium <strong>and</strong> electron densities within<br />
this region. When sc<strong>and</strong>ium is injected following pellet injection, concentrations<br />
are found to increase over an extended period of 300 to 500 ms<br />
after sc<strong>and</strong>ium injection <strong>and</strong> then to remain roughly constant during the<br />
subsequent slow decay of the electron density.<br />
2.3. Energy confinement<br />
Confinement properties of pellet-fueled <strong>and</strong> gas-fueled discharges<br />
have been compared using (1) magnetic <strong>and</strong> kinetic measurements of<br />
the plasma stored energy; (2) calculations of the resistive input power,<br />
including corrections due to changes in the internal plasma inductance<br />
obtained from measurements of the diamagnetic flux /?p,diamag(0 <strong>and</strong><br />
the equilibrium magnetic field A((); <strong>and</strong> (3) calculations of the global<br />
confinement, including corrections to the input power term due to the<br />
time rate of change in stored energy. Comparisons were made primarily<br />
at 1.6 MA, where operation with deuterium gas puffing was
<strong>IAEA</strong>-CN-47/A-ID-4 175<br />
5 10<br />
ne(10 19 m" 3 )<br />
• PELLETS<br />
o D2 GAS<br />
o He GAS<br />
FIG. 3. Global energy confinement in deuterium <strong>and</strong> helium gas-fueled <strong>and</strong> deuterium pellet-fueled<br />
discharges. Plasma stored energy was obtained from /S aiamag-<br />
1.0<br />
0.5<br />
0<br />
3<br />
2<br />
1<br />
0<br />
0.7<br />
0.5<br />
PELLET SHOT<br />
PELLET INJECTION<br />
" . . . . I • + • . • I .». . * I . + .<br />
NO PELLET SHOT<br />
I . . , , I . . . , I<br />
1.5 2.0 2.5 3.0<br />
TIME (s)<br />
15<br />
NO PELLET SHOT<br />
. I . . , . I , , , , I , , ,<br />
3.5 4.0<br />
FIG. 4. Time history of plasma stored energy Elot, calculated input power, <strong>and</strong> global confinement<br />
for a deuterium gas-fueled discharge <strong>and</strong> a deuterium pellet-fueled, 1.6 MA discharge.
176 SCHMIDT etal.<br />
limited to ne < 5 x 10 19 m" 3 by "Marfe-like" phenomena <strong>and</strong> high<br />
radiative power. Operation in helium extended the density limit to<br />
~ Tx 10 19 m~ 3 . As shown in Fig. 3, although the confinement times<br />
for gas puffing saturate at ne « 4 x 10 19 m~ 3 , the pellet-fueled discharges<br />
exhibit improved energy confinement at substantially higher densities.<br />
The data are compared with Goldston empirical scaling [8] at<br />
fixed Ptot = 1.6 MW. The gross energy confinement time is expressed in<br />
terms of Ohmic (TNA) <strong>and</strong> auxiliary (raux) heating components, l/r|, =<br />
r§A+ra\x, where rNA = 7.1 x 10- 22 fie(cm- 3 )a(cm) 104 iZ(cm) 2>04 g 0 - 5 ,<br />
raux = [6.4 x 10- 8 C/2 1 - 75 a-° :}7 /p(A)/JPtot(W) 0S ] 2 /r£?) <strong>and</strong> C is a constant<br />
determined by the confinement regime <strong>and</strong> the plasma isotope effect.<br />
Good agreement with the pellet fueling data is obtained for an<br />
"H-mode-like" confinement factor of C = 2.66 [4j. The gas fueling confinement<br />
times are more typical of L-mode results (C = 1.33).<br />
This improved confinement appears qualitatively similar to the<br />
Alcator-C results [9j. However, if ion transport is neoclassical, ion heat<br />
conduction losses represent only ~15% of the total power flow at the halfradius.<br />
Plasma convective losses <strong>and</strong> uncertainties in the radiated power<br />
from within the plasma core, which is a significant part of power balance,<br />
affect the accuracy with which the upper limit of the ion neoclassical<br />
anomaly factor can be determined. At present, we estimate the upper<br />
limit of this factor to be ~2-3, <strong>and</strong> we cannot determine whether ions or<br />
electrons play the dominant role in heat conduction losses. Calculations<br />
were made for a representative experiment, fueled by three pellets, using<br />
the BALDUR code with models for radiative <strong>and</strong> convective power losses<br />
corresponding to the measured radiation <strong>and</strong> density decay <strong>and</strong> for electron<br />
transport based on dissipative trapped electron modes [10]. These<br />
calculations simulate the measured global confinement with a neoclassical<br />
anomaly factor of 1.<br />
The improved confinement obtained with pellets can be sustained by<br />
injecting multiple pellets, as shown in Fig. 4. The plasma stored energy<br />
rises with successive pellets, the global confinement increases with the<br />
first pellets <strong>and</strong> then is sustained by continued injection, <strong>and</strong> the central<br />
density increases. The increase in stored energy is partially due to higher<br />
resistive power, but the primary contribution is a roughly 70% increase<br />
in TB, which in this case remains above the 0.5-s level for 0.7 s.<br />
3. AUXILIARY HEATING<br />
Auxiliary heating on TFTR is currently produced by tangential injection<br />
of 80- to 100-keV deuterium beams. Heating powers up to 11 MW<br />
have been used for pellet experiments. At high density, beam geometry<br />
<strong>and</strong> attenuation result in modest central input power levels even at high<br />
total input power. Heating profiles vary from flat to strongly peaked near<br />
the radius at which q = 2. Nonetheless, global confinement is comparable<br />
to that obtained in gas-fueled discharges with similar total input power<br />
but with heating profiles more strongly peaked on axis. This general result<br />
suggests a radial dependence of the energy confinement, which has<br />
been confirmed by detailed analysis of results at 6 MW [4]. Application
<strong>IAEA</strong>-CN-47/A-III-4 177<br />
of ion cyclotron heating in the coming year will provide increased central<br />
input power levels in pellet-fueled discharges, permitting tests of possible<br />
enhanced confinement scenarios [ll].<br />
4. SUMMARY<br />
Pellet injection experiments on TFTR have increased density limits<br />
<strong>and</strong> energy confinement in Ohmic discharges. Injecting multiple pellets<br />
sustains the improved confinement <strong>and</strong> increases the central density<br />
<strong>and</strong> peaked character of the profile, producing significant increases in<br />
ne(0)r(o). A value of (1.4 ± 0.3) X 10 20 m~ 3 -s has been achieved at a<br />
central electron temperature of 1.4 keV. Decay of the central density for<br />
strongly peaked profiles in Ohmic discharges is consistent with central<br />
particle diffusion coefficients of 0.1 m 2 /s <strong>and</strong> with flow velocities on the<br />
order of neoclassical velocities. Concentrations of sc<strong>and</strong>ium injected following<br />
pellet injection (nse/ne) exhibit an extended rise time <strong>and</strong> then<br />
remain roughly constant during the subsequent slow decay of the electron<br />
density.<br />
REFERENCES<br />
[1] COMBS, S.K., MILORA, S.L., FOUST, C.R., et al., Rev. Sci. Instrum. 56 (1985) 1178.<br />
[2] COMBS, S.K., MILORA, S.L., "Pneumatic pellet injectors for TFTR <strong>and</strong> JET", Fusion Technology<br />
(Proc. 11th Symp. Avignon, 1986), in press.<br />
[3] HILL, K.W., TFTR Group, Paper <strong>IAEA</strong>-CN-47/A-IV-2, these Proceedings, Vol. 1.<br />
[4] MILORA, S.L., SCHMIDT, G.L., ARUNASALAM, V., et al., Plasma Phys. Controll. Fusion<br />
28 (1986) 1435.<br />
[5] MILORA, S.L., FOSTER, C.A., THOMAS, C.E., et al., Nucl. Fusion 20 (1980) 1491.<br />
[6] HEIDBRINK, W.W., et al., Nucl. Fusion 24 (1984) 3.<br />
[7] PARE, V.K., COLCHIN, R.J., MILORA, S.L., BELL, S.D., FREDRICKSON, E.,<br />
McGUIRE, K., SCHMIDT, G.L., Bull. Am. Phys. Soc. 30 (1985) 1522.<br />
[8] GOLDSTON, R.J., Plasma Phys. Controll. Fusion 26 (1984) 87.<br />
[9] GREENWALD, M., GWINN, D., MILORA, S., et al., in Plasma Physics <strong>and</strong> Controlled<br />
<strong>Nuclear</strong> Fusion Research 1984 (Proc. 10th Int. Conf. London, 1984), Vol. 1, <strong>IAEA</strong>, Vienna<br />
(1985) 45.<br />
[10] TANG, W.M., BISHOP, CM., COPPI, B., et al., Paper <strong>IAEA</strong>-CN-47/A-VI-1-2, these<br />
Proceedings, Vol. 1.<br />
[11] FURTH, H.P., Plasma Phys. Controll. Fusion 28 (1986) 1305.<br />
DISCUSSION<br />
F.X. SOLDNER: You told us that you compared the confinement times from<br />
the experiment with different scalings. Which scaling law did you apply for the<br />
H-mode in this case?<br />
S.L. MILORA: We used Goldston scaling, with an auxiliary heating confinement<br />
time multiplier of 2.66 to account for pure deuterium operation (x 1.33) <strong>and</strong><br />
H-mode confinement (X 2).
178 SCHMIDT etal.<br />
A. GIBSON: Is it still true that the highest ftDTETj in TFTR is obtained with<br />
Ohmic heating <strong>and</strong> pellet fuelling, <strong>and</strong> without additional heating?<br />
S.L. MILORA: The two experiments exhibit nearly identical values of nerETj.<br />
However, the deuteron concentration on axis is higher in the pellet fuelling case <strong>and</strong><br />
consequently its nDTETj value is still higher.<br />
J.G. CORDEY: Do your electron temperature profiles show profile consistency<br />
for the case of pellet injection <strong>and</strong> neutral beam injection?<br />
S.L. MILORA: Profile consistency applies in the case of moderate density<br />
pellet fuelled discharges with neutral beam injection. At higher densities, the electron<br />
temperature profiles can become hollow in the centre since radiation from low-Z<br />
impurities exceeds the input power density.<br />
R.S. PEASE: How do the results you report depend on the current used? And<br />
how close can you get to the value 0P = 1?<br />
S.L. MILORA: Similar values of the confinement time, namely 0.5-0.6 s, have<br />
been attained at higher currents (up to 2.2 MA). These are lower than we expected.<br />
However, the experiments were performed with one or two pellets only <strong>and</strong> so we<br />
cannot say that we have reached the peak plasma energy. For the 1.6 MA discharges,<br />
0P = 0.31.
FAST ION LOSSES<br />
AND PLASMA CONFINEMENT IN TFR<br />
DURING NEUTRAL BEAM INJECTION<br />
EQUIPE TFR<br />
Association Euratom-CEA sur la fusion,<br />
Departement de recherches sur la fusion controls,<br />
Centre d'etudes nucleaires de Cadarache,<br />
Saint-Paul-lez-Durance, France<br />
Presented by J. -P. Roubin<br />
Abstract<br />
<strong>IAEA</strong>-CN-47/A-IH-5<br />
FAST ION LOSSES AND PLASMA CONFINEMENT IN TFR DURING NEUTRAL BEAM<br />
INJECTION.<br />
Neutral beam injection experiments on carbon limited discharges in TFR exhibit a strong ion<br />
heating saturation with increasing additional power <strong>and</strong> negligible electron heating. These results seem<br />
to be inconsistent with the usual L-mode scaling. To identify a possible beam specific mechanism<br />
limiting the power before complete thermalization of the fast ions, an exhaustive check of the whole<br />
coupling chain from the neutral beam sources to the bulk plasma has been made. The coupling of the<br />
neutral beams with the plasma is analysed <strong>and</strong> shown to be as expected. Fast ion thermalization is<br />
investigated by different methods (active charge exchange, neutron production in D°-D experiments).<br />
It is concluded that a spatial diffusion mechanism causes saturation of the central fast ion density with<br />
power at the very beginning of the slowing-down process. Finally, the heating results are interpreted,<br />
taking into account the fast ion losses. While the electron confinement appears to deteriorate, the central<br />
ion confinement time remains constant with power.<br />
INTRODUCTION<br />
Recent NBI experiments [1] on carbon limited discharges in TFR, in the<br />
Padd/POhm range
180 EQUIPETFR<br />
1. BEAM INPUT ACCOUNTABILITY<br />
1.1. Power transmission into the torus<br />
A water cooled calorimeter has been installed on the inner wall of TFR, in front<br />
of one neutral beam port. With this calorimeter the total space <strong>and</strong> time integrated<br />
beam power entering the torus can be accurately measured. The operation of the<br />
calorimeter without plasma gives the transmission efficiency rjT of the injectors<br />
(ions + neutrals) when the toroidal field is off, <strong>and</strong> the global neutral transmission<br />
efficiency r)Q, expressed as TJG = TJT-IJN (where r;N is the species averaged neutralization<br />
efficiency) when the toroidal field is on.<br />
The values of r)T <strong>and</strong> i7G are found to be constant <strong>and</strong> independent of the<br />
extracted power <strong>and</strong> to be close to the expected values [2]: G = 0.38, r;T = 0.60 <strong>and</strong><br />
hence ijN = 0.63. This rules out re-ionization of the neutrals before they enter the<br />
torus <strong>and</strong> any other conceivable saturation mechanism inside the injector with<br />
increasing power.<br />
1.2. Capture of fast neutrals by the plasma<br />
The calorimeter can also be operated in the presence of plasma; its contribution<br />
is then monitored by a second calorimeter [3]. Since the actual neutral beam power<br />
at the plasma boundary is known, the measurement of the 'shine-through' fraction<br />
of this power can be used to check if the fast neutral ionization mechanisms are the<br />
expected ones.<br />
The experimental shine-through fractions are shown in Fig. 1 as a function of<br />
line density. For identical plasma conditions the results are the same for the case with<br />
two sources in operation <strong>and</strong> for the case with four sources in operation. This shows<br />
that the power input to the plasma grows linearly with the extracted power.<br />
Comparison with theoretical values computed on the basis of the usual capture<br />
cross-sections [4, 5] shows that the experimental results can be explained by a small<br />
increase ( + 13% at n = 8 X 10 19 m" 3 , E = 34 keV) of these cross-sections. A<br />
higher increase of the cross-section (+24%) due to multi-step ionization mechanisms<br />
has been predicted theoretically [6, 7].<br />
In any case, under TFR conditions, the power density in the plasma centre is<br />
almost unaffected by these corrections <strong>and</strong> hence full accountability of the beam input<br />
is assessed experimentally. Consequently, the observed low heating efficiency <strong>and</strong><br />
saturation are due to fast ions <strong>and</strong>/or bulk plasma confinement problems.<br />
2. BEHAVIOUR OF FAST IONS<br />
Direct information on the beam ion distribution function <strong>and</strong> its dependence on<br />
injected power has been obtained in the following experiment.
30<br />
25<br />
-20<br />
15<br />
10<br />
<strong>IAEA</strong>-CN-47/A-III-5 181<br />
Usual cross-sections<br />
1.5 2.5 n](10"'m- 4 )<br />
FIG. I. Experimental shine-through values versus line density<br />
<strong>and</strong> comparison with theory (solid lines).<br />
2.1. Active charge exchange measurements<br />
2.1.1. Measurements during the stationary phase<br />
The distribution function of central fast ions has been measured using an<br />
auxiliary modulated doping beam which crosses the line of sight of a multi-channel<br />
neutral particle analyser at the plasma centre. Fourier analysis of the modulated<br />
experimental signals at the modulation frequency gives an amplitude proportional to<br />
the fast ion density at a given energy. A comparison of the signals at various power<br />
levels, with the other experimental parameters (Te, ne, MHD, Yeff) kept constant,<br />
has been made [8].<br />
It is concluded that the fast ion density does not increase with power as<br />
expected. Since saturation appears already at the highest analysed energy (30 keV,<br />
only 3 keV below the injection energy) <strong>and</strong> then remains constant with energy, it follows<br />
that the saturating mechanism mainly affects the most energetic ions at the<br />
beginning of their slowing-down process <strong>and</strong> transfers them towards peripheral<br />
regions.<br />
2.1.2. Measurements after beam cut-off<br />
Using the same experimental set-up <strong>and</strong> holding the doping beam constant<br />
during the fast simultaneous cut-off of the neutral beams, information on the slowingdown<br />
kinematics of the fast ions can be obtained. The temporal behaviour of the<br />
decrease of the energetic neutral flux is compared with a simulation based on a<br />
numerical solution of the homogeneous time dependent Fokker-Planck equation. The<br />
experiments are in good agreement with theory over the whole range of density <strong>and</strong>
182<br />
EQUIPE TFR<br />
E=I8 keV<br />
4 8 12 10 20<br />
t (ms)<br />
FIG. 2. Comparison between theoretical (solid lines) <strong>and</strong> experimental fast neutral signals<br />
after beam cut-off for three different densities <strong>and</strong> three analyser energies.<br />
A: ne(0) = 1.3 x 10 20 m- 3 , D: ne(0) = 0.5 X W 2O m~ 3 , o / n/0) = 0.3 x JO 20 m~ 3 .<br />
power (Fig. 2) <strong>and</strong> show that the fast ions which remain in the centre of the discharge<br />
after the beginning of their slowing-down phase (from 33 keV to ~ 30 keV) continue<br />
to be classically coupled to the plasma. This confirms that, independent of the exact<br />
nature of the mechanism in connection with saturation, this mechanism necessarily<br />
acts only at the highest fast ion energy.<br />
2.2 Neutron production in D°-D experiments<br />
On TFR, the neutron production in D°-D experiments is largely dominated by<br />
beam-plasma interaction. These neutron fluxes can serve as a monitor of the highest<br />
part of the fast ion distribution function (because of the energy dependence of the<br />
fusion cross-section) in the plasma centre (because of the peaked profiles of density<br />
<strong>and</strong> slowing-down time). Since on TFR the ion sources can be tilted in a vertical<br />
plane, the neutron production dependence can be studied for various deposition profiles<br />
at different power levels [9] <strong>and</strong> under similar plasma conditions. The beams<br />
can be aimed on axis (5 = 0 cm) as well as off axis (5 up to a/2 = 10 cm).<br />
For operation with a single source the neutron yields <strong>and</strong> their dependence upon<br />
6 are in excellent agreement with numerical simulations, but a comparison of data<br />
for operation with one, two <strong>and</strong> four sources under the same plasma conditions<br />
(T , Zeff) shows that the increase of neutron yield with power is less than expected.<br />
Moreover, the saturation is strongest for the most peaked deposition profiles (5=0)<br />
<strong>and</strong> thus for the highest fast ion density (Fig. 3). The numerical simulation fits the<br />
high power cases only with artificially broadened fast ion profiles.<br />
This confirms the spatial diffusion of the fast ions as indicated by active charge<br />
exchange experiments.<br />
2.3. A possible mechanism<br />
For the very rapid loss of beam ions a mechanism is required which can<br />
transport the ions on a time-scale much shorter than the slowing-down time. Such a
-<br />
2 "<br />
' 1 ' r<br />
*n source*<br />
*i tourct<br />
I<br />
<strong>IAEA</strong>-CN-47/A-HI-5 183<br />
•••••• i ' r,<br />
>&<br />
Theory J£<br />
ysi>=\§ cm<br />
/ S ^ &=0 cm<br />
Number of operated<br />
sources<br />
1 , 1<br />
FIG. 3. Theoretical <strong>and</strong> experimental evolution of neutron yield with power for<br />
central deposition (5=0) <strong>and</strong> more peripheral deposition (8 = 10 cm).<br />
mechanism is the fishbone instability observed in high beta experiments with perpendicular<br />
NBI.<br />
In our low beta case, an electrostatic trapped-ion instability can occur, driven<br />
by resonance with the magnetic drift of beam ions [10]. The target plasma is in a<br />
collisional regime <strong>and</strong> responds adiabatically.<br />
In the simplest approximation, the dispersion relation is:<br />
3E co—<br />
where co = — is the precession frequency, 2 is the toroidal mode number, <strong>and</strong><br />
r eBR<br />
q is the beam ion distribution. With TFR parameters, we find an t=\ mode<br />
unstable for<br />
nP<br />
AE_V<br />
where AE/EB is the relative width of f.<br />
This mode is very similar to a bump-in-tail instability. Its low frequency <strong>and</strong><br />
large wavelength scale render direct observation with the existing diagnostics<br />
difficult. It is known that this type of resonance causes a rapid outward transport of<br />
the ions as they lose energy to the wave [11].
184<br />
EQUIPE TFR<br />
a Active CX<br />
O Neutrons -<br />
Number of operated sources<br />
I , I ,<br />
2 4 6 8<br />
FIG. 4. Ion temperature increase (*) versus power <strong>and</strong> fast ion density<br />
calibrated for operation with one source.<br />
3. POWER BALANCE WITH EXPERIMENTAL FAST ION LOSSES<br />
From the above observations it follows that the central power density used in<br />
central energy balance analysis has to be corrected. The actual power, as given by<br />
charge exchange or neutron flux experiments, increases only by a factor of 2.8 going<br />
from one to four sources. The saturation of the ion temperature increase is quite similar<br />
to the actual power saturation (Fig. 4), <strong>and</strong>, for central ion heating simulations<br />
using the corrected power, no decrease of the Ohmic r is required any more.<br />
However, since classical slowing-down of the remaining central fast ions has<br />
been proved, it follows that, for TFR conditions, the power input to electrons <strong>and</strong><br />
ions is similar. A strong decrease of ve is needed to explain the poor electron heating.<br />
No specific mechanism for such a decrease has yet been identified, but a strong<br />
correlation of this process with the density fluctuation level has been clearly<br />
established experimentally [12].<br />
In conclusion, the ion energy balance is dominated by a radial diffusion<br />
mechanism of the injected fast ions which is non-linear with input power <strong>and</strong> affects<br />
mainly the most energetic ions. Thus, bulk ion heating saturation does not imply<br />
enhanced ion heat conduction. On the other h<strong>and</strong>, strong confinement deterioration<br />
of the electrons has been shown.<br />
REFERENCES<br />
[1] EQUIPE TFR, in Plasma Physics <strong>and</strong> Controlled <strong>Nuclear</strong> Fusion Research 1984 (Proc. 10th Int.<br />
Conf. London, 1984), Vol. 1, <strong>IAEA</strong>, Vienna (1985) 103.<br />
[2] KIM, J., HASELTON, H.H., J. Appl. Phys. 50 6 (1979) 3802.
<strong>IAEA</strong>-CN-47/A-III-5 185<br />
[3] EQU1PE TFR, Power transmission <strong>and</strong> shine-through calorimetry during NBI in TFR, to be<br />
published in Plasma Phys.<br />
[4] RIVIERE, A.C., Nucl. Fusion 11 (1971) 363.<br />
[5] OLSON, R.E., SALOP, A., Phys. Rev., A 16 (1977) 531.<br />
[6] PERRAUDIN, J.-C, PhD Thesis, Orleans Univ., 1977.<br />
[7] BOLEY, CD., et al., Phys. Rev. Lett. 52 (1984) 534.<br />
[8] EQUIPE TFR, in Controlled Fusion <strong>and</strong> Plasma Physics (Proc. 12th Europ. Conf. Budapest,<br />
1985), Vol. 2, European Physical Society (1985) 308.<br />
[9] EQUIPE TFR, in Controlled Fusion <strong>and</strong> Plasma Heating (Proc. 13th Europ. Conf. Schliersee,<br />
1986), Vol. 2, European Physical Society (1986) 285.<br />
[10] TAGGER, M., LAVAL, G., PELLAT, R., Nucl. Fusion 17 (1977) 109.<br />
[11] TAGGER, M., PELLAT, R., Plasma Phys. 24 (1982) 753.<br />
[12] TFR GROUP <strong>and</strong> TRUC, A., Nucl. Fusion 26 (1986) 1303.<br />
DISCUSSION<br />
R. J. GOLDSTON: I don't know what the injection angle was for these experiments,<br />
nor do I know how the toroidal rotation speed varied with beam power in<br />
TFR, but don't you think that many of the effects you describe could perhaps be<br />
explained by rotation effects?<br />
J.-P. ROUBIN: Unfortunately, we have no measurements of the toroidal rotation,<br />
but in view of the quasi-perpendicular injection angle (15°) <strong>and</strong> the high toroidal<br />
ripple value on TFR, these effects are probably not dominant.<br />
M.C. ZARNSTORFF: Do you have any measurements of the fast ion slowingdown<br />
spectrum off axis during central heating to show the radial fast ion motion?<br />
J.-P. ROUBIN: No, but we have measured greater ripple losses of fast ions<br />
than expected from the calculations <strong>and</strong> this may be an indication of an enhanced<br />
radial diffusion of fast ions.
<strong>IAEA</strong>-CN-47/A-III-6<br />
PARTICLE AND THERMAL TRANSPORT, AND<br />
RESONANT FIELD EXPERIMENTS IN TEXT<br />
A.J. WOOTTON, R.D. BENGTSON, J.A. BOEDO, R.V. BRAVENEC,<br />
K.L. EMPSON, K.W. GENTLE, W.L. HODGE, C.C. KLEPPER,<br />
J. PORTER, A. MACMAHON, S.C. McCOOL, W.H. MINER,<br />
D.M. PATTERSON, P.E. PHILLIPS, B. RICHARDS, C.P. RITZ,<br />
T.L. RHODES, D.W. ROSS, W.L. ROWAN, J.C. WILEY<br />
Fusion Research Center,<br />
The University of Texas at Austin,<br />
Austin, Texas, United States of America<br />
D.L. BROWER, S.K. KIM, N.C. LUHMANN, W.A. PEEBLES<br />
University of California,<br />
Los Angeles, California, United States of America<br />
J.S. DeGRASSIE, T.E. EVANS, G.L. JACKSON, N. OHYABU<br />
GA Technologies, Inc.,<br />
San Diego, California, United States of America<br />
P.H. DIAMOND, T.S. HAHM, P.W. TERRY<br />
Institute for Fusion Studies,<br />
The University of Texas at Austin,<br />
Austin, Texas, United States of America<br />
Shuping FAN, Yexi HE<br />
Institute of Plasma Physics,<br />
Hefei, China<br />
J.C. FORSTER, R.L. HICKOK, P.M. SCHOCH<br />
Rensselaer Polytechnic Institute,<br />
Troy, New York, United States of America<br />
G. HAAS, F. KARGER<br />
Max-Planck-Institut fur Plasmaphysik,<br />
Garching, Federal Republic of Germany<br />
Xuehua YU, Shaobai ZHENG<br />
Institute of Physics,<br />
Chinese Academy of <strong>Sciences</strong>,<br />
Beijing, China<br />
R.C. ISLER<br />
Fusion Energy Division,<br />
Oak Ridge National Laboratory,<br />
Oak Ridge, Tennessee, United States of America<br />
187
188 WOOTTONetal.<br />
Abstract<br />
PARTICLE AND THERMAL TRANSPORT, AND RESONANT FIELD EXPERIMENTS IN TEXT.<br />
Particle <strong>and</strong> energy confinement have been studied on TEXT. Characteristics of the turbulence<br />
are presented, <strong>and</strong> scalings of global confinement times <strong>and</strong> local transport coefficients discussed. At<br />
the edge the measured electrostatic component of the turbulence plays a major role in particle transport.<br />
In the interior the measured density fluctuation levels are used in drift wave turbulence models to compare<br />
measured <strong>and</strong> theoretical transport coefficients. Resonant fields are used to produce ergodic layers<br />
<strong>and</strong> coherent isl<strong>and</strong> chains. Ergodic layers enhance radial electron heat flux <strong>and</strong> reduce the edge temperature,<br />
while isl<strong>and</strong>s allow increased limiter particle collection.<br />
PARTICLE TRANSPORT<br />
Transport is studied on TEXT [l], an ohmically heated tokamak with<br />
major <strong>and</strong> minor radii R — lm, a = 0.27m, at plasma currents Ip < 400 kA,<br />
toroidal fields Bt < 2.8T <strong>and</strong> densities ne < 1 x 10 20 n?" 3 . The working<br />
particle flux F, deduced from flux surface averages (FSA) of the asymmetric<br />
Ha or Da emission [2], is characterized by the particle confinement time<br />
rp = N/r(a) ~ 10ms. The Ip <strong>and</strong> Bt dependencies are approximately<br />
rp
CM IE<br />
O CMo<br />
<strong>IAEA</strong>-CN-47/A-III-6 189<br />
Source<br />
Probes ^<br />
Vn theory<br />
VTJ theory<br />
0.7 1.1 1.2<br />
FIG. I. Profiles of the radial particle flux V for Ip = 200 kA, Bl = 2 T, he = 3.5 x 70" m~ 3 .<br />
Both experimental (from Ha <strong>and</strong> probes) <strong>and</strong> theoretical ( V« <strong>and</strong> VTJJ cases are shown.<br />
then absolute agreement between rp <strong>and</strong> T* would not be found. Also shown<br />
are the fluxes expected from resistivity gradient driven [5] (V?), related to<br />
the rippling mode) <strong>and</strong> collisional drift wave [6] (V77) turbulence. The VTJ<br />
mode, for which line tying behind the limiter is a stabilizing effect, is the<br />
least, unlikely c<strong>and</strong>idate. It correctly predicts the scalings of F with Ip, Bt<br />
<strong>and</strong> q, but not the scalings with n£, the observed |ir| (see below) or the<br />
inequality e4>/(kT) > ii/n. The sensitivity to ET is under investigation.<br />
In the interior,both impurity (z) <strong>and</strong> working particle (i) profiles <strong>and</strong><br />
transient responses can be characterized by F = — DTVn + nvor/a, with<br />
constant Dr <strong>and</strong> inward v0, except for working ions near the density<br />
limit. For // + or D + , variations with Bt, Ip <strong>and</strong> ne are approximated<br />
by the expressions [7] DT(i), vo{i) oc l/(iieq(a)): typically Dr(H + ) ~<br />
1.4I>r(D + ) ~ 1 m 2 .s~\ while vo(H + ) ~ vo{D + ) ~ lOm-s" 1 . For impurities<br />
(Sc,Ti,Fe) the global confinement r. oc Z^m^gB^ ~ 25ms, with<br />
Dr(z) oc 7»i^ 0 - 5 - In? 2 *- 1 <strong>and</strong> vo(z) oc Z^rn^B; 1 ~ lO?^" 1 . -i»0(;) is<br />
consistent with neoclassical predictions if reasonable functional forms for<br />
impurity concentration n.(r) <strong>and</strong> charge are assumed. As the operational<br />
boundaries are approached,impurity accumulation is observed [8], a result<br />
of increasing |i>0|.<br />
ENERGY TRANSPORT<br />
Behind the limiter the radial energy flux qT = Conduction + Convection<br />
is deduced from power balance, with a parallel sink included to model<br />
flow to the limiter. With ne = 2 x 10 19 nr 3 , Xe(a) ~ lOmh~\ <strong>and</strong><br />
Convection/ QT = 0.15 [4]. If only electrostatic turbulence is to account for
190<br />
WOOTTON et al.<br />
FIR Scattered Power<br />
-1.2 -1.2-0.6<br />
Up/Down<br />
Asymmetry<br />
- Limiter<br />
1 .2<br />
Quasi-coherent<br />
Feature<br />
FIG. 2. Contours over a poloidal cross-section of scattered power S12from FIR Thomson scattering,<br />
for Ip = 300 kA, 5, = 2.8 T,nt- 3.5 x 10> 9 m~ 3 . Incremental values are 0.1; high (H) <strong>and</strong> low (L)<br />
are distinguished. Results are normalized to 1.0 at x/a = 0, yla = 1, where n/n = 0.15.<br />
qr, then Tt/Tt ~ 1 is required, an unreasonably high value. Magnetic fluctuation<br />
levels (b*/Bt - 1CT 4 between 20 <strong>and</strong> 500kHz) do not contribute<br />
significantly: ,\£ ~ 0.03\e. To allow additional q without increasing F (already<br />
explained by F'), either a stationary br or nonthermal parallel flow<br />
could be invoked. As ne is increased, qCOnveci\on/
<strong>IAEA</strong>-CN-47/A-III-6 191<br />
Electron Thermal Diffusivity<br />
102<br />
^ 10 1<br />
I<br />
I)<br />
10-1<br />
10 -2<br />
Exp<br />
D-T<br />
Co I I i s i on Ies s<br />
Col I i s i<br />
0 0.1 0.2 0.3 0.4 0.5 0.6 0.7 0.8 0.9 1<br />
r/o<br />
FIG. 3. Profiles ofxjor Ip = 300 kA, B, = 2.8 T, h~e = 3.5 x 10 19 m~ 3 . Results are shown from a<br />
power balance analysis <strong>and</strong> from three theoretical models for drift wave turbulence (collisional,<br />
collisionless <strong>and</strong> dissipative trapped electron, DT) using estimated (upper curves) <strong>and</strong> measured (lower<br />
curves) values of the saturated nln.<br />
deconvolved from the instrument function, <strong>and</strong> because the assumption of<br />
a spatially independent, fc-distribut ion overestimates the importance of the<br />
quasi-coherent feature. Disagreement both in amplitude <strong>and</strong> spatial dependence<br />
is found. Using measured n/n increases the disagreement because<br />
rc/n(~ 1% at r — 15cm, > rq=i) is less than the usxial estimate of saturation<br />
level (3p3/Ln ~ 15% at r = 15cm). The models also fail to explain the<br />
measured Dr.<br />
RESONANT FIELDS<br />
Externally imposed resonant fields have been used []2] both to create<br />
crgodic layers (proposed as a means of extracting heat <strong>and</strong> reducing impurities)<br />
<strong>and</strong> single isl<strong>and</strong> chains. Coils at r = 33cm with an m — 7,<br />
7? = 3 or 2 structure are computed (vacuum fields only) to produce an<br />
ergodic region for r > 22cm when the multiple sideb<strong>and</strong>s produce overlapping<br />
magnetic isl<strong>and</strong>s: at r = 24cm a coil current //, ~ 5kA produces FSA<br />
(\br\) ~ 1.5 x 10~ 3 7\ Edge parameters become highly asymmetric: e.g. the<br />
probe saturation current,
192 WOOTTON et al.<br />
200 -<br />
150p<br />
-22.<br />
<strong>IAEA</strong>-CN-47/A-III-6 193<br />
probe measurements of electrostatic turbulence, suggesting a causal relationship.<br />
The radial profiles of the fluxes agree at <strong>and</strong> behind the limiter<br />
tip. Resistivity gradient driven turbulence is the least unlikely c<strong>and</strong>idate<br />
investigated to date.<br />
In the main plasma the working <strong>and</strong> impurity ion histories can usually<br />
be explained using a constant Dr <strong>and</strong> inward !>0 model. For the working<br />
gas, both coefficients oc l/(nlq{a)). Impurity accumulation at low Bt is<br />
explained by an increasing VQ.<br />
Behind the limiter, at low density, energy transport cannot be explained<br />
solely by convection. Magnetic fluctuations contribute insignificantly to the<br />
conduction.<br />
Within the main plasma,,\e deduced from power balance oc 1 /(heq(a)) ~<br />
2.5 — 5xDr. Using spatially <strong>and</strong> spectrally resolved values of rj/ra, drift wave<br />
turbulence models are shown to underestimate \e <strong>and</strong> predict incorrect<br />
scalings. At high densities an ion feature has been identified.<br />
Resonant coils have been used to produce both ergodic edge layers <strong>and</strong><br />
coherent isl<strong>and</strong>s. Where isl<strong>and</strong> overlap is expected, Te(a) is reduced from<br />
100 to 30eV<strong>and</strong> interior impurity levels are reduced. Coherent isl<strong>and</strong> structures<br />
have been used to enhance pressure collection within an aperture<br />
limiter.<br />
ACKNOWLEDGMENTS<br />
This work was supported by the U.S. Department of Energy contracts<br />
DE-AC05-78ET-53043, DE-AS05-85ER-53193 <strong>and</strong> DE-AC03-84ER-53158.<br />
REFERENCES<br />
[1] GENTLE, K., Nucl. Technol./Fusion 1 (1981) 479.<br />
[2] ROWAN, W.L., et al., Rep. No. 281, Fusion Research Center, Texas Univ., Austin (1986),<br />
to be published in Nucl. Fusion.<br />
[3] PHILLIPS, P., et al., Rep. No. 291, Fusion Research Center, Texas Univ., Austin (1986).<br />
[4] RITZ, C, etal., ibid.<br />
[5] HAHM, T.S., et al., Rep. No. 180, Institute for Fusion Studies, Texas Univ., Austin (1985),<br />
submitted to Phys. Fluids.<br />
[6] TERRY, P.W., et al., Phys. Fluids 28 (1985) 1419.<br />
[7] GENTLE, K.G., et al., Europhysics Conf. Abstr. IOC Pt 2 (1986) 244.<br />
[8] ISLER, R.C., et al., Phys. Rev. Lett. 55 (1985) 2413.<br />
[9] PERKINS, F.W., in Heating in Toroidal Plasmas (Proc. 4th Int. Symp. Rome, 1984), Vol. 2,<br />
Int. School of Plasma Physics, Varenna (1984) 977.<br />
[10] BROWER, D.L., et al., Phys. Rev. Lett. 54 (1985) 689.<br />
[11] BROWER, D.L., et al., Phys. Rev. Lett. 55 (1985) 2579.<br />
[12] OHYABU, N., et al., Nucl. Fusion 25 (1986) 1684.
194 WOOTTONetal.<br />
DISCUSSION<br />
A. ROGISTER: I would like to make two points: First, the theory of the<br />
rippling instability in toroidal geometry predicts an important up-down asymmetry<br />
of the spectrum of the linear density eigenfunction 1 consistent with that measured<br />
on TEXT. Theoretically, this asymmetry is a consequence of the magnetic drifts <strong>and</strong>,<br />
incidentally, there might be a connection here with the observation reported in<br />
Dr. Wagner's paper 2 on the asymmetric threshold for the transition to the H-mode<br />
in ASDEX.<br />
Second, you mentioned that the electron heat conduction coefficient calculated<br />
from the measured density fluctuation (6n/n) is too small to account for the observed<br />
transport. A similar conclusion was reached in TFR turbulence studies. However,<br />
xe is not simply proportional to (5n/n) 2 , but involves an integral over the poloidal<br />
spectrum, which includes a stronger weighting factor for large kg than the integral<br />
appearing in (6n) 2 . In the case of TFR, I found agreement between theory <strong>and</strong><br />
experiment when the proper calculation was performed.<br />
H.P. FURTH: Towards the edge of your plasmas, you seem to find that various<br />
theoretical transport mechanisms are too weak to account for the observed transport<br />
rates. To be self-consistent, you should really modify transport theory to include the<br />
effect of ionization <strong>and</strong> charge exchange on the modes that are being considered as<br />
c<strong>and</strong>idates to explain the transport. It is easy to see that in a recycling plasma these<br />
effects cannot be neglected unless k > d log n/dr. Have you looked into this<br />
question?<br />
A.J. WOOTTON: We have not yet applied any formulae for the edge particle<br />
or heat fluxes from models which include these considerations.<br />
B. COPPI: Do you have any report to make on the particle diffusion <strong>and</strong> inflow<br />
at the centre of the plasma column?<br />
A.J. WOOTTON: Yes. We have used an oscillating gas puff, with the<br />
FIR interferometer system, to determine D <strong>and</strong> v0, where r = -D v n + nvr/a.<br />
Assuming a constant D <strong>and</strong> v0, we find that both D <strong>and</strong> v0 scale approximately as<br />
l/^q,), with typical values of D = 1 m 2 -s"' <strong>and</strong> v0 - 10 ms" 1 . However, there<br />
are cases where the fitting of the results to the expression is poor, suggesting it is<br />
incorrect to assume that these coefficients are constant.<br />
F. WAGNER: There may be experimental evidence that the transition from the<br />
Ohmic linear regime to the Ohmic saturation regime depends on the edge plasma<br />
parameters. Is the transitional density range affected by the ergodic limiter <strong>and</strong> are<br />
there characteristic changes in the Langmuir probe fluctuation signals at the<br />
transition?<br />
A.J. WOOTTON: We have not made a careful study of this transition with the<br />
applied resonant fields. Concerning the fluctuations at the edge, we have a problem.<br />
Initial results from probes suggested no change in edge electrostatic turbulence with<br />
the resonant fields, as long as the edge density was held constant in the comparison.<br />
However, the discovery of large poloidal asymmetries in ion saturation current —
<strong>IAEA</strong>-CN-47/A-III-6 195<br />
only with applied resonant fields — means we must make the measurements as a function<br />
of poloidal angle before we can answer this question.<br />
D.C. ROBINSON: What fraction of the thermal transport is accounted for by<br />
your measured electrostatic turbulent convection, <strong>and</strong> to what extent do other transport<br />
processes, such as magnetic field fluctuations, account for the edge thermal<br />
transport?<br />
A.J. WOOTTON: We have only made this determination at lower densities<br />
(ne < 3 x 10 19 m~ 3 ) because of the large uncertainties in the power balance estimation<br />
of the total energy transported at the edge. Here we find that perhaps 20%<br />
of the total heat flux is accounted for by convection. Behind the limiter the values<br />
of both T <strong>and</strong> b, in the frequency range up to 250 kHz, are too small to explain the<br />
remaining 80%. The only possible c<strong>and</strong>idates would appear to be a stochastic magnetic<br />
field region, or non-concentric potential <strong>and</strong> density surfaces. The latter, if<br />
present, would negate our agreement between total flux <strong>and</strong> turbulence driven flux.<br />
Behind the limiter a suprathermal electron component might transport more parallel<br />
heat than we have estimated. There is no evidence for such a component.<br />
1<br />
ROGISTER, A., HASSELBERG, G., Paper <strong>IAEA</strong>-CN-47/E-IIM, these Proceedings,<br />
Vol. 2.<br />
2<br />
NIEDERMEYER, H., WAGNER, F., et al., Paper <strong>IAEA</strong>-CN-47/A-II-5, these Proceedings,<br />
Vol. 1.
IMPURITY PRODUCTION<br />
MECHANISMS AND BEHAVIOUR DURING<br />
ADDITIONAL HEATING IN JET<br />
K. BEHRINGER, A. BOILEAU 1 , F. BOMBARDA 2 , G.B. DENNE,<br />
W. ENGELHARDT, M.J. FORREST 3 , G. FUSSMANN 4 ,<br />
R. GIANNELLA 2 , N.A. GOTTARDI, M. VON HELLERMANN,<br />
L. HORTON, H. JACKEL 4 , C. JUPEN 5 , E. KALLNE,<br />
K.D. LAWSON 3 , G. MAGYAR, G.M. McCRACKEN 3 ,<br />
P.D. MORGAN, E.R. MULLER 4 , N.J. PEACOCK 3 , J. RAMETTE 6 ,<br />
B. SAOUTIC 6 , M.F. STAMP, H.P. SUMMERS 7 ,<br />
G. TALLENTS, A. WELLER 4<br />
JET Joint Undertaking,<br />
Abingdon, Oxfordshire,<br />
United Kingdom<br />
Abstract<br />
IMPURITY PRODUCTION MECHANISMS AND BEHAVIOUR DURING ADDITIONAL<br />
HEATING IN JET.<br />
Impurities in JET are investigated by spectroscopic <strong>and</strong> plasma edge diagnostics. Impurity<br />
influxes are measured by visible spectroscopy, allowing identification of impurity sources <strong>and</strong> conclusions<br />
on production mechanisms. Metals <strong>and</strong> carbon in JET plasmas originate mainly from the limiters;<br />
physical sputtering is the release mechanism. Oxygen originates from the walls, presumably by photon<br />
or neutral particle desorption. During ICRH, antenna screen material is released by a process not yet<br />
understood. Transport studies yield D *= 1 m 2 /s for impurities. Ohmic <strong>and</strong> neutral beam heated<br />
plasmas are dominated by light impurities (C, O), in particular by oxygen at high ne. Moderate metal<br />
levels (0.1% n^ during ICRH are responsible for radiation losses of = 20% Ptot. These can be<br />
prevented temporarily by carbonization. Radiative power losses are 30-60% P(ot for NBI <strong>and</strong><br />
40-70% Ptot for ICRH. Zeff ranges between 3.5 at low ne <strong>and</strong> 2.5 at higher ne. During magnetic<br />
separatrix operation, a reduction of metals <strong>and</strong> carbon is observed. The bulk plasma radiation drops<br />
compared to limiter discharges, but there is an additional contribution from the X-point regions. To date,<br />
no accumulation has been observed during NB counter-injection.<br />
1<br />
Institut national de la recherche scientifique, Quebec, Canada.<br />
2<br />
Euratom-ENEA Association, Centro Ricerche Energia, Frascati, Italy.<br />
3<br />
Euratom-UKAEA Association, Culham Laboratory, Abingdon, Oxfordshire,<br />
United Kingdom.<br />
4<br />
Euratom-IPP Association, Max-Planck-Institut fur Plasmaphysik, Garching,<br />
Fed. Rep. Germany.<br />
5<br />
University of Lund, Lund, Sweden.<br />
6<br />
Euratom-CEA Association, Centre d'&udes nucleaires de Fontenay-aux-Roses, France.<br />
7 University of Strathclyde, Glasgow, United Kingdom.<br />
197
198 BEHRINGER et al.<br />
1. INTRODUCTION<br />
Impurities in JET plasmas are studied by a variety of<br />
spectroscopic diagnostics, from the visible to the X-ray range<br />
[1], by bolometers <strong>and</strong> soft X-ray cameras, <strong>and</strong> by charge-exchange<br />
recombination spectroscopy (CXRS). Zeff is derived from visible<br />
bremsstrahlung. Hydrogen <strong>and</strong> impurity influxes, u D <strong>and</strong> p are<br />
measured at various locations in the torus by visible spectroscopy.<br />
For this purpose, line excitation rate coefficients <strong>and</strong><br />
intensities of specific impurity lines have been computed<br />
relating the number of emitted photons to the influx rate [2].<br />
Surface analysis of collector probes, long-term samples <strong>and</strong><br />
limiter tiles provides information on the status of surfaces in<br />
contact with the plasma <strong>and</strong> on the consequences of cleaning<br />
procedures <strong>and</strong> carbonisation. Langmuir probes are used to<br />
measure the plasma edge parameters. The limiter surface<br />
temperatures are monitored by infra-red cameras [3L<br />
2. IMPURITY TRANSPORT AND IMPURITY CONFINEMENT<br />
Emission shells of light impurities <strong>and</strong> low metal ionisation<br />
stages in JET are clearly transport dominated, requiring a<br />
diffusion coefficient D = 1 m 2 /s in order to explain their<br />
position <strong>and</strong> width [4], Information about transport was also<br />
obtained from accidental injections of iron <strong>and</strong> nickel. At<br />
ne=2-10 19 m~ 3 , simulations using D=1 m z /s agree best with the<br />
observed rise <strong>and</strong> decay of nickel line intensities, as shown<br />
in Fig.1 for Ni XXVI. There are indications that D decreases<br />
with electron density <strong>and</strong> increases during additional heating.<br />
Investigations of hydrogen particle transport [5] result in<br />
similar transport coefficients as found for the impurities.<br />
D=1 mVs <strong>and</strong> a drift velocity VD=-2Dr/a 2 are used in<br />
st<strong>and</strong>ard interpretation of VUV <strong>and</strong> X-ray spectra <strong>and</strong> for<br />
calculating radiated power losses of individual impurity species<br />
by means of an impurity transport code [6]. The resulting,<br />
moderately peaked total ion density profiles are confirmed within<br />
a factor of two by analysis of a number of metal ionisation<br />
stages at different radial positions (eg Ni XVII-Ni XXVII).<br />
Sawteeth, observed on lines of higher ionisation stages, can only<br />
be partly explained by pertinent variation of electron<br />
temperature profiles. It must be assumed that impurities are<br />
expelled from within the q=1 surface during the sawtooth crash.<br />
Both the radiated power Ppad <strong>and</strong> Zeff-1 are roughly<br />
proportional to the square of the nuclear charge Z <strong>and</strong> the<br />
concentration of the impurity species. Therefore, normalized,<br />
average radiation losses per unit surface area have been defined<br />
(neglecting hydrogen radiation) where A is the plasma surface<br />
area. Pnorm has been calculated by the impurity transport code<br />
for a variety of JET plasma conditions <strong>and</strong> for the important JET
1.0<br />
0.8 -<br />
0.6 -<br />
0.4 -<br />
0.2 -<br />
0.0<br />
; j<br />
ft<br />
\<br />
\<br />
\<br />
\<br />
1 :<br />
1 '•<br />
1 \<br />
•<br />
\<br />
\<br />
\<br />
A<br />
/<br />
D = 2m 2 /s<br />
\<br />
s<br />
<strong>IAEA</strong>-CN-47/A-IV-l 199<br />
D=0.5m 2 /s<br />
\ N<br />
N<br />
\<br />
N<br />
, i<br />
1<br />
• i i i i t i<br />
i , , i , i<br />
0.0 0.5 1.0 1.5<br />
2.0<br />
Time(s)<br />
N<br />
\^— D=1 m 2 /s<br />
... 0 ^^-Q^<br />
#3610<br />
Ni XXVI<br />
o experiment<br />
6.0 s<br />
165.3 A<br />
FIG. 1. Ni XXVI intensity after accidental nickel injection (ne = 2 x 10 19 nr 3 , Ip = 2.8 MA).<br />
Simulations using different D-values are shown (VD — —2Dr/a 2 ). Recycling at the limiters leads to a<br />
finite level after the event.<br />
0.0<br />
= Pnld/An. 2 (Z.«-1)(10- 3 «kW-m' 1 )<br />
2 3<br />
n, (10 19 /m 3 )<br />
FIG. 2. Normalised power per unit surface area for 1986 JET limiter plasmas. The ranges of Pnorm<br />
predicted by the transport code (D = 1 m 2 /s) for O, C <strong>and</strong> metals are indicated. Corona assumption<br />
leads to much lower Pnorm values for O <strong>and</strong> C. One point each is shown for ASDEX limiter <strong>and</strong> divertor<br />
discharges [7].<br />
O Q<br />
-<br />
_
200 BEHRINGER et al.<br />
impurities. Pnorm is found to be about 0.4-0.9*10~ 38 kW-m" for<br />
light impurities <strong>and</strong> about 0.9-1.2.10" 38 kW-m 1 * for metals. The<br />
lower end of the range corresponds to peaked ne profiles <strong>and</strong> high<br />
Te values, the upper end to flat ng profiles <strong>and</strong> low Te values.<br />
The assumption of corona ionisation equilibrium reduces Pnorm by<br />
a factor of 5-10 for light impurities, because the radiation<br />
shell is then located in the scrape-off layer at low electron <strong>and</strong><br />
impurity ion densities. A summary of experimental PnOrm va l ues<br />
as a function of n is shown in Fig.2 for JET 1986 limiter<br />
discharges (500 data points). The vast majority of measured<br />
values is found in the predicted range. Fig.2 proves clearly the<br />
necessity of including transport in the plasma simulation. Two<br />
ASDEX data points [7] demonstrate the validity of the scaling<br />
with surface area. The detailed behaviour of Pnom with respect<br />
to the different heating schemes will be discussed below.<br />
Impurity particle confinement times, derived from measured<br />
influxes <strong>and</strong> concentrations, agree roughly with calculations on<br />
the basis of a simple diffusion model [2] <strong>and</strong> D=1 m 2 /s, if an<br />
energy of a few eV is assumed for the neutral particles produced<br />
at the limiters. A good correlation of impurity influxes <strong>and</strong><br />
densities has been observed throughout the JET operation, both as<br />
a function of plasma parameters <strong>and</strong> of vessel conditions.<br />
Occasionally, when a steep increase in the Cr influx was<br />
observed,due to chromium evaporation, the metal concentration in<br />
the bulk plasma did not change [2]. These slow particles are<br />
ionised in the immediate vicinity of the limiter surfaces <strong>and</strong><br />
have a high redeposition probability before entering the plasma.<br />
This observation demonstrates that the usual impurity influxes of<br />
C, 0 <strong>and</strong> metals must have a significant kinetic energy to give<br />
rise to the measured impurity concentrations.<br />
3. IMPURITY PRODUCTION<br />
The impurity behaviour of JET limiter discharges was<br />
dominated by the limiter fluxes (wall contribution = 20$ during<br />
OH). Metal concentrations were only significant (> 0.1? ne) if<br />
the carbon limiters were metal-coated after accidental melting<br />
<strong>and</strong> evaporation of wall material (Inconel droplets <strong>and</strong> £2«10 2l m~ 2<br />
uniform coverage [8]). Recently, this has been prevented by<br />
covering large areas of the torus by carbon protection plates. A<br />
particular metal problem during ICRH will be discussed later.<br />
The release of metals from the limiters can be explained by<br />
a combination of sputtering by deuterium <strong>and</strong> by light impurities,<br />
taking into account the respective surface coverage of the carbon<br />
tiles (M/n = °"°- 02 )« The metal fluxes decrease with ne <strong>and</strong><br />
increase with I_; they are inversely correlated with the light<br />
impurity behaviour. These trends, observed before on many other<br />
tokamaks, are due to the temperature dependence of the metal<br />
sputtering yields. In JET, gettering of oxygen by chromium has<br />
been observed to be a further reason for this anti-correlation.
<strong>IAEA</strong>-CN-47/A-IV-l 201<br />
The carbon concentration in JET has been consistently at a<br />
level of a few % ne throughout operation periods. The carbon<br />
production rate behaves similarly to the metal release, but the<br />
dependencies are less pronounced [2]. This observation <strong>and</strong> the<br />
fact that the produced C-particles must have significant kinetic<br />
energy suggest physical sputtering as the prevailing production<br />
mechanism. Furthermore, during temperature excursions of the<br />
limiter surface from 300°C to over 1000°C, no change in carbon<br />
production rate was observed, which means that chemical<br />
sputtering, expected to manifest itself by an increased yield at<br />
about 600°C, is not an important process. There is some evidence<br />
for carbon sputtering by oxygen, but only at unusually high<br />
oxygen levels [2]. The carbon yields measured (C/())Q= 0.05-0.1)<br />
can be explained by a combination of deuterium, oxygen <strong>and</strong><br />
self-sputtering at high T(a) values (>100 eV).<br />
The oxygen fluxes ana concentrations in JET varied primarily<br />
with vessel conditions. The vessel walls constitute the most<br />
important oxygen source <strong>and</strong>, once in the plasma, oxygen recycles<br />
at the limiters. This is apparent from the tendency of oxygen<br />
limiter fluxes to increase throughout a discharge, even if other<br />
parameters are stationary. If the recycling occurs in the form<br />
of CO molecules, the 0 atoms must gain energy in Franck-Condon or<br />
charge-exchange processes. Since no dependence of the oxygen<br />
yield on plasma parameters is observed, the energy threshold for<br />
the respective production mechanism must be very low. During 3 He<br />
discharges, carbon fluxes remained unchanged (c/ij>He=0.13) while<br />
oxygen was substantially reduced. Therefore, chemical processes<br />
or CX neutrals must be responsible for the 0 production.<br />
Due to the above trends, JET plasmas were metal dominated at<br />
low electron densities, if there was significant metal deposition<br />
on the limiters, otherwise carbon was the most important<br />
impurity. At high electron densities, metals disappeared, carbon<br />
was reduced, <strong>and</strong> oxygen dominated. Oxygen concentrations<br />
increased, particularly close to the density limit,_due to enhanced<br />
plasma-wall interaction. Zeff fell steeply with ne when metals<br />
were important <strong>and</strong> was a weak function of n$ for metal-free<br />
plasmas. During discharges limited by the inner-wall protection<br />
tiles, these took over the role of the limiters leading<br />
essentially to the same plasma behaviour.<br />
During ICRF heating on JET, screen material (Cr, Ni) has<br />
been observed to enter the plasma from the ICRH antennae [2,3].<br />
The measured chromium flux from a Cr coated antenna<br />
(10 16 cm~ 2 -s~ l /MW) decreased by a factor 5 during five months'<br />
operation <strong>and</strong> was reduced temporarily (some 10 discharges) by two<br />
orders of magnitude by means of heavy carbonisation (15$ CH^,<br />
12 hrs). In the course of ICRH operation, screen material was<br />
deposited on the limiters <strong>and</strong> eroded again by the plasma, resulting<br />
in higher basic metal levels during an ICRH campaign. The<br />
metal coverage of the limiter carbon tiles was removed by a few<br />
OH or NBI discharges, in accord with model predictions [9]. The<br />
release mechanism of the screen material is not yet understood.
202<br />
UL<br />
? °-<br />
+ OO _<br />
CO CO CO LL X<br />
z z z ec O<br />
O < D * X<br />
BEHRINGER et al.<br />
o < a * x<br />
CV1<br />
o<br />
±Jo<br />
S<br />
o<br />
C\J IC<br />
§<br />
N<br />
00<br />
^1<br />
1
<strong>IAEA</strong>-CN-47/A-IV-l 203<br />
4. ICRH AND NB CO-INJECTION<br />
Both hydrogen <strong>and</strong> impurity influxes increased during<br />
additional heating, leading to a substantial increase in fie><br />
unless the plasma was at the inner wall, which appears to have an<br />
efficient pumping capability. Although the wall fluxes gained in<br />
importance, the plasmas were still dominated by the limiters.<br />
The ne-profile flattened during ICRH; it was unchanged or peaked<br />
during NBI. The hydrogen <strong>and</strong> impurity particle confinement times<br />
decreased in both cases.<br />
Due to the higher electron densities during NBI, oxygen was<br />
the most important impurity. The increase in the 0/C ratio is<br />
well demonstrated by the CXRS results [10], the trends of which<br />
are in excellent agreement with the usual VUV spectroscopic<br />
results, while they tend to give somewhat higher carbon<br />
concentrations. Zeff dropped during NBI, but not to a lower<br />
level than that of OH discharges at the respective higher<br />
densities. For constant ne, the radiated power fraction<br />
p rad /p tot fel1 witn increasing NBI power. However, due to the<br />
pertinent ne~evolution, radiation losses remained around H5%<br />
Ptot, on average. These radiation losses were caused by light<br />
impurities, in particular by oxygen (1-255 n§). Due to the<br />
latter fact <strong>and</strong> a tendency to peaked ne-profiles during NBI,<br />
Pnom-values are at the lower end of the range in Fig.2.<br />
The metal release from the antenna screens during ICRH led<br />
to significant metal densities in the plasma ( = 0.1$ ne, contribution<br />
to Prad = 20$ PfO£» see also [11]) except immediately<br />
after heavy carbonisation. Zeff remained essentially at the OH<br />
value before RF, La there was no benefit of the higher electron<br />
densities. For individual campaigns, the radiated power fraction<br />
increased somewhat with Ppp <strong>and</strong> was generally in the range 40-70$<br />
Ptof Hydrogen minority heating led to higher metal densities in<br />
the plasma than 3 He minority heating, but the difference in Prad<br />
is within the scatter of the data points. Due to some metal<br />
contribution <strong>and</strong> flatter ne-profiles, the Pnorm values for ICRH<br />
in Fig.2 are at the upper end of the predicted range.<br />
During combined NBI <strong>and</strong> ICRH, the consequences of the two<br />
heating schemes essentially added. The metal densities in the<br />
plasma corresponded to the respective RF power. Basic metal<br />
levels <strong>and</strong> limiter coverage built up as during ICRH alone. Zeff<br />
<strong>and</strong> Pro(j/Ptot values for 0H plasmas <strong>and</strong> additional heating are<br />
summarised in Fig.3 for 1986 JET limiter discharges. At higher<br />
electron densities, Zeff was about 2.5 for NBI, ICRH <strong>and</strong> combined<br />
heating, essentially caused by oxygen <strong>and</strong> carbon.<br />
5. MAGNETIC SEPARATRIX<br />
The magnetic separatrix configuration has been successfully<br />
generated in JET (X-point plasmas [12]). In this case, the top<br />
<strong>and</strong> bottom vessel protection tiles act as X-point neutraliser<br />
plates. Even when these plates consisted of Inconel (June 1985),
204 BEHRINGER et al.<br />
no significant metal concentrations were detected in X-point<br />
plasmas. With carbon plates, the carbon level was reduced<br />
compared to the respective limiter discharges during the OH<br />
phase. During NBI, carbon concentrations increased, in contrast<br />
to the behaviour of limiter discharges as demonstrated again by<br />
CXRS [10]. The behaviour of carbon <strong>and</strong> metals indicates a low<br />
plasma temperature in front of the neutraliser plates during OH<br />
discharges <strong>and</strong> therefore a low sputtering yield. After argon<br />
puffing into X-point plasmas, no retention of Ar in the X-point<br />
regions was observed, ie the same amount was found in the bulk of<br />
X-point <strong>and</strong> corresponding limiter discharges, in contrast to the<br />
Doublet III results [13].<br />
The oxygen concentration was not different from limiter<br />
plasmas (= 1.5$ ne). Since metal concentrations were generally<br />
low, X-point operation resulted only in a minor reduction of Zeff<br />
(Zeff * 3 at ne = 1.5«10 19 m" 3 <strong>and</strong> I = 2 MA). The radiation<br />
losses of the Bulk plasma were also somewhat lower, but there was<br />
an additional contribution of the X-point regions of = 50$ Phulk*<br />
The total radiation losses amounted to = 50$ PQ at low densities<br />
(n = 1«10 19 m~ 3 ) <strong>and</strong> approached 100$ at higher densities. NBI<br />
into X-point plasmas led to a low level of wall material in the<br />
plasma, probably due to CX particles hitting the walls. The<br />
oxygen concentration did not change significantly during NBI.<br />
6. NB COUNTER-INJECTION<br />
Counter-injection,both into limiter <strong>and</strong> X-point plasmas, has<br />
been studied for a limited period in JET. The impurity behaviour<br />
of these discharges was virtually indistinguishable from the<br />
corresponding co-injection cases (see Figs 2 <strong>and</strong> 3). Some<br />
peaking of soft X-ray emission profiles was observed <strong>and</strong> the line<br />
intensities of higher metal ionisation stages appeared to<br />
increase more than the lower ones. However, the st<strong>and</strong>ard<br />
analysis taking into account the respective ng- <strong>and</strong><br />
Te-distributions resulted in the usual impurity ion density<br />
profiles within the experimental error bars. For the present NBI<br />
power levels (_< 7 MW) <strong>and</strong> plasma parameters, no accumulation of<br />
impurities has been observed.<br />
7. CONCLUSION<br />
The JET impurity situation is not significantly different<br />
from that of other ungettered tokamaks with carbon limiters.<br />
Metal concentrations in the plasma were very low during OH <strong>and</strong><br />
NBI discharges,due to coverage of large areas of the wall by<br />
carbon tiles. An exception was ICRF heating, where screen<br />
material entered the plasma from the antennae. This will be<br />
prevented in the future by a carbon or beryllium coating of the<br />
Faraday screens presently under investigation. The carbon<br />
concentration was high at moderate electron densities, but, due<br />
to the fact that physical sputtering is the production mechanism,<br />
it decreased at high densities, which are aimed for anyway. At
<strong>IAEA</strong>-CN-47/A-IV-l 205<br />
high fL, radiation losses were mainly caused by oxygen. Well<br />
below the density limit, Prad /p tot was tyP icall y 50$ radiated<br />
from the plasma edge, while the bulk plasma was transport<br />
dominated. A primary aim of future operation must be the<br />
reduction of oxygen levels, which could be most.easily achieved<br />
by gettering. Accumulation of impurities has not been observed<br />
in JET.<br />
REFERENCES<br />
[1] BEHRINGER, K., Rev. Sci. Instrum. 57 (1986) 2000.<br />
[2] BEHRINGER, K., J. Nucl. Mater. 145-147 (1987) 145.<br />
[3] ENGELHARDT, W., Plasma Phys. Controll. Fusion 28 (1986) 1401.<br />
[4] BEHRINGER, K., et al., in Basic <strong>and</strong> Advanced Fusion Plasma Diagnostic Techniques (Proc.<br />
Workshop Varenna, 1986), CEC, Brussels (1987).<br />
[5] CHEETHAM, A., et al., in Controlled Fusion <strong>and</strong> Plasma Heating (Proc. 13th Europ. Conf.<br />
Schliersee, 1986), Vol. 10C, Part I, European Physical Society (1986).<br />
[6] BEHRINGER, K.H., CAROLAN, P.G., DENNE, B., et al., Nucl. Fusion 26 (1986) 751.<br />
[7] MULLER, E.R., Nucl. Fusion 22 (1982) 1651.<br />
[8] BEHRISCH, R., et al., J. Nucl. Mater. 145-147 (1987) 731.<br />
[9] McCRACKEN, G.M., et al., J. Nucl. Mater. 145-147 (1987) 621.<br />
[10] VON HELLERMANN, M.G., et al., in Basic <strong>and</strong> Advanced Fusion Plasma Diagnostic Techniques<br />
(Proc. Workshop Varenna, 1986), CEC, Brussels (1987).<br />
[11] JACQUINOT, J., et al., paper <strong>IAEA</strong>-CN-47/F-I-1, these Proceedings, Vol. 1.<br />
[12] TANGA, A., et al., Paper <strong>IAEA</strong>-CN-47/A-I-1, these Proceedings, Vol. 1.<br />
[13] MAHDAVI, M.A., et al., Phys. Rev. Lett. 47 (1981) 1602.<br />
DISCUSSION<br />
S. KONOSHIMA: Can you describe the entire experimental impurity profile<br />
from the centre up to the edge by a single value of the transport coefficient<br />
D ~ 1 m 2 /s? And is there a significant difference in these values between the<br />
H-mode <strong>and</strong> the L-mode, especially near the edge?<br />
K. BEHRINGER: Within the error bars, the impurity density profiles in JET<br />
can be described by a constant diffusion coefficient D = 1 m 2 /s — the value from<br />
impurity injection — <strong>and</strong> an inward drift velocity vD ~ -2Dr/a 2 . We have no proof<br />
that other models — for example with both D <strong>and</strong> vD varying with radius — could<br />
not provide an equally good description.<br />
There are indications that D increases during the L-mode. During the H-mode,<br />
particle confinement is clearly improved, but there are no systematic studies yet with<br />
respect to the individual transport parameters.<br />
F. WAELBROECK: You attribute the appearance of carbon impurity ions to<br />
physical sputtering. I would therefore like to ask why there is no chemical erosion<br />
in JET, i.e. metal-carbon bonds at the limiter surface. Furthermore, other devices,<br />
for example TEXTOR, show molecular b<strong>and</strong> emission near the limiter. What<br />
happens in the case of JET?
206 BEHRINGER et al.<br />
K. BEHRINGER: Chemical sputtering cannot be excluded completely. If it<br />
does take place, the respective particles must be redeposited before being ionized <strong>and</strong><br />
are thus not detected by emission spectroscopy. The important flux entering the<br />
plasma does not originate from chemical effects.<br />
Molecular b<strong>and</strong> emission near the limiter is observed in JET, but the respective<br />
intensities are very low.<br />
R.J. TAYLOR: Is it possible to fabricate a limiter for JET on which no<br />
recycling of hydrogen or impurities would take place?<br />
K. BEHRINGER: We do not know of any such limiter material, but we would<br />
be grateful for any proposals.
IMPURITY AND PARTICLE TRANSPORT<br />
AND CONTROL IN TFTR<br />
<strong>IAEA</strong>-CN-47/A-IV-2<br />
K.W. HILL, V. ARUNASALAM, M.G. BELL, M. BITTER, W.R. BLANCHARD,<br />
N.L. BRETZ, R. BUDNY, C.E. BUSH 1 , S.A. COHEN, S.K. COMBS 1 ,<br />
S.L. DAVIS, D.L. DIMOCK, H.F. DYLLA, P.C. EFTHIMION,<br />
L.C. EMERSON 1 , A.C. ENGLAND 1 , H.P. EUBANK, R.J. FONCK,<br />
E. FREDRICKSON, H.P. FURTH, G. GAMMEL, R.J. GOLDSTON, B. GREK,<br />
L.R. GRISHAM, G. HAMMETT, R.J. HAWRYLUK, W.W. HEIDBRINK 2 ,<br />
H.W. HENDEL 3 , E. HINNOV, S. H1ROE 1 , H. HSUAN, R.A. HULSE,<br />
K.P. JAEHNIG, D. JASSBY, F.C. JOBES, D.W. JOHNSON, L.C. JOHNSON,<br />
R. KAITA, R. KAMPERSCHROER, S.M. KAYE, S.J. KILPATRICK,<br />
R.J. KNIZE, H. KUGEL, P.H. LaMARCHE, B. LeBLANC, C.H. MA 1 ,<br />
D.M. MANOS, D.K. MANSFIELD, R.T. McCANN, M.P. McCARTHY,<br />
D.C. McCUNE, K. McGUIRE, D.H. McNEILL, D.M. MEADE, S.S. MEDLEY,<br />
D.R. MIKKELSEN, S.L. MILORA 1 , W. MORRIS 4 , D. MUELLER,<br />
V. MUKHOVATOV 5 , E.B. NIESCHMIDT 6 , J. O'ROURKE 7 , D.K. OWENS,<br />
H. PARK, N. POMPHREY, B. PRICHARD, A.T. RAMSEY, M.H. REDI,<br />
A.L. ROQUEMORE, P.H. RUTHERFORD, N.R. SAUTHOFF, G. SCHILLING,<br />
J. SCHIVELL, G.L. SCHMIDT, S.D. SCOTT, S. SESNIC, M. SHIMADA 8 ,<br />
J.C. SINNIS, F.J. STAUFFER 9 , J. STRACHAN, B.C. STRATTON, G.D. TAIT,<br />
G. TAYLOR, J.R. TIMBERLAKE, H.H. TOWNER, M. ULRICKSON,<br />
V. VERSHKOV 5 , S. VON GOELER, F. WAGNER 10 , R. WIELAND,<br />
J.B. WILGEN 1 , M. WILLIAMS, K.L. WONG, S. YOSHIKAWA,<br />
R. YOSHINO 8 , K.M. YOUNG, M.C. ZARNSTORFF, V.S. ZAVERYAEV 5 ,<br />
S.J. ZWEBEN<br />
Princeton Plasma Physics Laboratory,<br />
Princeton University,<br />
Princeton, New Jersey,<br />
United States of America<br />
1<br />
Oak Ridge National Laboratory, Oak Ridge, TN, USA.<br />
2<br />
GA Technologies Inc., San Diego, CA, USA.<br />
3<br />
RCA David Sarnoff Research Centre, Princeton, NJ, USA.<br />
4<br />
Balliol College, University of Oxford, Oxford, UK.<br />
5<br />
Kurchatov Institute of Atomic Energy, Moscow, USSR.<br />
6<br />
EG&G Idaho, Inc., Idaho Falls, ID, USA.<br />
7<br />
JET Joint Undertaking, Abingdon, Oxfordshire, UK.<br />
8<br />
JAERI, Naka-machi, Naka-gun, Ibaraki-ken, Japan.<br />
9<br />
University of Maryl<strong>and</strong>, College Park, MD, USA.<br />
10<br />
Max-Planck-Institut fur Plasmaphysik, Garching, Fed. Rep. Germany.<br />
207
208 HILL et al.<br />
Abstract<br />
IMPURITY AND PARTICLE TRANSPORT AND CONTROL IN TFTR.<br />
Degassing of the TFTR graphite limiter by low density deuterium or helium discharges enables<br />
the limiter to pump deuterium, thereby reducing recycling <strong>and</strong> improving energy confinement in neutralbeam-heated<br />
discharges. During a helium degassing sequence the hydrogen influx decreased by a factor<br />
of 20. As a consequence of degassing sequences the low density limit in 0.8 MA deuterium discharges<br />
decreased from 1 x 10 19 m" 3 to 0.5 x 10 19 irr 3 , the density decay time dropped from greater than<br />
10 s to 0.15 s, <strong>and</strong> the recycling coefficient dropped from nearly 1 to less than 0.4. Zeff values in<br />
2.2 MA L-mode discharges on the toroidal limiter with neutral-beam-heating power up to 15 MW are<br />
between 2 <strong>and</strong> 3 if the pre-beam plasma has low Zeff (high density), but can be as high as 4.5 if the<br />
pre-beam plasma has high Zeff (low density). Zeff values in enhanced confinement shots drop from 7<br />
during the ohmic phase to 3 with neutral beam heating. The radiated power drops from 60-70% of total<br />
heating power to 30-35% for beam powers from 10 to 20 MW.<br />
I. Introduction<br />
Operation of TFTR plasmas on the toroidal graphite limiter<br />
at neutral beam powers up to 20 MW has provided new data on<br />
plasma-limiter interactions at near reactor temperatures <strong>and</strong><br />
densities. Discovery of a new regime of enhanced energy<br />
confinement in beam-heated discharges [ 1 ] has improved prospects<br />
for achieving breakeven in TFTR <strong>and</strong> has provided new insights into<br />
the role of edge particle control. Degassing of the limiter to<br />
achieve low recycling <strong>and</strong> documentation of the effect of the<br />
degassing on plasma confinement have been a focus of recent<br />
experiments [2,3].<br />
A second aspect of plasma-limiter/wall interactions is<br />
impurity production <strong>and</strong> influence of the resulting contamination<br />
on the plasma. Plasma impurity levels in L-mode <strong>and</strong> enhanced<br />
confinement discharges with neutral beam powers up to 20 MW are<br />
discussed. Impurity transport rates have been inferred by<br />
injecting impurities into the plasma <strong>and</strong> studying the time<br />
behavior of their radiation.<br />
II. Conditioning for Particle <strong>and</strong> Impurity Control<br />
The large area toroidal limiter [2] required special<br />
conditioning techniques to achieve satisfactory plasma operation<br />
[4]. Following installation, 130 hours of glow-discharge cleaning<br />
(GDC) <strong>and</strong> 175 hours of pulse-discharge cleaning (PDC) were<br />
performed during a six-week period, with the vacuum vessel heated<br />
to 150 C. After this conditioning, discharges were severely<br />
affected by outgassing of the limiter following a disruption.<br />
Additional PDC <strong>and</strong> a newly developed technique, disruptive<br />
discharge cleaning O(DDC), were used to heat the limiter surface<br />
sufficiently (-1000 C) to effect outgassing of water vapor <strong>and</strong><br />
hydrocarbons. The DDC consisted of a sequence of tokamak<br />
discharges with flat-top currents increasing from 0.6 to 2.5 MA.
<strong>IAEA</strong>-CN-47/A-IV-2 209<br />
The flat-top current was increased progressively by 0.2 MA after a<br />
forced disruption at each current did not affect the succeeding<br />
discharge. When recovery was easy after a 2.5 MA disruption,<br />
ohmic discharges at 2.2 MA had a radiatedjDower fraction less than<br />
50? <strong>and</strong> Z f ~ < 1.5 for ng > 4 x 10^' m~3\ Following a one-week<br />
opening or the vacuum vessel, DDC, in addition to GDC <strong>and</strong> PDC, was<br />
again required to eliminate excessive limiter outgassing caused by<br />
a 2.2 MA disruption.<br />
In contrast, only st<strong>and</strong>ard GDC <strong>and</strong> PDC techniques were<br />
required to prepare both the vacuum vessel <strong>and</strong> the movable<br />
limiter for high power operation, prior to installation of the<br />
toroidal graphite limiter [5]. Following 100-200 discharges, the<br />
radiated power fraction <strong>and</strong> Z f f in ohmic fiducial discharges (I<br />
= 1.4 MA, ne = 2.4 x 10 19 m 3 ) dropped to 60 - 70% <strong>and</strong> 2"<br />
respectively.<br />
The initial enhanced confinement neutral-beam-heated<br />
discharges were obtained only after degassing the graphite limiter<br />
by several tens of low density helium <strong>and</strong> deuterium discharges.<br />
Evidently, desorption of deuterium from the normally saturated<br />
near-surface region of the graphite enabled the limiter to retain<br />
10'<br />
-<br />
-<br />
10-<br />
0000<br />
-<br />
1<br />
<<br />
°oc<br />
1<br />
r= 19 Shots<br />
ne<br />
1<br />
\<br />
°° 00 o °°oo<br />
1<br />
\<br />
1 1 1 -<br />
1.4 MA Helium ~<br />
Conditioning<br />
Shots<br />
0<br />
1<br />
••<br />
0 00<br />
•<br />
1 1<br />
10 15 20 25 30<br />
SHOTS IN THE CLEANUP SERIES<br />
FIG. 1. D/3 emission intensity <strong>and</strong> line-averaged electron density during a sequence of low density<br />
1.4 MA helium limiter degassing discharges. A decrease in the deuterium influx of a factor of 20 indicates<br />
depletion of deuterium from the surface <strong>and</strong> near surface regions of the limiter.<br />
-<br />
35
210 HILL et al.<br />
2 3 4<br />
TIME (s)<br />
FIG. 2. Line-averaged electron density <strong>and</strong> gas fueling rate as a function of time during fiducial<br />
shots on: (a) a well conditioned limiter (solid line) <strong>and</strong> a deconditioned limiter (dashed line), <strong>and</strong><br />
(b) an unconditioned limiter.<br />
incident hydrogen efficiently <strong>and</strong> substantially reduced<br />
recycling. In combination with intense central fueling by neutral<br />
beam injection, the lower recycling produced a more peaked density<br />
profile. During normal enhanced-confinement operation, daily<br />
sequences of about 10 degassing shots were used to keep plasma<br />
performance optimized. About 20-30 degassing shots were required<br />
to recover from gas loading caused by pellet-fueled [6] or<br />
detached plasmas [7].<br />
The hydrogen degassing by a series of 1.4 MA helium<br />
conditioning discharges on the toroidal limiter is illustrated by<br />
Fig. 1. The brightness of the deuterium DB line (n = 4-2<br />
transition), which is a measure of the deuterium influx into the<br />
plasma, decreased by a factor of 20 during this sequence. The<br />
minimum achievable line-averaged electron density also decreased<br />
by a factor of two, as shown, <strong>and</strong> oxygen radiation decreased by an<br />
order of magnitude. This suggests that conditioning discharges<br />
also remove oxygen, possibly in the form of water vapor or CO.<br />
The intensity of carbon radiation changed little during the<br />
sequence.<br />
Two important consequences of the limiter degassing are a<br />
smaller low-density limit <strong>and</strong> a shorter density-decay time,<br />
constant or effective particle confinement time TD, indicated by<br />
faster density pumpout. Both effects are illustrated in Fig. 2a,<br />
which shows the time evolution of the central-chord line-averaged<br />
electron density <strong>and</strong> the gas input rate for 2 shots, one before<br />
<strong>and</strong> one after a 25-shot 0.8 MA ^deuterium degassing sequence. In<br />
contrast, a large value of T (> 10 s) characterized the<br />
toroidal limiter before conditioning sequences were begun<br />
(Fig. 2b). In these fiducial discharges the gas feed is<br />
controlled by feedback to produce a preselected density at t = 2 s
<strong>IAEA</strong>-CN-47/A-IV-2 211<br />
<strong>and</strong> is then shut off. Figure 2a depicts 0.8 MA discharges<br />
programmed to ne = 1.3 x 10 m" 3 , whereas Fig. 2b is a 1.4 MA<br />
discharge programmed to fie = 2.4 x 10 1 ' m~ 3 . The density decays<br />
exponentially to a baseline which is determined by recycling. The<br />
density decay time is determined by the intercept of the dashed<br />
lines, which characterize the initial decay rate, with the minimum<br />
density baseline.<br />
Decay time constants as small as 0.15 s were obtained after<br />
applying helium degassing sequences frequently over a 1000-shot<br />
interval. The sequences were interspersed with series of neutralbeam-heated<br />
shots to test the effectiveness of conditioning on<br />
improving beam fueling <strong>and</strong> energy confinement. During this period<br />
the minimum line-averaged density achievable in 0.8 MA deuterium<br />
discharges decreased from 0.9 x 10 * m~ 3 to 0.55 x 10 ' m~ 3 .<br />
The recycling coefficient in ohmic discharges, R, is<br />
determined from T <strong>and</strong> the particle confinement time, T , by the<br />
equation<br />
T p=itR (D<br />
T as measured by the absolute intensity of the Da emission<br />
is on the order of 0.1s. Thus, the fastest density decay times,<br />
0.15 - 0.3 s3correspond to a recycling coefficient of R < 0.5.<br />
Helium discharges with I = 1.1 <strong>and</strong> 1.8 MA were more<br />
effective in degassing the limiter than were 0.8 MA deuterium<br />
discharges. A few shots in deuterium are required to expel the<br />
residual helium, but the succeeding discharges have lower<br />
densities than can be achieved following conditioning by deuterium<br />
discharges. There are indications that higher current helium<br />
discharges are more effective than lower current discharges.<br />
The limiter degassing effect is easily reversed by exposure<br />
to higher density deuterium plasmas. An estimated 100 torr-liters<br />
(7.1 x 10 21 atoms) of total gas input over a few discharges will<br />
increase the recycling coefficient to approximately 1. Deuterium<br />
gas-fueled 0.8 MA ohmic discharges with ne as low as 1.2 x 10 °<br />
m~3 can produce a noticeable degradation.<br />
The limiter degassing is believed to result from desorption<br />
of hydrogen from the graphite by energetic carbon <strong>and</strong> helium ion<br />
bombardment. Graphite can absorb hydrogen up to a H/C ratio of<br />
0.4 at room temperature. Spectroscopic measurements <strong>and</strong> Z f£.<br />
values of six to seven show that the carbon density in degassing<br />
discharges is high. Recent measurements by Wampler et al. [8]<br />
show that bombardment of saturated graphite by carbon, helium, or<br />
hydrogen ions with energies of 3, 0.6 <strong>and</strong> 0.3 keV, respectively<br />
(consistent with the edge electron temperature <strong>and</strong> sheath<br />
potential in these discharges) removes 5, 2 <strong>and</strong> 1 hydrogen atoms<br />
per incident ion, the latter case resulting in replacement, with
212 HILL et al.<br />
1 4<br />
z<br />
o:<br />
§ 3<br />
2<br />
I<br />
i<br />
Ip= =2.2 MA<br />
Range of<br />
oa<br />
Neutral Beom Power (MW) "~<br />
Min<br />
« 0<br />
o 4.0<br />
Moii<br />
4.0<br />
7.6<br />
1<br />
1<br />
^^<br />
• 7.6 10.5<br />
4 10.5<br />
o 13.0<br />
13.0<br />
i<br />
1 i<br />
1 2 3<br />
neBEFORE NBl<br />
a<br />
do'V 3<br />
FIG. 3. Zeff during neutral-beam injection as a function of electron density before injection, sorted by<br />
ranges of neutral-beam power. The values are near the pre-NBI Zeg values, but somewhat reduced<br />
owing to neutral-beam fueling.<br />
no net removal of hydrogenic species. Also, the yields for<br />
sputtering carbon atoms from graphite are 0.5, 0.09 <strong>and</strong> 0.025<br />
atoms/ion for these three ions. Thus the degassing process is<br />
aided by the low density, high edge temperature, <strong>and</strong> the resultant<br />
high levels of carbon impurities.<br />
Ill. Plasma Impurity Concentrations in the St<strong>and</strong>ard Regime<br />
Impurity concentrations <strong>and</strong> Z ~f have been measured by x-ray<br />
<strong>and</strong> vacuum ultraviolet spectroscopy <strong>and</strong> visible bremsstrahlung;<br />
the total radiated power has been measured by bolometer arrays.<br />
These measurements have documented the effectiveness of impurity<br />
control techniques, provided quantitative data on the variation of<br />
impurities over a wide range of plasma parameters, <strong>and</strong> provided<br />
additional information on impurity sources <strong>and</strong> impurity production<br />
mechanisms [9-11].<br />
The impurity situation in ohmically heated TFTR discharges<br />
is discussed in Refs [9-11]. Impurity concentrations were low<br />
^ Z eff = 1 " 2 ^ at high densitv > but were significant (Zgff = 5-6) at<br />
the low-density limit for 2.2 MA plasmas on either the movable or<br />
toroidal limiter. Discharges on the toroidal limiter had lower<br />
Z a*, at intermediate densities than those on the movable limiter<br />
[T2]. The low-Z impurities, carbon <strong>and</strong> oxygen, ranged from about<br />
10? of electron density (at low ne) to 155 (high ng) <strong>and</strong> were the<br />
dominant contributors to Zgf«f <strong>and</strong> radiated power. The ratio of<br />
carbon to oxygen was about 10 at low density <strong>and</strong> 1 at high<br />
density. Oxygen increased with density <strong>and</strong> dominated the radiated<br />
power at the high density limit [11]. Metals (Cr, Fe, Ni) were<br />
generally negligible contributors to 1Q£f <strong>and</strong> radiated power.
<strong>IAEA</strong>-CN-47/A-IV-2 213<br />
Impurity behavior in 2.2 MA neutral-beam-heated plasmas on<br />
the movable limlter with beam power up to 5.6 MW has been<br />
discussed previously [111. In a beam-power scan at constant final<br />
density (ng = 4.5 * 10 1 ' m~3), z~~ near the end of the 0.5 s<br />
heating pulse increased from less than 2 to about 3 as beam power<br />
increased to 5.6 MW. During a discharge, metal <strong>and</strong> carbon<br />
densities remained constant from the pre-beam to the beam-heated<br />
phase. Thus, higher Ze£f at higher power results mainly from the<br />
lower pre-beam density (<strong>and</strong> therefore higher Zeff) required to<br />
keep the final density constant. The fraction of total input<br />
power radiated decreased from about 50$ in the ohmic phase to 30$<br />
at a beam power greater than 3 MW.<br />
Z eff values in 2 - 2 MA > L-mode beam-power scans on the<br />
toroidal limiter also correlated much more strongly with the<br />
electron density in the pre-beam ohmic heating phase of discharges<br />
than with beam power or with density at the end of injection (Fig.<br />
3). The data, measured by x-ray pulse-height analysis, have been<br />
sorted according to ranges of beam power. Low Z f*> values (< 2)<br />
are achieved during neutral-beam injection (NBI) if the ohmic<br />
target plasma is clean (ne > 3 * 10'9 m"^), while higher Z ff<br />
values during NBI occur if the ohmic plasma is dirty (low<br />
density). The trend is similar to that of pre-beam Z f^ versus<br />
iie, although shifted slightly lower, due to dilution of impurities<br />
by neutral-beam fueling. ^eff va l ues measured from visible<br />
bremsstrahlung emission were on the average 15$ higher than the<br />
values from pulse-height analysis for most of these shots.<br />
The radiated-power fraction in these L-mode discharges on<br />
the toroidal limiter decreased to about 20$ for neutral beam<br />
powers greater than 10 MW.<br />
IV. Impurity Concentrations in Enhanced Confinement Plasmas<br />
The pre-injection target plasmas in enhanced confinement<br />
discharges are carbon dominated, with a total ZQff of six to eight<br />
<strong>and</strong> a Zeff contribution of 0.3 - 1.5 from metals. The carbon<br />
concentration is about 15$ of the electron density. The deuteron<br />
fraction is estimated to be between 10$ <strong>and</strong> 20$, based on the<br />
increase in neutron emission following a small gas puff. During<br />
neutral beam injection, Z ^ from visible bremsstrahlung drops to<br />
2-4 (Fig. 4 <strong>and</strong> earlier data). The earliest enhanced confinement<br />
plasmas had Zeff values of 2-3 during the beam-heating phase, with<br />
a negligible contribution from metals. Subsequent limiter<br />
conditioning <strong>and</strong> plasma operation, spanning 1000 discharges over a<br />
period of five weeks, increased the metal levels by a factor of 10,<br />
presumably by depositing metals removed from inconel hardware near<br />
the limiter onto the graphite surface.<br />
During neutral beam heating, the fueling by the beam<br />
neutrals increases the deuteron fraction to 50-60$ of electron<br />
density <strong>and</strong> decreases the carbon fraction to 5-8$. The fraction
214 HILL et at.<br />
• X<br />
X<br />
7 -<br />
6<br />
~x<br />
5<br />
Sj; 4 -<br />
3 >—<br />
2 _<br />
1—<br />
n<br />
X<br />
•i;<br />
X *<br />
x 0.8 MA<br />
° 0.9 MA<br />
+ 1.0 MA<br />
X<br />
i<br />
X<br />
"x $ * °<br />
* x<br />
1<br />
DO<br />
1<br />
X<br />
a j«<br />
111 *x$ + «f«°j<br />
o<br />
D*2 x n9gnrff 1 B 5 x < D^<br />
c<br />
° o o o B°<br />
O tl<br />
ij<br />
PHEAT(MW)<br />
FIG. 4. Zeg as a junction of total heating power in enhanced confinement discharges.<br />
20<br />
10<br />
0<br />
_ 20<br />
I<br />
3<br />
10<br />
3 4<br />
TIME (s)<br />
4<br />
3<br />
.01 "= 1<br />
1<br />
10<br />
-<br />
n<br />
1<br />
• • i i<br />
/ \<br />
f \ N<br />
FIG. 5. Total radiated power, line-averaged electron density, neutral-beam power <strong>and</strong> poloidal beta,<br />
as a Junction of time during a 1.1 MA enhanced confinement discharge with a 0.7 s beam-heating pulse.<br />
1<br />
/<br />
—<br />
—<br />
-<br />
-<br />
-<br />
-
<strong>IAEA</strong>-CN-47/A-IV-2 215<br />
of total heating power radiated decreases from 60-70? during the<br />
ohmic phase to about 30? for beam powers greater than 10 MW. For<br />
longer pulse (0.7 s) beams the total radiated power saturates<br />
while electron density <strong>and</strong> 8 are still rising, as shown in<br />
Fig. 5.<br />
The impurity transport during beam heating in enhanced<br />
confinement discharges appears to be similar to that during the<br />
ohmic phase. Transport rates were inferred from the time<br />
evolution of vacuum-ultraviolet lines emitted by germanium<br />
injected into the plasma by laser ablation. Comparison of these<br />
intensities with numerical impurity transport code predictions<br />
[13] yielded a diffusion coefficient (assumed to be radially<br />
constant) <strong>and</strong> convective velocity at the limiter radius of 0.65<br />
nr/s <strong>and</strong> 0-0.1 m/s, respectively, in the ohmic phase, <strong>and</strong> 0.75<br />
m 2 /s <strong>and</strong> 0.1 - 0.2 m/s, respectively, during neutral beam<br />
injection. The uncertainty in the convective velocity is a factor<br />
of 2. The impurity confinement time in both cases was<br />
approximately 0.25 s.<br />
V. Summary <strong>and</strong> Conclusions<br />
A disruptive discharge cleaning procedure, in addition to<br />
glow- <strong>and</strong> pulsed-discharge cleaning, was found necessary following<br />
atmospheric exposure to remove water vapor from the large-area<br />
graphite • toroidal limiter <strong>and</strong> permit satisfactory plasma<br />
operation.<br />
Low density deuterium or helium discharges were found to be<br />
effective in degassing the limiter, allowing it to pump hydrogen<br />
<strong>and</strong>, thus, reduce recycling <strong>and</strong> permit improved confinement in<br />
neutral-beam-heated discharges. High carbon concentrations <strong>and</strong><br />
f a PP ear t° a *-d degassing by causing high edge temperatures <strong>and</strong><br />
ing to desorption of deuterium by energetic carbon ion<br />
bombardment.<br />
Relatively low Zef>f. values (about 2) were attained in high<br />
density L-mode discharges on the toroidal limiter, with beam powers<br />
up to 10 MW, <strong>and</strong> values of 2.5 - 3 were found at beam powers up to<br />
15 MW. The trends suggest, however, that the purity of the prebeam<br />
target plasma is a more important determinant of impurity<br />
concentrations during NBI than is beam power or final density.<br />
Enhanced confinement plasmas are characterized by a Z ff. of<br />
six to seven before neutral beam injection <strong>and</strong> two to four during<br />
injection. Zeff decreases with beam power, presumably due to the<br />
dominance of beam fueling in these plasmas.<br />
There is no evidence of significant changes in impurity<br />
transport between ohmic <strong>and</strong> enhanced confinement discharges.
216 HILLetal.<br />
Acknowledgments<br />
We are grateful to J.R. Thompson <strong>and</strong> D. Grove for their<br />
support. This work was supported by US DOE Contract No. DE-ACO2-<br />
76-CHO3O73. The ORNL participants were also supported by US DOE<br />
Contract No. DE-ACO5-84OR214OO with Martin Marietta Energy<br />
Systems, Inc.<br />
REFERENCES<br />
[1] STRACHAN, J.D., et al., submitted to Phys. Rev. Lett.<br />
[2] HAWRYLUK, R.J., et al., paper <strong>IAEA</strong>-CN-47/A-I-3, these Proceedings, Vol. 1.<br />
[3] GOLDSTON, R.J., et al., Paper <strong>IAEA</strong>-CN-47/A-I-4, these Proceedings, Vol. 1.<br />
[4] DYLLA, H.F., et al., submitted to Nucl. Fusion.<br />
[5] LA MARCHE, P.H., et al., J. Nucl. Mater. 145&146 (1987).<br />
[6] MILORA, S.L., et al., paper <strong>IAEA</strong>-CN^7/A-HI-4, these Proceedings, Vol. 1.<br />
[7] STRACHAN, J., et al., in Controlled Fusion <strong>and</strong> Plasma Physics (Proc. 12th Europ. Conf.<br />
Budapest, 1985), Pt. I, European Physical Society (1985) 339.<br />
[8] WAMPLER, W., DOYLE, B., BRYCE, D., submitted for publication.<br />
[9] HILL, K.W., et al., Nucl. Fusion 26 (1986) 1131.<br />
[10] DYLLA, H.F., et al., J. Nucl. Mater. 145&146 (1987).<br />
[11] STRATTON, B.C., et al., submitted to Nucl. Fusion.<br />
[12] BELL, M.G., et al.. Plasma Phys. Controll. Fusion 28 (1986) 1329.<br />
[13] STRATTON, B.C., et al., J. Nucl. Mater. 145&146 (1987).<br />
DISCUSSION<br />
F.C. SCHULLER: It is normally accepted that the high density limit for disruptions<br />
decreases with increasing Zeff. You quote for the high density Ohmic discharges<br />
a Zeff which is considerably lower than that in JET, whilst your density limit<br />
is lower. Do you get 100% radiation just before disruption?<br />
K. W. HILL: In Ohmic discharges, the high density limit in TFTR is higher than<br />
that in JET; however, the Murakami parameters are comparable. The good agreement<br />
in the Zeff determination between the various diagnostics, as described in the<br />
paper, gives us confidence in our low values of Zeff at high density. At the density<br />
limit the power radiated is about 100%. The question then arises whether the usual<br />
Murakami/Hugill parameter coupled with Zeff determines the operating boundary<br />
accurately. Perhaps the operational limit depends, in addition, on plasma elongation<br />
<strong>and</strong> on the toroidal field — in a manner other than that implied by the relationship<br />
given by the Murakami/Hugill parameter.
IMPURITY AND MHD BEHAVIOUR<br />
IN JT-60 DIVERTOR DISCHARGES<br />
JT-60 TEAM<br />
(Presented by H. Takeuchi)<br />
<strong>IAEA</strong>-CN-47/A-IV-3<br />
T. Abe, H. Aikawa, H. Akaoka, H. Akasaka, M. Akiba, N. Akino, T. Akiyama,<br />
T. Ando, K. Annoh, N. Aoyagi, K. Arakawa, M. Araki, K. Arimoto, M. Azumi,<br />
S. Chiba, M. Dairaku, N. Ebiswa, T. Fujii, T. Fukuda, H. Furukawa,<br />
K. Hamamatsu, K. Hayashi, M. Hara, K. Haraguchi, H. Hiratsuka, T. Hirayama,<br />
S. Hiroki, K. Hiruta, M. Honda, H. Horiike, R. Hosoda, N. Hosogane, Y. Iida,<br />
T. Iijima, K. Ikeda, Y. Ikeda, T. Imai, T. Inoue, N. Isaji, M. Isaka, S. Ishida,<br />
N. Itige, T. Ito, Y. Ito, A. Kaminaga, M. Kawai, Y. Kawamata, K. Kawasaki,<br />
K. Kikuchi, M. Kikuchi, H. Kimura, T. Kimura, H. Kishimoto, K. Kitahara,<br />
S. Kitamura, A. Kitsunezaki, K. Kiyono, N. Kobayashi, K. Kodama, Y. Koide,<br />
T. Koike, M. Komata, I. Kondo, S. Konoshima, H. Kubo, S. Kunieda,<br />
S. Kurakata, K. Kurihara, M. Kuriyama, T. Kuroda, M. Kusaka, Y. Kusama,<br />
S. Maehara, K. Maeno, S. Mase, S. Matsuda, M. Matsukawa, T. Matsukawa,<br />
M. Matsuoka, N. Miya, K. Miyati, Y. Miyo, K. Mizuhashi, M. Mizuno, R. Murai,<br />
Y. Murakami, M. Muto, M. Nagami, A. Nagashima, K. Nagashima,<br />
T. Nagashima, S. Nagaya, H. Nakamura, Y. Nakamura, M. Nemoto, Y. Neyatani,<br />
S. Niikura, H. Ninomiya, T. Nishitani, H. Nomata, K. Obara, N. Ogiwara,<br />
Y. Ohara, K. Ohasa, T. Ohga, H. Ohhara, M. Ohkubo, T. Ohshima, K. Ohta,<br />
M. Ohta, M. Ohtaka, Y. Ohuchi, A. Oikawa, H. Okumura, Y. Okumura,<br />
K. Omori, S. Omori, Y. Omori, T. Ozeki, M. Saigusa, K. Sakamoto, A. Sakasai,<br />
S. Sakata, M. Satou, M. Sawahata, M. Seimiya, M. Seki, S. Seki, K. Shibanuma,<br />
R. Shimada, K. Shimizu, M. Shimizu, Y. Shimomura, S. Shinozaki, H. Shirai,<br />
H. Shirakata, M. Shitomi, K. Suganuma, T. Sugie, T. Sugiyama, H. Sunaoshi,<br />
K. Suzuki, M. Suzuki, M. Suzuki, N. Suzuki, S. Suzuki, Y. Suzuki,<br />
H. Takahashi 1 , M. Takahashi, S. Takahashi, T. Takahashi, M. Takasaki,<br />
M. Takatsu, A. Takeshita, H. Takeuchi, S. Tamura, S. Tanaka, K. Tani,<br />
M. Terakado, T. Terakado, K. Tobita, T. Tokutake, T. Totsuka, N. Toyoshima,<br />
H. Tsuda, T. Tsugita, S. Tsuji, Y. Tsukahara, M. Tsuneoka, K. Uehara,<br />
M. Umehara, Y. Uramoto, H. Usami, K. Ushigusa, K. Usui, J. Yagyu,<br />
K. Yamada, M. Yamamoto, O. Yamashita, Y. Yamashita, K. Yano, T. Yasukawa,<br />
K. Yokokura, H. Yokomizo, H. Yoshida, M. Yoshikawa, Y. Yoshinari,<br />
R. Yoshino, I. Yonekawa, K. Watanabe<br />
Naka Fusion Energy Research Establishment,<br />
Japan Atomic Energy Research Institute,<br />
Naka-machi, Naka-gun, Ibaraki-ken,<br />
Japan<br />
1 Princeton Plasma Physics Laboratory, Princeton University, NJ, USA.<br />
217
218 ABEetal.<br />
Abstract<br />
IMPURITY AND MHD BEHAVIOUR IN JT-60 DIVERTOR DISCHARGES.<br />
The diffusion coefficient (DA) <strong>and</strong> the inward peaking factor (Cv) of titanium are estimated from<br />
the experimental evolution of the titanium lines <strong>and</strong> the calculational result of a simulation code:<br />
DA = 1.0 m 2 -s~' <strong>and</strong> Cv = ~0 for ohmically heated plasmas <strong>and</strong> DA = 0.6-0.8 m 2 -s~' <strong>and</strong><br />
Cv = 0 to 1 for neutral beam (NB) injection heated plasmas. No difference in titanium transport is<br />
observed with respect to the direction (co- or counter-) of NB injection. There is no strong titanium<br />
pinch at the centre in divertor discharges, either with or without sawtooth oscillation. — In discharges<br />
with Ohmic <strong>and</strong> NB heating, various MHD activities are observed. The transition from single to<br />
compound sawteeth took place at a resistive diffusion time of TR = iior*/i} a 3.5 s. It is confirmed that<br />
the inversion radius observed in a wide range of qeff = 2.6-6 depends linearly on l/qeff, but is independent<br />
of density, radius, plasma current or heating power.<br />
1. INTRODUCTION<br />
To attain an equivalent breakeven plasma condition, impurities <strong>and</strong> MHD<br />
activity are the most important factors resulting in a degradation of confinement<br />
properties. A single null poloidal divertor has been installed in JT-60 in order to<br />
eliminate the impurities from the main plasma; the MHD activity in the JT-60<br />
divertor configuration was investigated.<br />
Plasma heating experiments with a neutral beam (NB) heating power of up to<br />
20 MW were started in August 1986 with an injection energy of Eb = 50-70 keV,<br />
a beam pulse length of up to 3 s, by eight co- <strong>and</strong> six counter-injection units with<br />
nearly perpendicular angle (78° to the magnetic axis). Hydrogen or helium plasmas<br />
in divertor or limiter configurations in the range of 1 < Ip < 2 MA <strong>and</strong><br />
1.9 < B, < 4.5 T were used as the target. This paper reports impurity <strong>and</strong> relevant<br />
MHD behaviour of ohmically <strong>and</strong> NB heated plasmas in divertor discharges.<br />
In Section 2, quantity <strong>and</strong> species of the impurities <strong>and</strong> their behaviour are<br />
described. Section 3 is devoted to the MHD behaviour of compound sawtooth <strong>and</strong><br />
fluctuation during NB heating. These results will be discussed <strong>and</strong> summarized in the<br />
last section.<br />
2. IMPURITY BEHAVIOUR<br />
Figure 1 shows typical spectra in the wavelength range of 5 to 500 A measured<br />
by a unit type flat field grazing incidence spectrometer in a divertor hydrogen<br />
discharge with B, = 4.5 T <strong>and</strong> Ip = 2 MA. The major impurities were identified to<br />
be oxygen, carbon <strong>and</strong> titanium, which were the coating materials of the first wall.<br />
A small amount of nickel, iron <strong>and</strong> chromium was observed in divertor discharges;<br />
molybdenum lines were also identified in limiter discharges.
<strong>IAEA</strong>-CN-47/A-IV-3 219<br />
200 300 400 500 600<br />
CHANNEL NUMBER<br />
700 800<br />
FIG. I. Typical VUV spectrum recorded by unit type spectrometer, integrated over 20 ms for<br />
B, = 4.5 T, Ip = 2 MA in divertor discharge.<br />
The amount of titanium was estimated from soft X-ray measurements. In<br />
ohmically heated discharges, the amount of titanium was around 1 X 10 ~ 3 % <strong>and</strong><br />
8 x 10~ 3 % at n,. = 2 x 10 13 cm" 3 in hydrogen <strong>and</strong> helium discharges, respectively.<br />
The ratio of titanium to line averaged electron density decreased with the<br />
increase in electron density. For NB heated hydrogen plasmas, the ratio of titanium<br />
to electron density became about twice that in ohmically heated plasmas. And the<br />
quantities of nickel, iron <strong>and</strong> chromium were below 1/10 to 1/100 of that of titanium.<br />
The amount of light impurities in hydrogen discharges was measured by a<br />
Rutherford particle scattering technique, using a diagnostic helium beam with an<br />
energy of 170 keV. This scattering technique is insensitive to metal impurities, for<br />
the present plasma parameters, <strong>and</strong> does not distinguish between light impurity<br />
species. The ratio of light impurity to proton density was 1.2 % or 2.4 % if the species<br />
were assumed to be totally oxygen or carbon, respectively. Zeff as obtained by this<br />
method was 1.5, which was equal to the values obtained from visible bremsstrahlung<br />
<strong>and</strong> simple Spitzer resistivity. Therefore, it was suggested that light ions were the<br />
dominant impurities in JT-60, although the main species contributing to Zeff were<br />
not yet identified by the spectroscopic measurements. Zeff decreased with the<br />
increase in electron density, <strong>and</strong> the Zeff values of NB heated plasmas were slightly<br />
higher than those of ohmically heated plasmas.<br />
The metal impurity (titanium) in plasmas in the limiter configurations is much<br />
higher than that in divertor configurations; this difference was exploited to intentionally<br />
inject titanium into the plasma. Specifically, when a titanium injection into a<br />
divertor discharge was needed the configuration was converted from a divertor to a<br />
limiter configuration within 50 ms, remained in the limiter configuration for 50 ms<br />
<strong>and</strong> then again became a divertor configuration.
220 ABE et al.<br />
(b)s<br />
Co-injection<br />
6.0 6.2 6.4 6.6 6.8<br />
t (s><br />
_10<br />
6 0 6.2<br />
« 8 - Cv=1.0<br />
GO<br />
~ 2<br />
©DA=0.6r<br />
CV=O<br />
" Cy=1.0<br />
Ctr-injection<br />
6.4 t<br />
As<br />
6.6<br />
Is)<br />
i in<br />
T 1<br />
Jl<br />
6.8 7.0<br />
TiXXI<br />
Ka line<br />
6.0 6.2 6.4 6.6 6.8 7.0<br />
I Is)<br />
FIG. 2. Comparison of evolutions of (a) soft X-ray, (b) Ti XXI with co- <strong>and</strong> counter-NB injection.<br />
Titanium is injected intentionally by switching from divertor to limiter configuration <strong>and</strong> back to divertor<br />
configuration.<br />
Figure 2 shows the time evolution of 15-channel soft X-ray diode array signals<br />
<strong>and</strong> the Ti XXI line intensity as measured by a Johan type crystal spectrometer. In<br />
this figure, a NB heating pulse of 7.7 to 8.4 MW, either in co- or counter-direction,<br />
was started at 6.0 s from the start of the discharge, <strong>and</strong> the titanium injection<br />
procedure of 150 ms as described above was started at 6.3 s. The targets were<br />
hydrogen plasmas with S.S5X 10 19 m" 3 , Ip = 1.5 MA <strong>and</strong> Bt = 4.5 T. The<br />
Ti XXI line intensity decreased with a decay time of ~ 200 ms if the minor disruptions<br />
were smoothed out, <strong>and</strong> there was no difference in decay time for different<br />
injection angles. A large m = 1/n = 1 oscillation was observed as the precursor of<br />
internal disruptions in the discharges with counter-injection. The toroidal rotation<br />
speed of the plasma was also calculated with MHD oscillation data, assuming an<br />
m = 1/n = 1 mode; the results were ~4 X 10 4 m-s" 1 <strong>and</strong> ~8 X 10 4 m-s" 1 for<br />
8.4 MW co- <strong>and</strong> 7.7 MW counter-injection, respectively.<br />
The decay of the Ti XXI line intensity was simulated by a 1-D impurity<br />
transport code [1]. The best fittings were obtained with DA = 0.8 m 2 -s"' <strong>and</strong><br />
Cv = 1 for the co-injection case, <strong>and</strong> with DA = 0.6 m 2 -s~' <strong>and</strong> Cv = ~0 for the<br />
counter-injection case. Considering that DA = 1.0 m 2> s"' <strong>and</strong> Cv = —0 for
<strong>IAEA</strong>-CN-47/A-IV-3 221<br />
ohmically heated discharges [2], it was concluded that there was no significant difference<br />
in impurity transport among these three cases. At the same time, it was suggested<br />
that the impurity transport was not affected by a toroidal rotation of<br />
(4-8) X 10 4 m-s -l<br />
3. MHD BEHAVIOUR<br />
In the current flat top phase, the onset of sawtooth oscillations was normally<br />
observed around 2-4 s after breakdown. These sawteeth were observed in the soft<br />
X-ray, ECE (electron cyclotron emission) <strong>and</strong> line electron density signals in both<br />
hydrogen <strong>and</strong> helium discharges. As is shown in Fig. 3(a), large m = odd successor<br />
<strong>and</strong> precursor oscillations were observed in the local <strong>and</strong> full reconnection phases<br />
during a compound sawtooth. The frequency of these oscillations was in the range<br />
of 0.2-1.2 kHz, <strong>and</strong> the density fluctuations were found to be clearly correlated to<br />
the soft X-ray signals. The repetition times of the normal sawtooth oscillation<br />
discharges in ohmically heated plasmas were 25-30 ms for Ip = 1 MA <strong>and</strong><br />
50-80 ms for Ip =2 MA, as is shown in Fig. 4, <strong>and</strong> the compound sawteeth with a<br />
repetition time of 70-140 ms were also frequently observed in discharges with a large<br />
plasma current (Ip > 1.5 MA).<br />
to q 1.5<br />
*
222 ABE et al.<br />
400<br />
FIG. 4. Dependence of sawtooth period TS, on line averaged electron density in divertor discharge<br />
with Ohmic <strong>and</strong> NB heating.<br />
The transition of the normal sawtooth to the compound oscillation one was<br />
analysed by the 1-D tokamak code incorporating the multi-tearing instability. The<br />
onset condition for the compound sawtooth oscillation in JT-60 given by this simulation<br />
was that the resistive diffusion time TR > 3.0 s. This value nearly agreed with<br />
the experimental results (rR > 3.5 s) of the critical plasma current for the onset of<br />
the compound oscillation <strong>and</strong> was also consistent with the experimental result that the<br />
compound oscillation was only rarely observed in helium discharges.<br />
Except for dirty discharges, enhanced sawtooth activity as shown in Fig. 3(b)<br />
was observed in discharges with high power NB heating. Magnetic fluctuations were<br />
measured with a magnetic probe array of 11 coils located at about 5 cm from the<br />
limiter surface. The fluctuation level of 5Bp/Bp was higher than 0.02%, with a<br />
frequency of ~ 1 kHz. The mode was identified as m = 4 <strong>and</strong> synchronized with the<br />
central m = odd oscillation.<br />
MHD bursts as shown in Fig. 3(c) were observed for a NB heating power of<br />
over 17 MW <strong>and</strong> a beam energy of over 70 keV. The central fluctuation observed<br />
with soft X-ray diodes was a compound of an m = odd mode with 1 kHz <strong>and</strong> a higher<br />
mode fluctuation. In one of two cases, the m = 3 magnetic fluctuation of 4 kHz was<br />
synchronized with the higher frequency mode of the central fluctuation, <strong>and</strong> in the<br />
other case the magnetic fluctuation was synchronized with the lower frequency mode<br />
of the central fluctuation. Considering that the toroidal rotation frequency, from<br />
MHD measurements, was comparable to the trapped particle precession frequency<br />
<strong>and</strong> that the central deposition of the intense neutral beam results in the generation<br />
of deeply trapped fast ions, <strong>and</strong> also considering the relatively high poloidal beta in<br />
these discharges, it turned out that the MHD bursts were a result of mode-particle
s/a<br />
<strong>IAEA</strong>-CN-47/A-IV-3 223<br />
o<br />
•<br />
D<br />
/<br />
OH plosma<br />
NBI plasma<br />
DIVA, eip.<br />
o<br />
• i<br />
/<br />
c<br />
o<br />
including \<br />
0/L, H/Hc 1<br />
, i<br />
O.I 0.2 0.3 0.4 0.5<br />
f /G. 5. Dependence of inversion radius rs on Hqeg, where<br />
Qeff =<br />
2ira 2 B,<br />
[-a: — (/Jp<br />
resonance such as the fishbone [3]. However, the inferred flux of fast ions ejected<br />
from the plasma by the instability was not detected with the charge exchange neutral<br />
particle analysers, probably because of a low sampling rate <strong>and</strong> the viewing angle of<br />
the analyser which is looking at the plasma centre <strong>and</strong> is insensitive to the ejected<br />
fast ions. No significant effect of this instability on plasma confinement has been<br />
observed so far, but more investigations of this instability are needed in the future.<br />
Figure 4 shows the sawtooth repetition time TS, as a function of the line<br />
averaged electron density for discharges with Ohmic <strong>and</strong> NB heating. No difference<br />
in TS, was observed between hydrogen <strong>and</strong> helium plasmas. Apparently, the repetition<br />
time for the ohmically heated plasmas is almost independent of the electron<br />
density, the enhancement of the repetition time due to NB heating was longer in the<br />
low density regime <strong>and</strong> the repetition time for NB heated plasmas approached that<br />
of ohmically heated plasmas at fie > 5 X 10" m~ 3 .<br />
Figure 5 shows the normalized inversion radius of the sawtooth rs/a as a function<br />
of the inverse of the safety factor l/qeff, where rs, a <strong>and</strong> qeff are the inversion<br />
radius, the plasma minor radius <strong>and</strong> the safety factor, respectively. The verified data<br />
of JT-60 for discharges with various parameters are plotted in Fig. 5. The DIVA data<br />
[4] are also plotted in the figure. Figure 5 indicates that rs/a depends only on l/qeff<br />
<strong>and</strong> is independent of all other parameters such as plasma configuration, heating<br />
power, ion species, etc.<br />
4. DISCUSSION AND SUMMARIES<br />
Clean plasmas were obtained in divertor configurations, <strong>and</strong> the major impurities<br />
were identified to be oxygen, carbon <strong>and</strong> titanium. The diffusion coefficient <strong>and</strong>
224 ABE et al.<br />
the peaking factor, were estimated to be DA = 1.0 m 2 -s"', Cv ~ 0 in ohmically<br />
heated plasmas <strong>and</strong> DA = 0.8 m 2 -s~', Cv ~ 1 <strong>and</strong> DA = 0.6 m 2 -s"', Cv ~ 0<br />
in discharges with sawtooth oscillation with co- <strong>and</strong> counter- NB injection,<br />
respectively. The difference in the direction of the NB injection did not bring about<br />
any significant difference in titanium impurity transport.<br />
Considering the values of DA <strong>and</strong> Cv in ohmically heated discharges without<br />
sawteeth, it is indicated that there was no significant difference in the impurity transports<br />
between ohmically heated plasmas without sawteeth <strong>and</strong> NB heated plasmas<br />
with sawteeth. The difference in the heating method or the existence of sawtooth<br />
oscillations does not affect the above conclusion. In NB heated plasmas, magnetic<br />
fluctuations with 6Bp/Bp > 0.02% do not seem to enhance the impurity influx,<br />
probably because of the sufficient thickness of the scrape-off layer.<br />
The sawteeth had a compound structure in high current discharges <strong>and</strong> tended<br />
to have large m = 1, continuous oscillations or large MHD bursts in NB heated<br />
discharges. The transition from the normal to the compound sawtooth took place at<br />
a resistive diffusion time of TR > 3.5 s. The repetition time of the sawteeth in<br />
ohmically heated plasmas was almost constant, for a wide range of plasma densities.<br />
The repetition time in the NB heated plasmas was enhanced in the low plasma density<br />
region <strong>and</strong> tended to approach that of the ohmically heated plasmas with high plasma<br />
density. The inversion radius of the sawteeth was determined experimentally in a<br />
wide range of parameters, qeff = 2.6-6, fie = (1-9) X 10 19 m~ 3 , Ip = 1-2 MA,<br />
PNB = 5-20 MW in divertor <strong>and</strong> limiter configurations. The normalized inversion<br />
radius rs/a depends only on l/qeff <strong>and</strong> is independent of all other parameters.<br />
ACKNOWLEDGEMENTS<br />
The authors wish to thank the members of JAERI who have contributed to the<br />
JT-60 project throughout its progress. They further wish to express their gratitude<br />
to Drs S. Mori, Y. Iso, <strong>and</strong> K. Tomabechi for continued encouragement <strong>and</strong> support.<br />
REFERENCES<br />
[1] HIRAYAMA, T., et al., in Plasma-Surface Interactions in Controlled Fusion Devices (Proc. 7th<br />
Int. Conf. Princeton, 1986) (to be published).<br />
[2] HIRAYAMA, T., et al., Rep. JAERI-M 86-161 (October 1986).<br />
[3] McGUIRE, K., et al., Phys. Rev. Lett. 50 (1983) 891.<br />
[4] DIVA GROUP, Nucl. Fusion 20 (1980) 271.<br />
DISCUSSION<br />
R.J. GOLDSTON: You discussed oscillations at high beam power which you<br />
thought might be related to PDX fishbones. Could you tell us how their frequency<br />
is related with the fast ion precession frequency?
<strong>IAEA</strong>-CN-47/A-IV-3 225<br />
H. TAKEUCHI: The fast ion precession frequency is comparable to the toroidal<br />
rotation frequency from MHD measurements.<br />
K. McGUIRE: I noticed that your soft X-ray signal showed a very large<br />
increase in the first second. Do you have a large influx of impurities during this time?<br />
H. TAKEUCHI: The JT-60 discharge started with the limiter configuration,<br />
<strong>and</strong> at 0.33 s the limiter configuration was switched to divertor type configuration.<br />
After the switching, the impurity flux was gradually reduced by the divertor effect.
DENSITY LIMIT AND<br />
IMPURITY TRANSPORT INVESTIGATIONS<br />
IN DITE TOKAMAK<br />
J. ALLEN, G.E. AUSTIN, K.B. AXON, R. BARNSLEY 1 ,<br />
M. DUNSTAN, D.N. EDWARDS, K.D. EVANS 1 ,<br />
<strong>IAEA</strong>-CN-47/A-IV-4<br />
S.J. FIELDING, D.H.J. GOODALL, W. HAN, N.C. HAWKES,<br />
J. HUGILL, P.C. JOHNSON, G.M. McCRACKEN,<br />
G.F. MATTHEWS, W. MILLAR, N.J. PEACOCK,<br />
C.S. PITCHER, J. PRTTCHARD, A. SYKES,<br />
M.F. TURNER, J.P. WEBBER<br />
Euratom-UKAEA Fusion Association,<br />
Culham Laboratory,<br />
Abingdon, Oxfordshire,<br />
United Kingdom<br />
Abstract<br />
DENSITY LIMIT AND IMPURITY TRANSPORT INVESTIGATIONS IN DITE TOKAMAK.<br />
The processes leading to disruption with increasing density have been studied. The discharge<br />
remains in thermal equilibrium but there is a slow profile contraction as the density is raised because<br />
of a deterioration in edge confinement relative to the centre. This is only partly explained by radiation<br />
losses. — The central confinement time of impurities injected by laser ablation has been measured. At<br />
high density in ohmically heated discharges, it can be varied by more than a factor of five by changing<br />
the gas feed rate. The largest values occur for refuelling by recycling only. Substantial differences also<br />
occur with co- <strong>and</strong> counter-neutral beam injection, which are not sensitive to the gas feed rate in this<br />
case. These differences cannot be mainly ascribed to plasma rotation because they are not removed by<br />
switching on the bundle divertor, which reduces the rotation speed by an order of magnitude. An<br />
accumulation of intrinsic impurities is observed in discharges with long impurity confinement times. The<br />
effects described are much reduced or absent at low density.<br />
1. INTRODUCTION<br />
Recent experimental work on DITE tokamak has concentrated<br />
on studies of the limit set by disruption at high density <strong>and</strong><br />
the confinement of impurities with <strong>and</strong> without the bundle<br />
divertor. The main machine parameters used were: major<br />
radius, R=1.17m; poloidal carbon limiter radius = 0.26m;<br />
adjustable rail limiter <strong>and</strong> divertor separatrix radius =<br />
1 University of Leicester, Leicester, UK.<br />
227
228 ALLEN et al.<br />
0.21m; toroidal field, B = 2.0-2.6T; plasma current, I =<br />
0.1-0.25MA; tangential neutral H beam injection, P. . ;< 1.6MW<br />
at E = 25 keV. The working gas was generally helium for<br />
highest density operation, with some lower density work in<br />
deuterium.<br />
Preliminary results on the density limit were given<br />
previously [l]« Here, we summarise the main conclusions of<br />
more recent work. Studies of impurity transport were intended<br />
to complement previous work on energy <strong>and</strong> particle exhaust in<br />
diverted discharges [2] <strong>and</strong> to explain the generally lower<br />
intrinsic impurity levels observed with both ohmic <strong>and</strong> beam<br />
heating. Non-diverted discharges used for comparison purposes<br />
showed some interesting new behaviour which is reported in<br />
Section 3.<br />
2. INVESTIGATION OF THE DENSITY LIMIT<br />
Disruption at high density is almost invariably preceded<br />
by rapidly growing poloidal field oscillations of low mode<br />
number. The aim of the present study is to identify the<br />
processes leading to their destabilisation: in particular to<br />
determine whether there is a radial collapse of the discharge<br />
due to thermal instability or a sudden change in transport due<br />
to the onset of other instabilities, such as ballooning modes.<br />
Relatively high q-values of 4-8 were employed to avoid effects<br />
due to operation near q=3 <strong>and</strong> q=2.<br />
In ohmically heated discharges there is a gradual<br />
narrowing of the plasma current <strong>and</strong> temperature profiles. A<br />
reduction in peripheral temperature is measured by probes <strong>and</strong><br />
Marfes [3] may appear, especially in helium. The soft X-ray<br />
sawtooth inversion radius increases <strong>and</strong> the radial positions<br />
of peaks in line radiation from low charge states of carbon<br />
<strong>and</strong> oxygen ions move inwards. These last two effects are<br />
illustrated in Fig.l. For q>6 profile narrowing leads to the<br />
appearance of detachment from the limiter [4], However, there<br />
is no rapid profile contraction due to an unstable thermal<br />
equilibrium. Detached discharges can be maintained for times<br />
>20 -cE.<br />
Disruption is preceded by a rapid growth (y 5 10 3 s""*) in<br />
the amplitude of poloidal field fluctuations, usually
0-8<br />
M<br />
= 06<br />
I
230 ALLEN et al.<br />
The experimentally measured radiation loss at disruption<br />
is ~65% at q=4 rising to ~80% at q>6. However, the limiters<br />
receive only about 10% of the input power, the remainder being<br />
so far unaccounted for. Line radiation from a large Marfe<br />
indicates local temperatures in the range 5-15eV <strong>and</strong> can<br />
account for up to 50% of the total radiation. A substantial<br />
fraction of the input power must be conducted to the periphery<br />
of the discharge in this case to support the losses in the<br />
Marfe. Attempts to raise the peripheral temperature by<br />
applying neutral beam injection heating produce instead an<br />
increase in radiation from the Marfe. The density limit is<br />
increased but not indefinitely. At q=4 the Murakami parameter<br />
increases from 2.2 to 4.0 in deuterium <strong>and</strong> from 3.8 to 5.3 in<br />
helium, with up to 1.5 MW of neutral beam power. The Marfe<br />
can be avoided by adjusting the plasma position in the limiter<br />
aperture but this does not affect the density limit<br />
appreciably. It appears to be a symptom of low edge<br />
temperature rather than the cause of it.<br />
In detached discharges the Marfe is usually absent.<br />
However, probe measurements of Mach number inside the limiter<br />
radius, which show no appreciable flow in normal discharges,<br />
reveal substantial flow along the magnetic field (up to Mach<br />
0.4) in detached discharges. These measurements indicate<br />
large scale convection in the peripheral plasma whose flow<br />
pattern however, could not be fully explored with the existing<br />
probes.<br />
3. IMPURITY TRANSPORT IN NON-DIVERTED DISCHARGES<br />
3.1 Experimental method<br />
The transport of impurities was investigated using pulsed<br />
sources of impurity, principally aluminium introduced by laser<br />
ablation. A Bragg X-ray spectrometer [6] yielded most of the<br />
spatial, temporal <strong>and</strong> spectral survey information about<br />
central impurities. Additional data was provided by<br />
instruments covering the ultraviolet <strong>and</strong> visible spectral<br />
regions <strong>and</strong> by two orthogonal soft X-ray cameras <strong>and</strong> a<br />
bolometer camera.
<strong>IAEA</strong>-CN-47/A-IV-4 231<br />
Spatial scans show that AA XII <strong>and</strong> Ai, XIII emission lines<br />
originate from the discharge centre. We find that T (o)<br />
varies little during the period of measurement <strong>and</strong> thus the<br />
rate of decay of either line, after correction for the density<br />
variation, provides a direct measurement of the central<br />
impurity confinement time, x.<br />
imp<br />
3.2 Ohmically heated discharges<br />
A new result is the strong dependence of -r on the<br />
discharge dynamics at high density [7]. Fig.2 shows x.<br />
versus "n for two density scans in helium. In one scan n<br />
was maintained approximately constant by recycling, x•<br />
increases with "n <strong>and</strong> reaches values in excess of 150ms. At<br />
e<br />
high density an accumulation of intrinsic impurities is<br />
deduced from the soft X-ray <strong>and</strong> bolometer camera data, similar<br />
to that seen on Pulsator [8] <strong>and</strong> more recently in B-regime<br />
discharges on T-10 [9]. In the second scan n was ramped by<br />
additional gas feed during the period of measurement. At low<br />
density x is not affected but it reaches a maximum <strong>and</strong> then<br />
imp _<br />
decreases as n is raised. The latter dependence is similar to<br />
ne (10'V 3 )<br />
FIG. 2. Variation of impurity confinement time with mean line of sight density for aluminium injection<br />
in Ohmic Umiter discharges, o, A — rising density {dnjdt > 1.5 x 10?° m~ 3 -s~'); •, A —constant<br />
density (dnjdt < 2.5 X 10 19 nf 3 -^ 1 )- °. • - Al XII; A, A - Al XIII.
232 ALLEN et al.<br />
250<br />
ne(10 19 iTf 3 )<br />
FIG. 3. Variation of impurity confinement time with mean line of sight density for aluminium injection<br />
in neutral beam heated limiter discharges, o, a, A — co-injection; •, •, A — counter-injection.<br />
Q, • — 0.4 MW; a, m - 0.8 MW; A, A — 1.1 MW.<br />
that in Alcator, which resulted in a scaling for %.<br />
— r i imp<br />
independent of n L^J* The density at which the two scans<br />
diverge is about 50% of the disruptive limit <strong>and</strong> increases by<br />
a factor of 1.5 when the current is raised from lOOkA to<br />
150kA. In spite of the factor of five variation in<br />
x. at high density, there is no indication of corresponding<br />
imp r .<br />
changes in energy transport, as observed in T-10 \_9\; <strong>and</strong><br />
there is no change in the period of sawtooth oscillations,<br />
which is approximately proportional to n .<br />
3.3 Beam heated discharges<br />
The variation of t. with n in discharges heated by co<strong>and</strong><br />
counter-injection is shown in Fig.3. In this case<br />
refuelling by the beams cannot be avoided <strong>and</strong> additional gas<br />
feed does not affect % Toroidal rotation speeds of<br />
imp*<br />
10 5 me~ 1 are found, decreasing with increasing density. At<br />
low density co- <strong>and</strong> counter-injection give similar values for<br />
T. , as observed on PLT [ill. However, at high density,<br />
imp<br />
counter-injection gives higher values of -u. than<br />
co-injection, as seen on ISX-B [l2], <strong>and</strong> t. decreases, for<br />
both directions, as the injection power is raised.
4. IMPURITY BEHAVIOUR WITH BUNDLE DIVERTOR<br />
4.1 Ohmically heated discharges<br />
<strong>IAEA</strong>-CN-47/A-IV-4 233<br />
The confinement of injected impurities in diverted<br />
discharges is broadly similar to that in limiter discharges.<br />
The highest values of x. again occur without gas feed, which<br />
imp<br />
results in a falling density due to particle exhaust. The<br />
amount of injected impurity reaching the centre is not reduced<br />
by the divertor, thus the reduction of intrinsic impurity<br />
content [2] is not explained by a screening effect. It is<br />
consistent with a decrease in impurity generation at the walls<br />
<strong>and</strong> limiters due to the divertor exhaust.<br />
4.2 Beam heated discharges<br />
At high density, diverted plasmas have somewhat larger<br />
values of x. for co-injection, but a substantial difference<br />
imp<br />
between co- <strong>and</strong> counter-injection remains. Since the divertor<br />
field reduces the speed of rotation produced by injection by<br />
an order of magnitude [l3] it is clear that rotation is not<br />
the only factor producing this difference.<br />
5. CONCLUSIONS<br />
5.1 Density limit<br />
Disruption at high density is preceded by a gradual<br />
narrowing of the temperature <strong>and</strong> current profiles, while the<br />
discharge remains In thermal equilibrium. Disruption is<br />
immediately preceded by a rapidly growing 2/1 mode. Profile<br />
contraction Is partly explained by radiation losses but there<br />
is evidence that increased peripheral transport losses also<br />
play a role.<br />
5.2 Impurity transport<br />
At high density, % is strongly affected by refuelling<br />
<strong>and</strong> by the direction (<strong>and</strong> magnitude) of neutral beam<br />
injection. With no gas feed or with counter-injection large
234 ALLEN et al.<br />
values of x <strong>and</strong> accumulation of intrinsic impurities are<br />
imp<br />
observed. These effects are reduced or absent at low<br />
density.<br />
Application of the divertor has no significant effect on<br />
x, in ohmically heated discharges. The toroidal rotation<br />
imp<br />
produced by beam injection is reduced by an order of<br />
magnitude, however substantial differences in x. for co- <strong>and</strong><br />
counter-injection remain. Thus the role of rotation in<br />
impurity transport remains to be clarified.<br />
Although the variation in x. in high density ohmically<br />
imp<br />
heated discharges is produced experimentally by changes in<br />
edge conditions, the effect appears to be associated with the<br />
central transport of background plasma rather than with edge<br />
processes.<br />
ACKNOWLEDGEMENTS<br />
We would like to acknowledge the contribution of D. Bell,<br />
R.W. Storey <strong>and</strong> the operations team in maintaining <strong>and</strong><br />
operating the DITE experiment <strong>and</strong> neutral beam injectors.<br />
REFERENCES<br />
[1] ALLEN, J.M., et al., Plasma Phys. Control. Fusion 28 (1986) 101.<br />
[2] JOHNSON, P.C., et al., in Plasma Physics <strong>and</strong> Controlled <strong>Nuclear</strong> Fusion Research 1984 (Proc.<br />
10th Int. Conf. London, 1984), Vol. 1, <strong>IAEA</strong>, Vienna (1985) 239.<br />
[3] LIPSCHULTZ, B., et al., Nucl. Fusion 24 (1984) 977.<br />
[4] McCRACKEN, G.M., et al., to be published in J. Nucl. Mater. (1987).<br />
[5] HOPCRAFT, K.I., TURNER, M.F., Phys. Rev. Lett. 56 (1986) 2372.<br />
[6] BARNSLEY, R., et al., Rev. Sci. Instrum. 57 (1986) 2159.<br />
[7] BARNSLEY, R., FIELDING, S.J., HAWKES, N.C., et al., submitted to Phys. Rev. Lett.<br />
[8] ENGELHARDT, W., et al., in Plasma Physics <strong>and</strong> Controlled <strong>Nuclear</strong> Fusion Research 1978<br />
(Proc. 7th Int. Conf. Innsbruck, 1978), Vol. 1, <strong>IAEA</strong>, Vienna (1979) 123.<br />
[9] BAGDASAROV, A.A., et al., in Controlled Fusion <strong>and</strong> Plasma Physics (Proc. 12th Europ.<br />
Conf. Budapest, 1985), Vol. 9F/1, European Physical Society (1985) 207.<br />
[10] MARMAR, E.A., RICE, J.E., ALLEN, S.L., Phys. Rev. Lett. 51 (1983) 455.<br />
[11] SUCKEWER, S., et al., Nucl. Fusion 24 (1984) 815.<br />
[12] ISLER, R.C., et al., Nucl. Fusion 23 (1983) 1017.<br />
[13] HAWKES, N.C., PEACOCK, N.J., Nucl. Fusion 25 (1985) 971.
<strong>IAEA</strong>-CN-47/A-IV-4 235<br />
DISCUSSION<br />
K. IDA: Is the impurity transport observed in DITE neoclassical transport? If<br />
so, can you use the neoclassical theory to explain the long confinement time for impurity<br />
injected into the plasma with constant density <strong>and</strong> the difference in impurity<br />
transport between the co-injection case <strong>and</strong> the counter-injection case?<br />
P.C. JOHNSON: Some of the observed effects can be explained using arguments<br />
based on neoclassical theory, for example the switching on <strong>and</strong> off of a temperature<br />
gradient screening term in the Ohmic high density cases. However, we do not<br />
have profile data of sufficient accuracy for a detailed comparison of experiment with<br />
neoclassical theory. The results with central beam heating suggest that processes<br />
other than neoclassical ones are important.
STUDIES OF<br />
EDGE PLASMA PHENOMENA IN T-10<br />
K.F. ALEXANDER, L. DIETRICH, H. GROTE,<br />
K. GUNTHER, J. LINGERTAT<br />
Akademie der Wissenschaften der DDR,<br />
Zentralinstitut fur Elektronenphysik,<br />
Berlin, German Democratic Republic<br />
E.L. BEREZOVSKU, A.V. CHANKIN, V.M. CHICHEROV,<br />
S.E. LYSENKO, V.A. MEDVEDEV, A.Yu. PIGAROV,<br />
V.I. PISTUNOVICH, S.V. POPOVICHEV, V. VERSHKOV<br />
I.V. Kurchatov Institute of Atomic Energy,<br />
Moscow, Union of Soviet Socialist Republics<br />
Abstract<br />
<strong>IAEA</strong>-CN-47/A-IV-5<br />
STUDIES OF EDGE PLASMA PHENOMENA IN T-10.<br />
A scoop limiter equipped with Langmuir <strong>and</strong> heat flux probes in its scoop channels has been<br />
operated in T-10. Results concerning the properties of the scoop plasma <strong>and</strong> the neutral gas pressure<br />
in the pump duct are reported together with a Monte Carlo simulation of the neutral component which<br />
fairly well agrees with the observations. A 3-D model of the scrape-off layer (SOL) in tokamaks has<br />
been developed <strong>and</strong> evaluated with respect to plasma density, taking into account the multiplicity of<br />
connection lengths due to the complex interplay of the q-dependent magnetic topology <strong>and</strong> the particular<br />
limiter geometry (rail limiter in T-10). It turns out that such a SOL is highly non-uniform in accordance<br />
with experimental data from direct Langmuir probing, limiter thermography <strong>and</strong> a post mortem investigation<br />
of limiter damage. Results of a 2-D Monte Carlo calculation (geometry of T-10) of the distribution<br />
of neutrals originating from the limiter by recycling, considering the effect of backscattering, show<br />
good agreement with corresponding measurements <strong>and</strong>, furthermore, can explain the discrepancy<br />
between the neoclassical <strong>and</strong> the observed magnitude of ion heat transport: it is the neutrals that are<br />
the carriers of the additional efflux of ion energy in question.<br />
1. Further results of measurements with a scoop limiter<br />
Fig.ia shows the sketch of a scoop limiter with instrurrentation<br />
which has been used in T-10 to study the scoop plasma <strong>and</strong><br />
the neutral gas in the pump duct in dependence on discharge<br />
parameters. Details of the experiment <strong>and</strong> main results have<br />
already been reported [1].<br />
In typical T-10 regimes the electron density, ne, in the<br />
scoop channels on the electron <strong>and</strong> ion drift sides increases with<br />
growing rTe (Fig.i.b) while the electron temperature Te decreases<br />
down to about 5 eV, which leads to an only weak n*e-dependence of<br />
Js, the sum of saturation currents of the probes at the entrances<br />
of both channels (0s 10 19 m" 3 . With the two<br />
237
238 ALEXANDER et al.<br />
pairs of probes at different minor radii (Ar = 1 crn) it was<br />
possible to determine the decay length A (e-foliing length for<br />
Jj.) . Fig.1c,d shows a strong e-i-side asymmetry of A depending on<br />
the direction of the magnetic field. A is always larger on that<br />
side of the limiter where the plasma influx comes from the outer<br />
side of the torus, in accord with an argument given in [1] about<br />
the preponderance of plasma escape to the outer torus side.<br />
By comparison of the signals from the outer <strong>and</strong> inner probes<br />
in each channel it turned out that the electron temperature is<br />
largely constant along a channel. The mean value of the floating<br />
potentials of the probes on both sides of the neutralizer plate<br />
was not much different from the limiter potential, indicating<br />
ambipolarity of the plasma flow in the channels. The heat flux<br />
probes (thermocouples) at the neutralizer plate generally displayed<br />
an average power input equal to 7JsTe/e.<br />
As to the gas pressure, p^, in the pump duct, the finding [1]<br />
that Pj depends non-linearly on the plasma influx into the channel<br />
can be reproduced by Monte-Carlo calculations. The plates are<br />
the source of the neutral gas. In the equilibrium the production<br />
rate of neutrals balances the plasma flux into the channel<br />
$o = n e c si where Cs is the sound velocity. The trajectories of<br />
neutrals were simulated in two dimensions using the code DDC-83<br />
[4-,5], which takes into account the processes of dissociation,<br />
charge exchange, stepwise ionization, backscattering, <strong>and</strong> reemission.<br />
The calculated dependence of the gas pressure in the pump<br />
duct on the plasma influx $o is shown in Fig.ie for two values of<br />
the plasma temperature. Especially at low temperatures (T = 5 eV)<br />
the gas pressure rises considerably faster than #o above a critical<br />
value of 7 eV) ionization of atoms <strong>and</strong> dissociation of molecules with<br />
ion production become important. Consequently, a smaller number<br />
of neutrals relative to $0 can reach the pump duct <strong>and</strong> the pressure<br />
rise is not so steep.<br />
More realistically, it was assumed that the temperature<br />
decreases with increasing $o as observed experimentally. The<br />
dependence of p
•ff Heat flux probes<br />
(graphite)<br />
0 2 4<br />
n,(10 m )<br />
<strong>IAEA</strong>-CN-47/AIV-5 239<br />
|2<br />
•° [21mm g 3.2-<br />
Langmuir probes<br />
o graphite, •tungsten<br />
:ici<br />
- BtlJ<br />
°aa<br />
0<br />
A . •<br />
(d)<br />
BH3<br />
4 0 2 4<br />
ne(10 m )<br />
" / •<br />
2.4<br />
)<br />
J=5ev/r=T($0<br />
1.6<br />
0.8<br />
•BIIJ<br />
• BIIJ<br />
0 1 2 3<br />
$o( $o(10 23 slm 2 )<br />
FIG. 1. Results of scoop limber operation in T-10. (a) Limiter design (section in toroidal direction),<br />
(b) Electron density in the two scoop channels (O electron side, • ion side) <strong>and</strong> sum of saturation currents<br />
of channel entrance probes (ofor B,\ \JP, • for B,\ \JP) as a function of line averaged density<br />
nt in the discharge (B, = 2.1-2.5 T, JP = 200-250 kA, a = 28 cm;. (c), (d) Radial decay length<br />
referring to saturation current as a function of ne for normal (c) <strong>and</strong> reversed (d) magnetic field (open<br />
symbols: electron side, closed symbols: ion side). Symbol shape indicates different discharge regimes<br />
(B, = 2.2-3.0 T, Jr = 200-350 kA, a = 26.5-28.0 cm), (e) Gas pressure in scoop limiter pump duct<br />
as a function of plasma influx at channel entrance. Experimental data <strong>and</strong> model calculations.<br />
the symmetry-breaking effect of limiter configurations is of<br />
particular interest. While an aperture limiter leads to a relatively<br />
simple two-dimsnsional situation in cylindrical geometry<br />
[2], the case of a single rail limiter as used in T-10 can only<br />
be mat by a 3-D approach with properly taking account of the<br />
magnetic topology in dependence on the safety factor g(i").<br />
2.1. Theory<br />
Fig.2 illustrates the problem. The "reference cross-section"<br />
(RCS) shown on the left is defined as the minor cross-section at<br />
the toroidal position opposite to the limiter, ie 180° away from<br />
it. The different connection lengths, L(l , of flux tubes give rise<br />
to a poloidal variation of plasma parameters in addition to the<br />
radial one, <strong>and</strong> the numerical treatment of cross-field transport<br />
requires a sufficiently fine grid in polar coordinates. Along<br />
each field line, however, there will be no great variation within<br />
half a revolution round the torus, ie up to the limiter section,<br />
because the flux tubes usually have a length of several revolutions:<br />
L|, = L0W = 27rR0W. This may justify our taking the whole<br />
toi*us circumference along a field line (««Lo), beginning <strong>and</strong><br />
ending at the limiter section, as the elementary interval Ax for<br />
the treatment of parallel transport along the coordinate X. Thus,<br />
each point in the RCS st<strong>and</strong>s for a flux tube segment of length<br />
Lo, <strong>and</strong> a complete flux tube is described by a sequence of points<br />
V
240 ALEXANDER et al.<br />
aUJ<br />
h-<br />
»t<br />
_j<br />
-1<br />
IK<br />
<br />
yf<br />
<br />
C<br />
(9<br />
^><br />
M<br />
C<br />
o<br />
(.<br />
IT<br />
ms<br />
•nee<br />
(us<br />
<strong>IAEA</strong>-CN-47/A-IV-S 241<br />
In the FiCS wich are found by means of the rotational transformation<br />
corresponding to
242<br />
. 00<br />
en<br />
o -jt<br />
. en<br />
in<br />
en<br />
o<br />
1<br />
/<br />
1<br />
/<br />
/<br />
/<br />
y*<br />
i i—.—i—<br />
ALEXANDER et al.<br />
e- UJ'U<br />
/<br />
i . .
in<br />
CD<br />
CM<br />
II<br />
O"<br />
Q<br />
JUl<br />
KSED<br />
LU<br />
LU<br />
_ C<br />
1-<br />
X<br />
(0<br />
E<br />
c<br />
0<br />
X - <<br />
244 ALEXANDER et al.<br />
The high degree of non-uniformity of the SOL exhibited by the<br />
density map in Fig.3 has been confirmed by a Langmuir probe experiment<br />
on T-10 (different probe positions by field inversion).<br />
The only adjustable parameter in the calculation is %.o. The value<br />
that proved appropriate (4.5 nm) corresponds to £r = 0.2 m z /s for<br />
T= 8.5 eV, which just equals the Bohm coefficient (Bt = 2.5 T).<br />
In earlier reports [6,7] on thermographic measurements on<br />
T-10 rail limiters we have pointed out the existence of a shift<br />
between the temperature peaks on both sides of the limiter. This<br />
phenomenon has now been studied systematically by evaluating the<br />
temperature profiles along straight lines parallel to the ridge<br />
of the span-roof-like limiter surface [7] on both the electron<br />
<strong>and</strong> ion drift sides. In the minor cross-section these lines are<br />
horizontal chords whose distance from the limiter edge is called<br />
"depth". Fig.4 shows an example (a) compared with the theoretical<br />
prediction (b). Although both data are intrinsically inconmensurate,<br />
the similarity is striking (a smaller value of Ao has been<br />
used to simulate the influence of temperature decay). There is an<br />
obvious mutual mirror symmetry of the asymmetric peaks.<br />
In a uniform exponential-decay SOL the profiles in question<br />
should read 4T(z) oc exp[-(z-zo) /2aA]. We have used this expression<br />
complemented v/ith a third-order asymmetry term to fit the<br />
experimental profiles as v/ell as the theoretical ones, mainly to<br />
obtain a unique measure of the shift: the difference of zo values<br />
for both of the limiter sides. Fig.4c,d shows an example together<br />
v/ith the corresponding density map (e). The entire set of data<br />
examined (q(a) between 2 <strong>and</strong> 3.3) has shown that the theory in<br />
any case yields the correct sign of the shift for a small depth<br />
(always positive for normal field direction <strong>and</strong> vice versa) <strong>and</strong>,<br />
thus, also accounts for previous results of a post-mortem investigation<br />
of a T-10 rail limiter [11] which has shown the same<br />
e-i-side shift of limiter load by ablation <strong>and</strong> cracks.<br />
It can be concluded that the phenomenon of asymmetry in question<br />
is actually due to the kind of SOL structure our model<br />
accounts for. Remaining discrepancies can clearly be attributed<br />
to the experimental uncertainty of q(a) on the one h<strong>and</strong> <strong>and</strong> the<br />
shortcomings of the model on the other h<strong>and</strong>: (i) A complete twofluid<br />
theory in terms of n, U, T'L, Te is needed, (ii) True toroidal<br />
geometry must be used, (iii) Cross-field motions (eg, ExB)<br />
nust be considered, (iv) The effect of loop voltage should be<br />
included. None of these requirements is too difficult to meet.<br />
3. Toroidally localized neutral particle distributions<br />
The limiter as the main sink for the plasma efflux is at the<br />
same time the main source of neutrals by recycling. This leads to<br />
strong inhomogeneities in the spatial distribution of neutrals<br />
both in the plasma column <strong>and</strong> in the SOL. Taking into account the<br />
actual geometry of T-10, we have simulated the neutral particle<br />
transport in the vicinity of the poloidal aperture limiter by a<br />
Monte-Carlo procedure. Since a large percentage of neutral atoms
<strong>IAEA</strong>-CN-47/A-IV-5 245<br />
F/G. 5. Neutral particle density in T-10. (a) Calculated radial distributions at position of poloidal<br />
aperture limiter. Na: limiter produced atoms (dashed line: analytical solution); n m : molecules from gas<br />
puff; N: molecules from gas puff; N: atoms produced by dissociation of gas molecules,<br />
(b) Experimentally determined radial distribution of atoms. N D : from Dp radiation in limiter section<br />
(N: calculated for limiter produced neutrals). N": from charge exchange spectra 90° away from<br />
limiter section, (c) Experimental temperature <strong>and</strong> density profiles typical for T-10 Ohmic discharges,<br />
(d) Calculated contributions to radial ion energy efflux due to twice the neoclassical ion heat conduction<br />
(PJ <strong>and</strong> charge exchange neutrals (PcJ, which sum up to total flux corresponding to net energy input<br />
in ion component (Pei).<br />
leaving the limiter are backscattered neutralized ions, the penetration<br />
depth of these neutrals into the plasma core is considerably<br />
larger than it is in the case of neutrals originating from<br />
cold gas molecules desorbed from the wall or puffed into the<br />
chamber. Results for both cases ("fast" neutral atom source <strong>and</strong><br />
"slow" molecular source normalized to the sane global particle<br />
flux), referring to one of the st<strong>and</strong>ard regimes of T-10 [9], are<br />
given in Fig.5a. The Monte-Carlo calculations were used to fit<br />
neutral density profiles obtained with the one-dimensional model<br />
of consecutive generations [12] by varying the energy of the<br />
primary neutrals. An energy of 20 eV gives a good overall fit to<br />
the Monte-Carlo profile for limiter-produced neutral atoms. This<br />
profile is confirmed by comparison with experimental data for the<br />
lirniter section (Fig.5b), while the low values ireasured far from<br />
the latter are in keeping with the calculated density peak at the<br />
limiter to decay steeply in toroidal direction.<br />
4. Ion heat transport by charge-exchange with neutrals<br />
An important effect, ordinarily not considered in energy<br />
transport calculations, is the additional heat conduction caused<br />
by the charge-exchange interaction of neutral atoms with plasma<br />
ions. This process can contribute substantially to the ion heat<br />
transport in the outer region of the plasma column, considering<br />
the enhanced penetration depth of fast primary neutrals coming<br />
from the limiter via recycling. A thorough investigation of ion<br />
temperature measurements in the presence of kinetic convective
246 ALEXANDER et al.<br />
ripple transport of ions [13] revealed that the ion temperature<br />
profiles in T-10 have a more pronounced peak than thought before.<br />
The ion heat conductivity derived from these profiles deviates<br />
strongly from the neoclassical scaling for r > 0.7O. . This behaviour<br />
can be attributed to the additional heat conduction by<br />
neutral atoms.<br />
The plasma energy balance has been calculated for the experimental<br />
data in Fig.5c. Assuming neoclassical ion heat conductivity<br />
multiplied by Kan = 2 <strong>and</strong> including the heat transport by<br />
neutral atoms based on the above-mentioned Monte-Carlo calculations,<br />
one obtains the curves in Pig.5d which shows that the<br />
apparent high anomality of the ion heat conductivity for r > a/2<br />
is actually heat conduction by neutrals.<br />
REFERENCES<br />
[1] VERSHKOV, V.A., GRASHIN, S.A., CHANKIN, A.V., in Plasma-Surface Interactions in<br />
Controlled Fusion Devices (Proc. 7th Int. Conf. Princeton, NJ, 1986), Report 7.5 (in press).<br />
[2] SAMM, U., et al., ibid., Report 1.6 (in press).<br />
[3] WAN, A.S., et al., ibid., Report 1.3 (in press).<br />
[4] IGITKHANOV, Yu.L., et al., Dokl. Akad. Nauk SSSR 278 (1984) 338.<br />
[5] KUKUSHKIN, A.S., PIGAROV, A.Yu., USSR Contribution to the INTOR Phase-Two-A<br />
Workshop, Group A, p. 20.<br />
[6] LINGERTAT, J., et al., in Plasma Physics <strong>and</strong> Controlled <strong>Nuclear</strong> Fusion Research 1984 (Proc.<br />
10th Int. Conf. London, 1984), Vol. 1, <strong>IAEA</strong>, Vienna (1985) 265.<br />
[7] GUNTHER, K., et al., in Controlled Fusion <strong>and</strong> Plasma Physics (Proc. 12th Europ. Conf.<br />
Budapest, 1985), Vol. 2, European Physical Society (1985) 567.<br />
[8] BOGEN, P., et al., ibid., p. 527.<br />
[9] ALIKAEV, V.V., et al., ibid., p. 160.<br />
[10] LINGERTAT, J., et al., ibid, p. 559.<br />
[11] HILDEBRANDT, D., et al., in Controlled Fusion <strong>and</strong> Plasma Physics (Proc. 10th Europ. Conf.<br />
Moscow, 1981), Vol. 1, European Physical Society (1981) J-12.<br />
[12] DNESTROVSKY, Yu.N., KOSTOMAROV, D.P., Numerical Simulation of Plasmas, Springer-<br />
Verlag, Berlin, Heidelberg (1986).<br />
[13] BEREZOVSKIJ, EX., et al., Nucl. Fusion 23 (1983) 1575.<br />
DISCUSSION<br />
H. WOBIG: The limiter introduces inhomogeneities not only into the density<br />
but also into the electric potential. This may lead to additional convective motion in<br />
the vicinity of the limiter. Did you take into account this effect?<br />
K.F. ALEXANDER: No, we did not take this effect into account in the present<br />
work, but we will do this in future. In the experiments with the scoop limiter, differences<br />
in the floating potential of several volts between the electron <strong>and</strong> ion drift sides<br />
were observed.
<strong>IAEA</strong>-CN-47/A-IV-5 247<br />
R.J. GOLDSTON: In your model of the scrape-off plasma you don't seem to<br />
need asymmetric sources to explain an asymmetric scrape-off plasma. In some auxiliary<br />
heating experiments, asymmetries have been attributed to the physical loss<br />
mechanisms. Could you perhaps comment on this <strong>and</strong> tell us what has been observed<br />
during ECH on T-10?<br />
K.F. ALEXANDER: Our model assumes a poloidally <strong>and</strong> toroidally<br />
homogeneous plasma source feeding the scrape-off layers. The asymmetries<br />
produced by the rail limiter discussed here are only due to the topology of open field<br />
lines of different connection lengths within the scrape-off layers.<br />
During ECH, additional asymmetries are certainly observed, for instance in<br />
limiter thermography. I would refer you in this connection to the paper by<br />
J. Lingertat which he presented at the 1984 Conference 1 .<br />
1 LINGERTAT, J., et al., in Plasma Physics <strong>and</strong> Controlled <strong>Nuclear</strong> Fusion Research 1984<br />
(Proc. 10th Int. Conf. London, 1984), Vol. 1, <strong>IAEA</strong>, Vienna (1985) 265.
ALT-I PUMP LIMITER BEHAVIOUR<br />
AND EDGE PLASMA FLOWS<br />
DURING BIASING AND ICRF HEATING<br />
IN THE TEXTOR TOKAMAK<br />
R.W. CONN, D.M. GOEBEL, W.K. LEUNG, G.A. CAMPBELL,<br />
B. LaBOMBARD, A.K. PRINJA<br />
Center for Plasma Physics <strong>and</strong> Fusion Engineering,<br />
University of California 1 ,<br />
Los Angeles, California, United States of America<br />
W.L. HSU, G.J. THOMAS<br />
S<strong>and</strong>ia National Laboratories 2 ,<br />
Livermore, California, United States of America<br />
<strong>IAEA</strong>-CN-47/A-IV-6<br />
K.H. DIPPEL, K.H. FINKEN, R. REITER, G.H. WOLF, H.L. BAY,<br />
G. BERTSCHINGER, W. BIEGER, P. BOGEN, W. BRUSSAU, Y. CAO,<br />
H.G. ESSER, G. FUCHS, B. GIESEN, E. GRAFFMANN, H. HARTWIG,<br />
E. HINTZ, F. HOENEN, K. HOTHKER, A. KALECK, H. KEVER, L. KONEN,<br />
M. KORTEN, L. LI, Y.T. LIE, A. POSPIESZCZYK, A. ROGISTER, G. ROSS,<br />
D. RUSBULDT, U. SAMM, J. SCHLUTER, B. SCHWEER, H. SOLTWISCH,<br />
F. WAELBROECK, G. WAIDMANN, P. WIENHOLD, J. WINTER,<br />
R. YAMAUCHI<br />
Euratom-KFA Association,<br />
Institut fur Plasmaphysik,<br />
Kernforschungsanlage Jiilich GmbH,<br />
Jiilich, Federal Republic of Germany<br />
T. DELVIGNE, P. DESCAMPS, F. DURODIE, M. JADOUL, R. KOCH,<br />
D. LEBEAU, A.M. MESSIAEN, D.I.C. PEARSON, P.E. VANDENPLAS,<br />
R. VAN NIEUWENHOVE, G. VAN OOST, G. VAN WASSENHOVE,<br />
R.R. WEYNANTS<br />
Laboratoire de physique des plasmas —<br />
Laboratorium voor Plasmafysica,<br />
Association Euratom-Etat Beige —<br />
Associatie Euratom-Belgische Staat,<br />
Ecole royale militaire — Koninklijke Militaire School,<br />
Brussels, Belgium<br />
1<br />
Work supported by the United States Department of Energy, under Contract<br />
No. DE-RG03-85-ER51069.<br />
2<br />
Work supported by the United States Department of Energy, under Contract<br />
No. DE-AC04-76DP00789.<br />
249
250 CONN et al.<br />
Abstract<br />
ALT-I PUMP LIMITER BEHAVIOUR AND EDGE PLASMA FLOWS DURING BIASING AND<br />
ICRF HEATING IN THE TEXTOR TOKAMAK.<br />
Experiments have been performed in the TEXTOR tokamak, using the ALT-I pump limiter with<br />
strong electrical biasing <strong>and</strong> ICRF heating. With negative biasing (up to -450 V) of ALT-I, the flux<br />
to ALT-I increases moderately (about 10%) at the front face of the limiter but very significantly (up<br />
to 250%) in the throat. The pressure <strong>and</strong> removal rate increase by a factor of two or more. Simultaneously,<br />
total Do light from the surface of other recessed limiters <strong>and</strong> the liner decreases by a factor of<br />
up to two. Some shots show no change in the loop voltage signal, while others show an increase. With<br />
positive bias (up to +450 V), generally opposite effects occur. The flux <strong>and</strong> pressure at ALT-I decrease,<br />
while Do light at the liner increases by a factor of two. The O VI signal likewise jumps <strong>and</strong> the loop<br />
voltage increases by 80% in 0.5 s. The net current drawn to the power supply ends at 120 A for negative<br />
bias <strong>and</strong> about 220 A for positive bias. With up to 1.6 MW of ICRF heating, negative biasing of ALT-I<br />
causes a decrease in recycling at the antenna. However, no change in plasma energy confinement scaling<br />
using ALT-I relative to previously reported results was found in a systematic study.<br />
1. INTRODUCTION<br />
Core plasma density control <strong>and</strong> heat removal are primary<br />
reasons for investigating pump limlters [1-3] in fusion<br />
devices. As part of the ALT-I program [4] in the TEXTOR<br />
tokamak [5,6], pump limiters of several designs <strong>and</strong> materials<br />
have been used in experiments to explore the physics of plasma<br />
exhaust [7-10], impurity <strong>and</strong> helium flows [10], the nature of<br />
the plasma edge [11], the performance of different limiter<br />
materials [12,13], <strong>and</strong> pump limiter operation during ICRF<br />
heating [14].<br />
In this paper, we report experiments in which the ALT-I<br />
pump limiter is electrically biased both positively (to +450V)<br />
<strong>and</strong> negatively (to -450V) with respect to the other limiters<br />
<strong>and</strong> the liner. Early work on the role of DC radial electric<br />
fields in plasma transport was reported by Taylor et al. [15]<br />
<strong>and</strong> recent experiments using limiter biasing were performed in<br />
the PDX [16] <strong>and</strong> TEXT [17] tokamaks. The experiments in TEXTOR<br />
were performed during ohmic <strong>and</strong> ICRF heated (up to 1.6MW)<br />
discharges. General ICRF heating studies in TEXTOR are<br />
reported in references [18] <strong>and</strong> [19], We describe here studies<br />
of ICRF heating with ALT-I operated as a pump liraiter or, with<br />
its exhaust channels closed, as a regular limiter. Limiter<br />
biasing during ICRF heating will also be discussed.<br />
2. LIMITER BIASING EXPERIMENTS<br />
2.1. EXPERIMENTAL ARRANGEMENT AND DIAGNOSTICS<br />
The general TEXTOR experimental arrangement <strong>and</strong><br />
diagnostics are described in references [5f 6], The ALT-I
IRdet.<br />
TMP<br />
<strong>IAEA</strong>-CN-47/A-IV-6 251<br />
QUAD.<br />
MASS. SPECT.<br />
CRYOPUMPS (3)<br />
7000 l/s<br />
FIG. 1. ALT-I pump limiter, showing position of Langmuir probes, Da viewing positions, the pumping<br />
chamber, <strong>and</strong> position of pressure measurements.<br />
llmlter has the design first reported In ref. [4] <strong>and</strong> is made<br />
of a carbon-carbon composite weave. The design <strong>and</strong> location of<br />
various diagnostics are given in Fig. 1. For the experiments<br />
reported here, ALT-I limits the plasma to a radius of 42 cm.<br />
Approximately 90° toroidally from ALT-I are three main limiter<br />
segments made of carbon, each subtending approximately 30°<br />
pololdally <strong>and</strong> located top, bottom <strong>and</strong> midplane outside. They<br />
are retracted to a minor radius of 48 cm, i..e. 6 cm radially<br />
beyond ALT-I. The ICRP antennas are two half-turn loops located<br />
40° toroidally from ALT-I in the opposite direction of the main<br />
limiters. The protective carbon limiters of the antennas form a<br />
full poloidal ring beginning at 48.8 cm. The liner is at 55 cm<br />
<strong>and</strong> the tokamak is generally conditioned by carbonization<br />
[20]. Experiments were also performed with ALT-I at other<br />
radial locations, but we restrict the discussion here to the<br />
geometrical arrangement just described.<br />
Key diagnostics which will be referred to in the paper<br />
include D - monitors viewing the liner, the ICRF ring Hmiters,<br />
<strong>and</strong> the upper main limiter. In addition, D - emission is<br />
monitored at the face of the ALT-I head <strong>and</strong> at the deflector
252 CONN et al.<br />
X<br />
A •<br />
2<br />
0.8-<br />
0.4"<br />
ALT-I NEGATIVE BIAS (-450V)<br />
/<br />
f<br />
0<br />
BIAS<br />
^\ J V - - 2*f<br />
I<br />
BIAS<br />
TIME(s)<br />
23707<br />
23707<br />
(a)<br />
(c)<br />
A •<br />
2 •<br />
0.8-<br />
0.4 -<br />
ALT-I POSITIVE BIAS (450V)<br />
FIG. 2. Core plasma density, pressure in the pump limiter <strong>and</strong> flux into the pump limiter throat, as<br />
a function of time. Negative or positive bias to ALT-I is applied from 1 s to 1.5 s. The dashed curve<br />
indicates signal values without bias.
10<br />
2<br />
1 .<br />
ALT-I NE.OATIVE BIAS (-4S0V)<br />
A i<br />
" BIAS<br />
<strong>IAEA</strong>-CN-47/A-IV-6 253<br />
23707 <br />
23707<br />
D-ALPHA<br />
THROAT<br />
OF ALT<br />
23707<br />
D-ALPHA<br />
MAIN<br />
LIMITER<br />
(c)<br />
A.U.<br />
• 2<br />
E><br />
3<br />
ALT-I POSITIYE BIAS (450V)<br />
BIAS<br />
(f)<br />
23693<br />
D-ALPHA<br />
THROAT<br />
OF ALT<br />
23693 (g)<br />
D-ALPHA<br />
MAIN<br />
LIMITER<br />
FIG. 3. Da signals viewing various locations in ALT-I, at the main limiters, <strong>and</strong> at the liner, as a<br />
Junction of time. Bias is applied from 1 s to 1.5 s. The dashed lines indicate the signal values without<br />
bias.
254<br />
2<br />
o<br />
I 1<br />
o<br />
— 3 •<br />
<<br />
> 2^<br />
o<br />
<<br />
1.<br />
160<br />
ALT-I NEGATIVE BIAS (-450V)<br />
BIAS<br />
23707<br />
23707<br />
CONN et al.<br />
(a)<br />
(b)<br />
23707 (c)<br />
2<br />
1<br />
4<br />
3<br />
2<br />
4<br />
1<br />
2<br />
a,LT-l POSITIVE BIAS (450V)<br />
I.<br />
H»WT-" —*•<br />
BIAS<br />
BIAS<br />
b<br />
^ BIAS<br />
1<br />
23693 (e)<br />
23693 (f)<br />
23693 (g)<br />
F/G. 4. Loop voltage, O VI <strong>and</strong> C V signals, <strong>and</strong> energy confinement time as a function of time.<br />
Bias is applied from 1 s to 1.5 s. The dashed lines indicate signal values without bias.
<strong>IAEA</strong>-CN-47/A-IV-6 255<br />
plate where plasma terminates inside the pump limlter. Plasma<br />
fluxes are measured with Langmuir probes <strong>and</strong> the neutral<br />
pressure is measured in the pump limlter chamber.<br />
2.2, RESULTS FOR OHMIC DISCHARGES<br />
Key results from various diagnostics are summarized in<br />
Figs 2, 3 <strong>and</strong> 4, where signals are plotted versus time during<br />
a discharge. Generally, the gas puff is on until 0.8 s, the<br />
bias is applied from I s to 1.5 s, the plasma current is<br />
constant from 0.5 s to 1.6 s, <strong>and</strong> the discharge generally<br />
terminates in a "soft l<strong>and</strong>ing" at 3.0 to 3.5 s [5,6].<br />
Fig. 2 shows that the central line-averaged density<br />
increases at bias turn-on for both positive <strong>and</strong> negative<br />
bias. The relative increase is largest with positive bias <strong>and</strong><br />
in each case the increase appears to be due to impurity<br />
introducton. (See Fig. 4, to be discussed shortly.) For<br />
negative bias, the flux into the throat of the pump liralter<br />
increases sharply at bias turn-on <strong>and</strong> both the pressure signal<br />
<strong>and</strong> the plasma removal rate in the pump limiter increase by 50<br />
to 100%. (See Fig. 2.) By contrast, we see from Fig. 3 that<br />
the D - signals at the other llmiters <strong>and</strong> particularly at the<br />
liner decrease. The D - signal at the front face of ALT-I<br />
increases, but by a smaller amount than the signals in the<br />
throat. The increase in the CV signal shown in Fig. 4 appears<br />
to be due to carbon from the limiter <strong>and</strong> correlates with the<br />
density rise.<br />
These results indicate that during negative biasing, ion<br />
flow is preferentially to ALT-I <strong>and</strong>, in particular, into the<br />
throat. A measurement by Pospleszczyk <strong>and</strong> Ross [21] of the<br />
density profile in the plasma boundary layer, taken at 1.4 s<br />
into the discharge <strong>and</strong> while bias is on, is shown in Fig. 5.<br />
During negative bias, a density bump occurs between 45 <strong>and</strong> 48<br />
cm, suggesting that cross-field transport is inhibited as the<br />
plasma approaches the main limlters (48 cm). The main liraiters<br />
are the first objects radially beyond ALT-I <strong>and</strong> are positive<br />
relative to it. The impedance to cross-field flow appears to<br />
be related to a radial potential barrier.<br />
Generally, opposite effects occur during positive bias.<br />
Following turn-on of positive bias, decreases are observed in<br />
the Dfl- signals at the ALT-I face <strong>and</strong> at the deflector plate.<br />
No bump in the boundary layer density occurs (see Fig. 5) <strong>and</strong><br />
the density in front of the main limiter at 48 cm is somewhat<br />
lower than with no bias. The D - signals at the other limiters<br />
do not change much, but four of the five D - monitors at the<br />
liner show increases of a factor of 2 or more. We do find that<br />
the liner D - signals strongly depend on toroidal location.<br />
Some signal changes are illustrated in Fig. 6, where A (signal)<br />
corresponds to the signal value just after bias minus the value<br />
just prior to bias, normalized to the value just before bias.
256<br />
o<br />
><br />
tn<br />
a<br />
CONN et al.<br />
44 48<br />
RADIUS (cm)<br />
FIG. 5. Edge plasma density profile at 1.4 s into discharges, with positive bias, negative bias or<br />
no bias applied to ALT-I. The radial position of ALT-I <strong>and</strong> the main limiters are shown.<br />
The increased flux to the liner is correlated with a<br />
prompt increase in the OVI <strong>and</strong> CV signals in the plasma edge,<br />
indicating that there is a flux-induced release of oxygen <strong>and</strong><br />
carbon. The loop voltage shown in Fig. 4 increases linearly<br />
over the 0.5 s positive bias time, suggesting impurity<br />
accumulation. The value of global energy confinement,<br />
T , correspondingly decreases, apparently due to increased<br />
levels of low Z radiation. For negative bias, the oxygen<br />
signal increases slightly, but the loop voltage <strong>and</strong> confinement<br />
time show little change. We deduce that the source of oxygen<br />
impurity is desorption from the liner, not from ALT-I. During<br />
negative bias, the source of carbon must be ALT-I.<br />
The I-V trace of current <strong>and</strong> voltage at the bias power<br />
supply, shown in Fig. 6, indicates that the current limits to a<br />
net value of 110A for strong negative bias <strong>and</strong> about 220A for<br />
strong positive bias. The floating potential is 50-90V<br />
relative to the wall. The 110-120A current level during<br />
negative bias is within a factor of 2 to 3 of the estimated ion<br />
current diffusing from the core plasma for this particluar<br />
arrangement of liraiters. This estimate assumes T is 0.1s,<br />
consistent with results reported earlier [22].<br />
A possible picture to explain the edge plasma flows during<br />
biasing is to view the plasma potential as following the<br />
potential applied to ALT. (This is similar to the observation<br />
reported by Taylor et al. [15].) The system then effectively<br />
acts as a double probe of unequal areas, with ALT-I as one<br />
electrode <strong>and</strong> the liner as the other. The net current in the<br />
power supply circuit is determined by the plasma potential in<br />
the scrape-off layer plasma relative to the two electrodes.<br />
52
(a)<br />
600 -400 -200<br />
V——^<br />
(d)<br />
-400<br />
-400 -400 - p<br />
(e)<br />
• •<br />
-200<br />
-600 .-400 • -20^<br />
• • '<br />
1AEA-CN-47/A-IV-6 257<br />
200<br />
100<br />
-100<br />
-0.2 "<br />
-0.4 •<br />
0.8<br />
•<br />
0.4<br />
•<br />
-0.4<br />
1.2<br />
0.8<br />
0.4<br />
•BIAS<br />
•CURRENT (A) •<br />
•<br />
200<br />
200<br />
A (SIGNALVSIGNAL<br />
ALT HEAD<br />
D-ALPHA<br />
• A (SIGNAL)/SIGNAL<br />
ALT THROAT<br />
D-ALPHA<br />
' A(SIGNAL)/SIGNAL<br />
•D-ALPHA<br />
-MAINLIMITER<br />
200<br />
' L (SIGNALVSIGNAL<br />
D-ALPHA<br />
•UNER<br />
200<br />
•<br />
•<br />
•<br />
BIAS<br />
VOLTAGE (V)<br />
400 600<br />
BIAS<br />
VOLTAGE (V)<br />
400 600<br />
BIAS<br />
VOLTAGE (V)<br />
•400 600<br />
. 1<br />
BIAS<br />
VOLTAGE (V)<br />
400 600<br />
FIG. 6. (a) Current through the power supply versus bias voltage applied to ALT-I.<br />
(b, c, d, e) Relative changes in Da signals at various locations. A(signal)/signal is the value just<br />
after turn-on of bias, minus the value just prior to bias, normalized to the value before bias.
258 CONN et al.<br />
During negative bias of ALT, the plasma potential decreases<br />
relative to the wall, creating a potential barrier between the<br />
plasma edge <strong>and</strong> the main limiters at 48 cm <strong>and</strong> the liner at 55<br />
cm. The density bump reported in Fig. 5, <strong>and</strong> the decrease in<br />
the D - signals at the other liraiters <strong>and</strong> liner are consistent<br />
with this potential barrier. For positive bias, the plasma<br />
potential increases relative to the wall, but is now below the<br />
ALT potential. The 220A of current in the circuit is<br />
determined by the amount of current that flows across the<br />
magnetic field in the edge <strong>and</strong> reaches the main limiters <strong>and</strong><br />
liner, <strong>and</strong> not by the r<strong>and</strong>om electron flux in the edge near<br />
ALT. Overall, we conclude that plasma flows in the boundary<br />
are significantly modified by plasma potential changes, without<br />
requiring excessive currents in the power supply. In general,<br />
limiter biasing is a specific technique to alter wall recycling<br />
in tokamaks <strong>and</strong> a means to alter the plasma flux to various<br />
limiters <strong>and</strong> the liner.<br />
3. PUMP LIMITER AND ICRF HEATING<br />
First results on ALT-I behavior during ion cyclotron<br />
resonance heating (ICRF) [18,19] were reported earlier [14],<br />
Here, we report a systematic comparison of ICRF heating using<br />
ALT-I as a pump limiter (PL mode) or, with its throat closed,<br />
as a regular limiter (RL-mode). Particular emphasis is given<br />
to the influence, if any, of pump limiter operation on core<br />
energy confinement time <strong>and</strong> of negative limiter biasing.<br />
The analysis of energy confinement time is that of<br />
Messiaen et al. [18], in which the global energy confinement<br />
time, T_, is determined from<br />
E<br />
E dia<br />
where E^j^ is the plasma energy determined from the diamagnetic<br />
loop signal, PQH is the ohmic heating power during the ICRF<br />
heating, <strong>and</strong> P^p is the RF power radiated into the tokamak<br />
vessel. A reasonable estimate of the RF power coupled to the<br />
plasma is 85% of the RF power delivered by the generator.<br />
Results are given in Fig. 7, where T is plotted versus the<br />
total heating power, PQ1j + P ICRH» evaluated during a typical<br />
0.5 second RF heating pulse. The open circles are values of<br />
TF for ALT-I in the PL-mode, while solid circles denote T for<br />
RE-mode operation. No systematic difference is found. This is<br />
so, even though operation in the PL-mode reduces the degree of<br />
core density rise which normally accompanies the ICRH pulse.<br />
Though not shown here, T-u follows an Alcator-like scaling with
100<br />
80<br />
60<br />
40 -<br />
20<br />
1 i '<br />
<strong>IAEA</strong>-CN-47/AIV-6 259<br />
\ \ \ \<br />
OHMIC POWER<br />
w/o RF<br />
. 1, .<br />
\<br />
1<br />
ALT-MODE<br />
PUMP LIMITER<br />
o<br />
A REGULAR LIMITER<br />
n<br />
i<br />
0.0 0.4 0.8 1.2 1.6 2.0<br />
PT0T(MW)<br />
FIG. 7, Global energy confinement time as a Junction of total input power, determined midway through<br />
an ICRF power pulse. Open circles are for ALT-I as a pump limiter <strong>and</strong> triangles are for ALT-I as a<br />
regular limiter (with its throat closed).<br />
density. No difference in !-„ scaling is found when operating<br />
ALT-I in either the PL- or RE-modes.<br />
RE-m<br />
Negative limiter biasing during ICRH heating is found to<br />
reduce the recycling plasma flux at the RF antenna <strong>and</strong>,<br />
operationally, fewer breakdown/interruptions in the antennas are<br />
observed. Nevertheless, no differences in global T_, are found<br />
during ICRF heating <strong>and</strong> limiter biasing.<br />
4. CONCLUSIONS<br />
Plasma edge flows can be strongly affected by limiter<br />
biasing. Plasma exhaust is increased (by a factor of 2 in this<br />
work) during negative bias, while flows to the liner, other<br />
liraiters <strong>and</strong> the RF antennas generally decrease. No strong<br />
change in energy confinement is observed. The strong exhaust<br />
increase follows from a bump in the edge density profile which<br />
may be due to a radial potential barrier. Positive bias<br />
increases flow to the walls, decreases flow to the pump<br />
limiter, decreases plasma exhaust, <strong>and</strong> appears to induce<br />
impurity accumulation. No bump is found in the edge radial<br />
density profile.<br />
-<br />
-
260 CONN et al.<br />
During ICRK heating, negative biasing of ALT-I causes a<br />
decrease in recycling at the RF antenna <strong>and</strong> results in fewer<br />
antenna breakdowns/Interruptions. However, no change in core<br />
plasma confinement is observed, relative to earlier results<br />
[18,19], when using ALT-I as a regular or a pump limiter.<br />
ACKNOWLEDGEMENT<br />
The authors gratefully acknowledge the help of the TEXTOR<br />
operations team <strong>and</strong> the support staff of UCLA, S<strong>and</strong>ia Labs <strong>and</strong><br />
the ERM, Brussels.<br />
REFERENCES<br />
[1] MIODUSZEWSKl, P.J., J. Nucl. Mater. 111&112 (1982) 253.<br />
[2] CONN, R.W., J. Nucl. Mater. 128&129 (1984) 407.<br />
[3] GOEBEL, D.M., Fusion Technol. 10 (1986) 761.<br />
[4] CONN, R.W., et al., in Fusion Technology 1982 (Proc. 12th Symp. Jiilich, 1982), Vol. 1,<br />
Pergamon Press, Oxford (1983) 497.<br />
[5] WAIDMANN, G., BAY, H.L., BERTSCHINGER, G., et al., in Plasma Physics <strong>and</strong> Controlled<br />
<strong>Nuclear</strong> Fusion Research 1984 (Proc. 10th Int. Conf. London, 1984), Vol. 1, <strong>IAEA</strong>, Vienna<br />
(1985) 193.<br />
[6] WOLF, G., et al., Plasma Phys. Controll. Fusion 28 (1986) 1413.<br />
[7] PONTAU, A.E., et al., J. Nucl. Mater. 128&129 (1984) 434.<br />
[8] CAMPBELL, G.A., et al., The Influence of Plasma-Neutral Interactions on the Behaviour of<br />
a Pump Limiter, Rep. PPG-958, Univ. of California, Los Angeles (1986).<br />
[9] FINKEN, K.H., et al., J. Nucl. Mater. 145&146 (1987).<br />
[10] DIPPEL, K.H., FINKEN, K.H., GUTHRIE, S.E., et al., in Plasma Physics <strong>and</strong> Controlled<br />
<strong>Nuclear</strong> Fusion Research 1984 (Proc. 10th Int. Conf. London, 1984), Vol. 1, <strong>IAEA</strong>, Vienna<br />
(1985)249.<br />
[11] GOEBEL, D.M., et al., Langmuir Probe Measurements in the TEXTOR Tokamak during ALT-I<br />
Pump Limiter Experiments, Rep. PPG-945, Univ. of California, Los Angeles (1986).<br />
[12] McGRATH, R.T., et al., J. Nucl. Mater. 145&146 (1987).<br />
[13] DOYLE, B.L., McGRATH, R.T., PONTAU, A.E., Nucl. Instrum. Methods Phys. Res.,<br />
Sect. B (1987).<br />
[14] LEUNG, K., et al., Rep. PPG-968, Univ. of California, Los Angeles (1986).<br />
[15] TAYLOR, R.J., JAMES, B.W., JIN, S.X., et al., in Plasma Physics <strong>and</strong> Controlled <strong>Nuclear</strong><br />
Fusion Research 1982 (Proc. 9th Int. Conf. Baltimore, 1982), Vol. 3, <strong>IAEA</strong>, Vienna (1983) 251.<br />
[16] SHIMADA, M., et al., Bull. Am. Phys. Soc. 30 (1985) 1439.<br />
[17] PHILLIPS, P.E., et al., J. Nucl. Mater. 145&146 (1987).<br />
[18] MESSIAEN, A., et al., Plasma Phys. Controll. Fusion 28 (1986) 71.<br />
[19] VANDENPLAS, P.E., DELVIGNE, T., DESCAMPS, P., et al., Paper <strong>IAEA</strong>-CN-47/F-I-4,<br />
these Proceedings, Vol. 1.<br />
[20] WINTER, J., J. Nucl. Mater. 145&146 (1987).<br />
[21] POSPIESZCZYK, A., ROSS, G., TEXTOR Group, private communication.<br />
[22] SAMM, U., et al., in Fusion Engineering (Proc. 11th Symp. Austin, TX, 1985), Vol. 1,<br />
IEEE-CAT. No. CH2251-7, IEEE, New York (1986) 66.
<strong>IAEA</strong>-CN-47/A-IV-6 261<br />
DISCUSSION<br />
R.J. HAWRYLUK: In your experiments, the confinement time in ICRF heated<br />
discharges was unaffected by the pump limiter. Did limiter biasing affect the confinement<br />
time?<br />
R.W. CONN: At present, we have no evidence of improved energy confinement<br />
using limiter biasing with ICRF heating. However, no systematic experiments<br />
on this point have yet been undertaken.<br />
A. GIBSON: On the basis of your results, would you care to offer a prognosis<br />
for the future of pump limiters?<br />
R.W. CONN: Pump limiters have been shown in earlier work to be effective<br />
in controlling plasma density <strong>and</strong> also to have efficient exhaust capability. The key<br />
issue ultimately will be to achieve improved confinement, such as is now possible<br />
with divertors. The results presented in this paper demonstrate that plasma edge flows<br />
are strongly influenced by limiter biasing. This can be combined with material conditioning<br />
<strong>and</strong> pump limiter exhaust capability to produce low recycling operation — a<br />
key to achieving better confinement. Also, we have heard at this Conference that such<br />
improved confinement (H-mode) with a limiter has been achieved on JFT-2M. Given<br />
the inherent simplicity <strong>and</strong> low cost of limiters, the future for pump limiters is<br />
reasonably bright.
CURRENT DENSITY PROFILES<br />
IN THE TEXTOR TOKAMAK<br />
H. SOLTWISCH 1 , W. STODIEK 2 ,<br />
J. MANICKAM 2 , J. SCHLUTER 1<br />
1 Euratom-KFA Association,<br />
Institut fur Plasmaphysik der<br />
Kernforschungsanlage Julich GmbH,<br />
Jiilich, Federal Republic of Germany<br />
2<br />
Princeton Plasma Physics Laboratory,<br />
Princeton University,<br />
Princeton, New Jersey,<br />
United States of America<br />
Abstract<br />
<strong>IAEA</strong>-CN-47/A-V-1<br />
CURRENT DENSITY PROFILES IN THE TEXTOR TOKAMAK.<br />
Current density <strong>and</strong> hence safety factor profiles have been measured by the Faraday rotation<br />
method in the TEXTOR tokamak. The profiles of sawtooth dominated discharges appear marginally<br />
stable for all modes <strong>and</strong> have stationary values of q on axis less than unity, in some conditions as low<br />
as 2/3. The profiles assume a roughly universal shape which is determined in the central region by the<br />
stability of the m = 1 tearing mode <strong>and</strong> in the outer region by the general heat transport <strong>and</strong> thermal<br />
stability of the plasma column.<br />
1. INTRODUCTION<br />
The tokamak magnetic structure for low |5 plasmas is determined<br />
by "external" parameters: magnetic axis major radius, toroidal<br />
magnetic field strength, total plasma current <strong>and</strong> an "internal"<br />
parameter: the poloidal field distribution, adjusted to<br />
fulfil macroscopically MHD (at least near) stable equilibrium.<br />
In general, the radial temperature profile is determined by<br />
balancing the ohmic heating with the plasma heat loss. The thermal<br />
instability will cause the current channel to shrink if the<br />
plasma edge is set by a "virtual" limiter. This shrinking process<br />
is hatted, leading to a stationary state, through clamping<br />
of the local current density by additional local tra/isport introduced<br />
by sawtooth activity near the plasma axis. The sawtooth<br />
activity is connected with instability of the m=l, n=l internal<br />
tearing mode, originating near the q=l radius.<br />
263
264 SOLTWISCH et al.<br />
Under steady state conditions with sawtooth activity the<br />
radius of the q=l surface <strong>and</strong> the current density profile (the<br />
"internal" tokamak parameter) are thus determined by the dependence<br />
of the stability of the m=l, n=l tearing mode on the current<br />
density profile.<br />
The experimental investigation of this relationship is the<br />
subject of this paper.<br />
The recent development on TEXTOR Tokamak of the Faraday rotation<br />
method for poloidal magnetic field measurements has<br />
enabled us to follow the evolution of the current density<br />
distribution <strong>and</strong> in particular to determine the quasi-stationary<br />
profiles, especially near the plasma axis, for various "external"<br />
tokamak parameters. A direct measurement of the current<br />
density in this area is preferable to, for instance, inference<br />
from plasma conductivity, because of the intricacies of the sawtooth<br />
activity.<br />
The TEXTOR tokamak plasmas considered are ohmically heated,<br />
circular with aspect ratio of 3.5-4, <strong>and</strong> have an effective charge<br />
of 1.5-3. The "external" parameters varied are toroidal field<br />
<strong>and</strong> total plasma current.<br />
Theoretically, tearing mode stability is determined by analyzing<br />
the observed profiles for m>l modes with a cylindrical<br />
tearing mode code, which is sufficient for this problem. The<br />
m=l, n=l mode, ideally unstable in cylindrical geometry,? requires<br />
toroidal analysis, which has been carried out with the<br />
Princeton resistive PEST code.<br />
The experimental results indicate that the plasma current<br />
density increases <strong>and</strong> the column radius decreases in time, until<br />
the q=l radius is well inside the plasma column. As a general<br />
trend, this has been derived from conductivity measurements with<br />
soft x-ray techniques permitting simultaneously the determination<br />
of electron temperature <strong>and</strong> Ze.ff profiles. A direct determination<br />
of greater accuracy was carried out with the Faraday<br />
rotation method. Under these conditions the value of q on axis<br />
is measured to be considerably less than unity.<br />
Such profiles have been found experimentally stable, that<br />
is, no modes of any m or sawtooth activity are observed. In many<br />
cases these profiles are hindered from further shrinkage by centrally<br />
located impurities. If the profile shrinks further (for<br />
instance by loss of impurities from the center), predominantly<br />
the m=l mode, with accompanying sawtooth activity, develops<br />
periodically, <strong>and</strong> now the sawtooth mechanism, on the average,<br />
becomes the controlling mechanism for the central conductivity.<br />
The exact theoretical criteria for the onset of the m=l instability,<br />
as function of the q-profile <strong>and</strong> aspect ratio,are not
<strong>IAEA</strong>-CN-47/A-V-1 265<br />
yet clear in detail. 9 Stability is favored by a plateau in the<br />
current density distribution, suggesting that, in toroidal geometry,<br />
stability can be obtained through nonlinear saturation<br />
<strong>and</strong> profile modification. This is supported by the observation<br />
that m=l, n=l modes exist with stationary, large amplitudes for<br />
hundreds of plasma rotation periods. For profiles with q=2.1<br />
at the limiter <strong>and</strong> q(0)=0.66, these plateaus could be resolved<br />
in our experiments, due to their dimensions relative to the apparatus.<br />
We find these profiles to be near marginal stability,<br />
using the PEST code, in agreement with the experiments.<br />
We observe that in stationary conditions in sawtoothing<br />
discharges, current density <strong>and</strong> q-profile assume a unique shape.<br />
This can he expressed in reduced coordinates (depending only on<br />
the "external" tokamak parameters R, By <strong>and</strong> I) as a result of<br />
the critical effect of the m=l tearing mode on transport:<br />
The universal profile is overall tearing mode marginally stable<br />
in the cylindrical approximation.<br />
Thus the profiles may be interpreted as fine-scale heat<br />
conduction profiles, intrinsically marginally stable to higher-m<br />
tearing modes, clamped only by the very critical m=l mode,<br />
through sawtooth activity, to the external tokamak parameters.<br />
With the q=l radius fixed, the total profile <strong>and</strong> thus the "internal"<br />
tokamak parameter is then determined.<br />
2. ACCURACY OF THE FARADAY ROTATION METHOD TO DETERMINE THE<br />
VALUE OF q AND j AT THE MAGNETIC AXIS<br />
To prove experimentally the stability of the m=l tearing<br />
mode, it is necessary to show that stability exists for q(0)<br />
considerably less than one. This requires sufficient spatial resolution<br />
of the polarimeter diagnostic inside the q=l radius to<br />
derive the value of q on axis by Abel inversion. For larger q=l<br />
radii this is possible in TEXTOR with the existing probing beam<br />
spacing of 10 cm. For plasmas with high q at the limiter <strong>and</strong> a<br />
small q=l radius, the effective number of probing beams can be<br />
increased by slowly moving the plasma relative to the beam<br />
system by about _+_ 1/3 beam distance. Even for small q=l radii we<br />
find generally agreement between the two methods. At present obtainable<br />
accuracies for q <strong>and</strong> j are given in Fig. 1 <strong>and</strong> are<br />
about _+_ 15% on axis. Thus, at this time the question of the stability<br />
of the m=l mode can be unambiguously decided only for cases<br />
of q-values considerably less than unity.
266<br />
SOLTWISCH et al.<br />
(%) (%) f/fV<br />
3-<br />
(6ep) xi<br />
\<br />
/<br />
. I<br />
)z --t<br />
location o<br />
probing be<br />
.S .<br />
(d)<br />
-<br />
•<br />
(<br />
(b)<br />
-<br />
Z_UID-V ) r<br />
\<br />
/<br />
/<br />
/<br />
s<br />
\<br />
\<br />
\<br />
^^\ \<br />
\v<br />
/<br />
V<br />
\<br />
so Cn ~* "i f** *~ o<br />
S<br />
O<br />
i<br />
f?l<br />
8.'<br />
•§<br />
1<br />
<br />
acy<br />
1<br />
<br />
u 1<br />
I<br />
.1<br />
K<br />
i<br />
i^<br />
beyond
s<br />
2-<br />
0-<br />
I<br />
J<br />
A<br />
(a)<br />
r /700 ms<br />
000 ms<br />
200 ms<br />
170<br />
\<br />
- • 200<br />
, \<br />
"A<br />
-^<br />
<strong>IAEA</strong>-CN-47/A-V-1 267<br />
\<br />
FIG. 2. (a) Electron density, (b) safety factor <strong>and</strong> (c-e) current density profiles at the end of current<br />
ramp-up (200 ms; / = 625 kA-s' 1 , I = 300 kA) <strong>and</strong> in quasi-stationary conditions (700 ms, 1000 ms;<br />
I = 335 kA, BT = 2 T). A non-destructive disruption occurring between 700 ms <strong>and</strong> 1000 ms changes<br />
the discharge characteristics from a non-sawtoothing plasma of relatively high metal content to a cleaner<br />
sawtoothing discharge. Safety factor <strong>and</strong> current density are plotted versus normalized flux surface<br />
radius r/a to allow a comparison with linear tearing mode stability theory in cylindrical geometry.<br />
Dashed curves represent computed stable profiles with A'-values as listed.<br />
3. DEVELOPMENT OF THE CURRENT PENSITY PROFILE IN TIME<br />
An example of the development of the current distribution<br />
profile in time is shown in Fig. 2 for nearly constant total<br />
plasma current. Under the influence of the thermal instability<br />
the distribution contracts until the stationary profile with q<br />
on axis of about 0.6 is reached. The values of the stability<br />
criteria A 1 of linear tearing mode theory in cylindrical approximation<br />
are given in the inserts for the individual modes, indi-
268<br />
_6<br />
j<br />
J 1<br />
r<br />
1<br />
\<br />
130<br />
i ?<br />
SOLTWISCH et al.<br />
(a) (c)<br />
4 5 6<br />
\<br />
7<br />
\<br />
• 22 =66<br />
150 190 210 Rlcml<br />
\<br />
\<br />
i<br />
770 t(ms)<br />
200<br />
100<br />
—-<br />
3 /4<br />
\<br />
m/n<br />
3/4<br />
2/2<br />
4/3<br />
Y3/2<br />
2/1<br />
\<br />
0.4<br />
(d)<br />
/<br />
/<br />
/<br />
- 8.49<br />
- 2.53<br />
-10.20<br />
-5.88<br />
-4.77<br />
_ 2/1.<br />
0.8 r,Q<br />
y<br />
0.4 0.8 r/Q<br />
FIG. 3. Quasi-stationary low-q discharge (I = 476 kA, BT = 1.7 T, q(a) = 2.33).<br />
(a) Electron density distribution, (b) Fluctuations of line-integrated electron densities along the chords<br />
indicated in frame (a) (ne in units of 6.6 x 10 14 cnf 2 ). (c) Current density distribution, (d) Safety factor<br />
profile presented as in Fig. 2.<br />
cated by the arrows (note that the m=l, n=l mode cannot be treated<br />
by this method). During the development in time the profiles<br />
always show small negative values of A 1 ,indicating marginal stability.<br />
It must be concluded that at the time of 700 msec the<br />
m=l mode is also stable because no m=l or sawtooth activity is<br />
observed,but the q=l radius is clearly at r/a = 0.3. This is accompanied<br />
by a peaked electron density profile indicated in frame<br />
a of Fig. 2. At 1000 msec the j-profile has further steepened,<br />
<strong>and</strong> sawtooth activity connected with the marginally unstable<br />
m=l mode occurs with the accompanied flattening of the<br />
electron density profile.
n-<br />
/<br />
/<br />
1<br />
1<br />
(a)<br />
2 1 ,<br />
5 6<br />
\<br />
7<br />
<strong>IAEA</strong>-CN-47/A-V-1 269<br />
\<br />
\<br />
• ISO<br />
130 150 170 R (cm)<br />
(c)<br />
/<br />
0.4 0.8,<br />
\<br />
(d)<br />
755<br />
600<br />
400<br />
•<br />
765<br />
(e)<br />
• soft X-ray<br />
d ita<br />
—1—1<br />
-><br />
\<br />
\<br />
t (msl<br />
0.4 0.8 r/a<br />
FIG. 4. Low-q discharge (1 = 485 kA, BT = 1.57 T, q(a) = 2.1) suddenly developing a large<br />
m = 1 mode after about 500 ms of stationary behaviour (frame (b) showing the fluctuations of lineintegrated<br />
electron densities at the chord positions indicated in frame (a)). Profiles about 25 ms before<br />
this event: (a) electron density, (c) safety factor, (d) current density, showing a pronounced shoulder<br />
at the q = 1 radius, <strong>and</strong> (e) electron temperature calculated from the j-prqfile using neoclassical<br />
resistivity with Ut = 1.50 V <strong>and</strong> Zeg = 2 (dots represent average temperatures in the time interval<br />
400-800 ms measured by soft X-ray pulse height analysis).<br />
4. PLASMAS WITH q AT LIMITER NEAR 2<br />
In Fig. 3, a current distribution with a limiter q-value<br />
near 2.3 is shown. The profile is maintained by the m=l instability-induced<br />
sawtooth activity. The m=l mode must be marginally<br />
stable. The A' values of the higher-m modes derived for the cylindrical<br />
model are all negative. In this case the q-value on<br />
axis is so low that even without the plasma shift method the<br />
accuracy is sufficient to definitely exclude a value of q(0)=l.<br />
A case with q at limiter of 2.1 is shown in Fig. 4. The<br />
current distribution is held stationary by the increased transport<br />
caused by sawtooth activity initiated by marginal instability<br />
of the m=l mode. The q=l radius has moved out to r/a ~ 0.5.<br />
\<br />
\
270<br />
SOLTWISCH et al.<br />
2.0 R(m)<br />
FIG. 5. Current density profile stable to the m = 1 resistive mode in toroidal geometry<br />
(a/R0 = 0.46/1.75, BT= 1.49 T) with a finite $p of 0.25 according to the Princeton PEST III code.<br />
Full line: experimental profile of Fig. 4, used to calculate the required input information q(*p); dashed<br />
line: stable profile after self-consistent equilibrium recalculation.<br />
The q(n) is about 0.6 +_ 15%. Frame e of Fig. 4 gives an indication<br />
of the electron temperature from soft X-ray measurements<br />
(dots). The solid curve represents the temperature profile derived<br />
from the current density profile using neoclassical electron<br />
conductivity.<br />
For this steep profile the nonlinear stability behaviour of<br />
the m=l mode is so strong that an actually measurable plateau<br />
occurs in the j-profile. The precarious stability situation is<br />
evident by the rapidly growing m=l mode (at 767 msec) which (in<br />
contrast to the small local m=l modes which may produce sawtooth<br />
activity without affecting the current distribution) produces,<br />
by total reconnection, a complete disruption of the plasma<br />
column.<br />
The current density profile of Fig. 4 has been analyzed<br />
with respect to tearing mode stability with the PEST code in<br />
toroidal geometry . Figure 5 shows the result. The solid curve<br />
is the experimental profile which was entered into the code as<br />
a q(i|i)-profi1e. The dotted line represents as a check the recomputed<br />
j-profile for the recalculated plasma equilibrium. The<br />
computed values of A 1 for the 1/1, 4/3, 3/2 modes are all<br />
slightly negative, indicating marginal stability including the<br />
1/1 mode. As expected, stability cannot be obtained in cylindrical<br />
geometry.** From the experimental results as well as from
<strong>IAEA</strong>-CN-47/A-V-1 271<br />
t<br />
2<br />
3<br />
4<br />
5<br />
6<br />
IlkAl B,ITI<br />
485<br />
473<br />
476<br />
340<br />
202<br />
191'<br />
1.S8<br />
1.70<br />
2.51<br />
1.70<br />
1.70<br />
2.00<br />
q(Q)<br />
2.10<br />
2.33<br />
3.30<br />
3.17<br />
5.46<br />
6.34<br />
= 1.75m; a = 0.4-6 IT<br />
FIG. 6. Superposition of normalized current density profiles measured in a variety of quasi-stationary<br />
sawtoothing Ohmic discharges (see insert). In reduced co-ordinates the profiles resemble roughly a<br />
universal profile.<br />
this first theoretical result we conclude that the m=l, n=l resistive<br />
mode can be linearly or at least nonlinearly stable in<br />
toroidal geometry. The dependence on geometry <strong>and</strong> other profile<br />
effects is under investigation. 11<br />
5. PROFILE SHAPE<br />
The experimental profiles show a dependence of the effective<br />
minor radius on the plasma current <strong>and</strong> current density on<br />
axis. With the current density clamped inside the q=l radius,<br />
the profile outside the q=l radius is also fairly well fixed by<br />
the restriction of the thermal transport. It is thus convenient<br />
to display the experimental profiles for various external tokamak<br />
parameters in appropriate coordinates. Figure 6 shows that<br />
they can roughly be represented by one profile. This effective<br />
minor radius dependence requires the effectiveness of the virtual<br />
or radiation limiter, which in the investigated cases was<br />
assured by the presence of a small amount of light impurities<br />
(carbon). Theoretically the situation around the q=l radius is<br />
still not completely clear, <strong>and</strong> thus the q=l radius cannot be<br />
determined precisely because the m=l stability criteria are not<br />
sufficiently well known to warrant numerical calculations.<br />
q(O)<br />
0.67<br />
0.74<br />
0.72<br />
0.78<br />
0.80<br />
0.88
272 SOLTWISCH et al.<br />
SUMMARY<br />
In stationary state plasmas with sawtooth activity, q(0) is<br />
found to be considerably below unity. In most cases, but not exclusively,<br />
sawtooth activity is not connected with complete reconnection,<br />
which would increase q(0) to near unity. Experimentally,<br />
the m=l, n=l tearing mode is intermittently stable or at<br />
least saturated at an undetectable level. Theoretical estimates<br />
with the PEST code confirm these results in the cases investigated.<br />
The effect of current density clamping near the axis results<br />
in a general shape of the stationary, sawtooth dominated,<br />
current distribution <strong>and</strong> determines the effective minor radius.<br />
ACKNOWLEDGEMENT<br />
This work was in part supported by U.S. DoE Contract No.<br />
DE-ACfl2-76-CHO-3O73.<br />
REFERENCES<br />
[1] BISHOP, A.S., HINNOV, E., in Plasma Physics <strong>and</strong> Controlled <strong>Nuclear</strong> Fusion Research (Proc.<br />
Conf. Culham, 1965), Vol. 2, <strong>IAEA</strong>, Vienna (1966) 673.<br />
GRISHAM, L.R., BOL, K., Nucl. Fusion 18 (1978) 315.<br />
YOSHIKAWA, S., CHANCE, M.S., Bull. Am. Phys. Soc. 31 (1986) 14.<br />
[2] FURTH, H.P., ROSENBLUTH, M.N., RUTHERFORD, P.H., STODIEK, W., Phys. Fluids<br />
13 (1970) 3020.<br />
[3] VON GOELER, S., STODIEK, W., SAUTHOFF, N.R., Phys. Rev. Lett. 33 (1974) 1201.<br />
[4] SOLTWISCH, H., Rev. Sci. Instrum. 57 8 (1986) 1939.<br />
[5] ALLADIO, F., MAZZITILLI, G., TUCILLO, A.A., VLAD, G., in Controlled Fusion <strong>and</strong><br />
Plasma Physics (Proc. 12th Europ. Conf. Budapest, 1985), Vol. 9F, Part I, European Physical<br />
Society (1985) 138.<br />
[6] LACKNER, K., private communication. (This code was provided by Dr. Karl Lackner,<br />
Max-Planck-Institut fur Plasmaphysik, Garching, <strong>and</strong> installed by A. Kaleck, Julich.)<br />
[7] FURTH, H.P., RUTHERFORD, P.H., SELBERG, H., Phys. Fluids 16 7 (1973) 1054.<br />
[8] GRIMM, R.C., DEWAR, R.L., MANICKAM, J., JARDIN, S.C., GLASSER, A.H.,<br />
CHANCE, M.S., in Plasma Physics <strong>and</strong> Controlled <strong>Nuclear</strong> Fusion Research 1982 (Proc. 9th<br />
Int. Conf. Baltimore, 1982), Vol. 3, <strong>IAEA</strong>, Vienna (1983) 35.<br />
[9] MANICKAM, J., Phys. Rev. Lett. 51 (1983) 1959.<br />
[10] JAHNS, G., Nucl. Fusion 22 (1982) 1049.<br />
[11] MANICKAM, J., Bull. Am. Phys. Soc. 31 (1986) 1431.<br />
DISCUSSION<br />
A. GIBSON: Can you clarify whether your observed universal current density<br />
profile also holds good for discharges with large additional heating, especially in the<br />
case of off-axis heating?<br />
H. SOLTWISCH: So far we have not made any systematic studies of the current<br />
profiles during ICRH on TEXTOR.
<strong>IAEA</strong>-CN-47/A-V-1 273<br />
R.J. GOLDSTON: We have a ten-channel interferometer on TFTR, <strong>and</strong> when<br />
we carry out Abel inversion, we find significant in-out asymmetries that cannot be<br />
explained by a picture in which ne = ne(^). We attribute this result to asymmetries<br />
in the scrape-off plasma. Of course, our limiter geometry is different from yours, but<br />
I wonder whether there are any uncertainties due to effects of this sort which can<br />
interfere with your measurement of q?<br />
H. SOLTWISCH: For st<strong>and</strong>ard Ohmic discharges, especially at moderate ne,<br />
we have no indication that ne varies considerably on a flux surface. Lithium beam<br />
measurements of ne in the scrape-off layer usually match the ne profiles obtained by<br />
interferometry quite well.
<strong>IAEA</strong>-CN-47/A-V-2<br />
STABILITY AND CONFINEMENT STUDIES<br />
IN THE PRINCETON BETA EXPERIMENT (PBX)*<br />
M. OKABAYASHI, K. BOL, M. CHANCE, P. COUTURE 1 ,<br />
H. FISHMAN, R.J. FONCK, G. GAMMEL, W.W. HEIDBRINK 2 ,<br />
K. IDA 3 , K.P. JAEHNIG, G. JAHNS 2 , R. KAITA, S.M. KAYE,<br />
H. KUGEL, B. LeBLANC, J. MANICKAM, W. MORRIS 4 ,<br />
G.A. NAVRATIL 5 , N. OHYABU 2 , S. PAUL, E. POWELL,<br />
M. REUSCH, S. SESNIC, H. TAKAHASHI<br />
Princeton Plasma Physics Laboratory,<br />
Princeton University,<br />
Princeton, New Jersey,<br />
United States of America<br />
Abstract<br />
STABILITY AND CONFINEMENT STUDIES IN THE PRINCETON BETA EXPERIMENT (PBX).<br />
Values of /3t in excess of 5% were achieved in the PBX tokamak by producing plasmas with<br />
indentations > 20%. Despite the high beta equilibria achieved, the plasmas still remained within the first<br />
regime of stability. Comparisons of data with theoretical analyses were made in order to evaluate the<br />
MHD stability properties for plasmas close to the Troyon-Gruber limit at all q. At the low q <strong>and</strong> high<br />
l3t, the plasmas were limited by hard disruptions whose characteristics were generally consistent with<br />
those expected from ideal external kink modes. At higher q, a wide variety of internal <strong>and</strong> edge MHD<br />
modes were found to be associated with loss of both thermal <strong>and</strong> fast ion energy. This MHD activity<br />
included fishbones, internal sawtooth-like disruption, Edge Relaxation Phenomena (ERPs), coupled disruptions,<br />
<strong>and</strong> the 'tangential equivalent' of fishbones. Most of the activity was associated with internal<br />
m/n = 1/1 modes. At low plasma density, the tangential instabilities observed in discharges with pure<br />
tangential <strong>and</strong> mixed tangential <strong>and</strong> perpendicular neutral beam injection, led to fast ion losses that were<br />
comparable to those associated with fishbones in purely perpendicular injection.<br />
* Work supported by the United States Department of Energy, under Contract<br />
No. DE-AC02-76CHO-3073.<br />
1 Institut de la recherche d'Hydro-Qudbec, Canada.<br />
2 GA Technologies Inc., San Diego, CA, USA.<br />
3 University of Nagoya, Nagoya, Japan.<br />
4 Balliol College, University of Oxford, Oxford, UK.<br />
5 Columbia University, New York, NY, USA.<br />
275
276 OKABAYASHI et al.<br />
1. Introduction<br />
Recent theoretical results [1,2] indicate that the beanshaped<br />
configuration can lead to high-8t plasmas in the second<br />
stability regime for both ballooning <strong>and</strong> internal kink<br />
modes. The PBX [3] has achieved values of 8t in excess of 5%<br />
in plasmas that have indentations >20%. While the (3. values<br />
are greater than those previously achieved on conventional<br />
tokamaks, the plasmas still reside within the first regime of<br />
stability, as defined empirically by the relation £S < 2.58 ,<br />
where 8 = u I /(a . ,B. ), with a ., the midplane half radius<br />
c o p mid t mid<br />
[4,5]. Extensive theoretical <strong>and</strong> experimental analyses have<br />
been carried out in order to evaluate the MHD phenomena<br />
associated with the present operational 8t limit. This paper<br />
summarizes the results of these studies <strong>and</strong>, in addition,<br />
compares the MHD properties <strong>and</strong> energetics of plasmas with<br />
purely perpendicular injection to those with purely tangential<br />
injection. The final topic is a brief discussion of the confinement<br />
<strong>and</strong> transport properties of H-mode plasmas.<br />
The experimental conditions near the Troyon-Gruber 8t<br />
limit are summarized in Fig. 1. While Fig. 1(a) contains the<br />
data points over all experimental conditions, the data in<br />
Fig. 1(b) <strong>and</strong> 1 (c) were limited, for purposes of clarity, to<br />
discharges with 0fc > 1.5 8 • At high 8C, discharges were<br />
obtained with indentations of 18 to 22%; here the indentation<br />
i is defined as i =d/(2a..+d), where d is the radial<br />
depth of the indentation. At lower 8 , the highest attainable<br />
indentations were progressively less, <strong>and</strong> the edge q values<br />
were higher.<br />
Along the 0t boundary, the various MHD phenomena <strong>and</strong><br />
plasma characteristics that were observed depended on the<br />
value of 8 • At the highest 8 , plasmas were limited by hard<br />
disruptions exhibiting little MHD activity until just before<br />
the disruption. At lower values of 8 (0.8 to 1.3), 8t saturation,<br />
sometimes with subsequent 8t collapse, was observed.<br />
The 8t~saturation phase of the discharge was associated with<br />
internal <strong>and</strong> external MHD bursts, while the collapse phase was<br />
associated with a more continuous, saturated amplitude mode in<br />
addition to ERP's. Much, but not all, of the MHD activity<br />
during both phases of these discharges exhibited internal m/n<br />
= 1/1 activity. Examples of high- <strong>and</strong> low-8 discharges are<br />
shown in Fig. 2(a) (0=5.3%, 8 =2.5, i^ = 20%) <strong>and</strong><br />
Fig. 2(b) (8t = 2.8%, 8C = 1-0, i °= 10%). "ihe high-8t<br />
configuration could be produced only by ramping the current at<br />
a rate of >1.5 MA/sec. For the 8t collapse discharges, the<br />
current was held relatively constant during the neutral-beam<br />
pulse.
0.2-<br />
0.1-<br />
10-<br />
5-<br />
(a)<br />
<strong>IAEA</strong>-CN-47/A-V-2 277<br />
, , . , I , I , , I , , , . I I , . , I , , ,<br />
' ' ' I ' ' ' • i ' ' ' '<br />
(b)<br />
(c)<br />
*" * *'<br />
l<br />
p > I.5&<br />
0 0.5 1.0 1.5 2.0 2.5 3.0<br />
fie<br />
FIG. 1. Range of experimental parameters, (a) Achieved @t versus Troyon-Gruber parameter $c,<br />
including all experimental conditions; (b) indentation in versus /3C only for /3 > 1.5 0C; (c) qedge versus<br />
/3C only for fi > 1.5 |8C.
278 OKABAYASHI et al.<br />
(a)<br />
1.2 1.6<br />
X (metres)<br />
1.2 1.6<br />
X (metres)<br />
FIG. 2. Examples of discharges with (a) high @c (high 0, <strong>and</strong> low q with large current ramp) <strong>and</strong><br />
(b) low /3C (medium /3( <strong>and</strong> medium q with low current ramp). Equilibrium was calculated at<br />
t = 560 ms for high Qc (a) <strong>and</strong> t = 575 ms for low £c (b).<br />
2. Discharges Near the (3. Limit<br />
In an attempt to delineate the mode or modes responsible<br />
for the experimental 0. limit, theoretical 0. limits were<br />
calculated using equilibria based on the experimental conditions<br />
(Fig. 3). Calculations were performed in which the<br />
following parameters were matched to the experimental measurements:<br />
coil <strong>and</strong> plasma currents, poloidal flux, diamagnetic<br />
signal, <strong>and</strong> a total pressure profile taken to be proportional<br />
to the electron pressure profile measured by Thomson scattering.<br />
In some cases these pressure profiles were cross checked<br />
against the pressure profiles determined by the time<br />
dependent, generalized geometry transport code, TRANSP. Three<br />
cases at various |3 were chosen as representative. In this<br />
calculation q(0) was fixed at 0.8. The calculations focused<br />
on three instabilities: the internal <strong>and</strong> external kink <strong>and</strong> the<br />
2.0
10-<br />
5-<br />
<strong>IAEA</strong>-CN-47/A-V-2 279<br />
, , , I I , , , . I , , , , I , , , I I I I I I I I<br />
• Non-Disruptive<br />
* Disruptive<br />
Internal<br />
Kink Limit 4<br />
Ballooning Limit<br />
FIG. 3. Comparison of experimentally achieved j3; values <strong>and</strong> onset of various ideal MHD instabilities.<br />
Cases chosen as representative are: (1) 0C = 2.5; j3 = 5.3%; in = 20%; (2) &c - 1.5; 0 = 3.1%;<br />
in = 17%; (3) Pc = 1.0; 0 = 2.8%; in = 10%.<br />
high-n ballooning modes. For high f} <strong>and</strong> hence high<br />
indentation, the internal kink mode is completely stable <strong>and</strong><br />
the marginal f3 for ballooning modes is between 8 <strong>and</strong> 9%.<br />
However, without a conducting shell, the external kink goes<br />
unstable at 3.5%, but with a conducting shell at one plasma<br />
midplane half-width, k>w/a . = 2, the marginal 0 for stability<br />
is increased to 4.5-5%, close to the observed value.<br />
At slightly lower 0c (Sc => 1.5, 8t = 3.1%, in = 17%), the<br />
relative stability of the three modes is similar to that at<br />
higher pc. At the lowest Q , with the lower indentation (6<br />
= 1.1, f$t = 2.7%, in = 10%), the internal kink is unstable,<br />
indicating a more peaked pressure profile than that assumed in<br />
previous theoretical studies [2]. With these pressure <strong>and</strong> q<br />
profiles consistent with the experimental results, the<br />
external kink <strong>and</strong> ballooning modes can be destabilized at<br />
relatively low values of 6 (1.5 to 2.5%).<br />
3. MHD Activity<br />
3.1 High Bc<br />
High « ($c - 2.5) discharges were produced by employing<br />
c c<br />
a large current ramp of >1.5 MA/sec for a period of up to 140<br />
msec during neutral-beam injection, resulting in discharges
280 OKABAYASHI et al.<br />
similar to the one shown in Fig. 2(a). The plasma parameters<br />
for this discharge were I = 570 kA, n (0) = 6.0 x 10 13 cm~ 3 ,<br />
T (0) = 2.0 keV, <strong>and</strong> T±(.0f = 4.5 keV at t = 570 msec [6]. All<br />
discharges at these high 0 terminated in a hard disruption.<br />
The disruption, at the highest 0 (<strong>and</strong> lowest q), was characterized<br />
by rapid growth (150 ysec) of magnetic activity<br />
leading to a simultaneous loss of plasma energy <strong>and</strong> current.<br />
At slightly lower 0 , growth of magnetic activity led first to<br />
the partial (30%) loss of plasma energy with no loss of<br />
current[7], but with several msec delay to the loss of both<br />
current <strong>and</strong> the remainder of the energy. The amplitude of the<br />
m/n = 1/1 component was smaller in the case of the shorter<br />
delays. The delay period was determined to be a period of<br />
non-oscillating exponential growth of an n = 1 mode locked in<br />
phase with a specific toroidal orientation, presumably due to<br />
some field misalignment.<br />
The poloidal mode structure of the magnetic activity<br />
agrees well with that calculated from PEST for the external<br />
kink with some of the ideal MHD constraints relaxed [8].<br />
Strong coupling across the discharge results in a spectrum<br />
of m components, including an m/n = 1/1 component near the<br />
center. The amplitude of this component is theoretically<br />
expected to depend strongly on the exact value of [q(0) - 1].<br />
At still lower 0c (1.5 to 2.0), the internal m/n = 1/1<br />
crash was accompanied by a smaller energy loss, <strong>and</strong> it did not<br />
necessarily lead to a current termination [7].<br />
3.2 Low ft<br />
c<br />
At values of ft « 1 U n * 10%), stability calculations<br />
indicate that the plasmas may be unstable to external or<br />
internal kink or ballooning modes depending on the specific 0.<br />
value (Fig. 3). Experimentally these plasmas exhibited a<br />
variety of internal <strong>and</strong> edge MHD phenomena, some of which were<br />
associated with losses of thermal <strong>and</strong>/or fast-ion energy. An<br />
example of this is shown in Fig. 4; for this discharge four<br />
neutral beams were injected (two perpendicular <strong>and</strong> two<br />
parallel) with a total injected power of 5.2 MW. The diamagnetic<br />
signal shows 0. increasing <strong>and</strong> then saturating at<br />
about 590 msec <strong>and</strong> finally collapsing at about 640 msec.<br />
During the time of 0t saturation, there were various MHD modes<br />
excited: internal disruptions with m/n = 1/1 precursors (582,<br />
590, 598, <strong>and</strong> 620 msec), fishbones (606, 608, 610, <strong>and</strong> 615<br />
msec), <strong>and</strong> edge relaxation phenomena — ERP's [9-12], causing<br />
energy loss predominantly from the outer plasma region (e.g.<br />
592 msec). Associated with the collapsing phase in the plasma<br />
3t was a continuous, saturated amplitude mode that exhibited<br />
an m/n = 1/1 internal structure <strong>and</strong>, depending on the exact
CHARGE<br />
EXCHANGE n^<br />
FLUX<br />
u ^<br />
(A.U.)<br />
-5<br />
MIRNOV<br />
SIGNAL 2<br />
(A.U.)<br />
Ha-SIGNAL je-<br />
(A.U.)<br />
550<br />
<strong>IAEA</strong>-CN-47/A-V-2 281<br />
TIME(ms)<br />
FIG. 4. Characteristics of low @c discharges. A0r is diamagnetic flux loop signal, <strong>and</strong> 0t is determined<br />
from Aj <strong>and</strong> flux loop measurements.<br />
discharge, either an n = 1, m = 2 or a higher-m coupled mode<br />
structure as deduced from the magnetic probe measurements.<br />
The plasma stored energy dropped even more dramatically when<br />
the mode locked (t = 667 msec) <strong>and</strong>, after locking, grew<br />
exponentially.<br />
3.2.1 (Jt-Saturation Phase<br />
While the m/n = 1/1 precursor to the internal disruption<br />
during the $ -saturation phase is similar in some respects<br />
(frequency <strong>and</strong> growth rate) to that of a typical sawtooth,<br />
other features point to their marked difference. Figure 5(a)<br />
shows the amplitude <strong>and</strong> phase of the precursor oscillations as<br />
measured by the horizontally viewing soft X-ray array. The<br />
relative amplitude of the oscillations, s'/s, exhibits a broad<br />
structure <strong>and</strong> shows a gradual phase change across the plasma<br />
center unlike the typical sawtooth which exhibits a clear 180°<br />
jump in phase [Fig. 5(b)]. Here s'/s is defined as the ratio<br />
of the precursor amplitude s to the average X-ray signal
282<br />
-200<br />
0.03<br />
0<br />
200<br />
# o'<br />
(o)<br />
-30<br />
— |<br />
—<br />
0<br />
— i<br />
1<br />
_<br />
o<br />
101<br />
1<br />
0<br />
1<br />
-1<br />
9<br />
0<br />
0<br />
OKABAYASHI et al.<br />
o<br />
1<br />
o<br />
1<br />
1<br />
o<br />
0<br />
0<br />
Z(cm)<br />
1<br />
0<br />
1<br />
1<br />
Q<br />
1 _l<br />
-30 0<br />
Z(cm)<br />
0<br />
o<br />
0<br />
1<br />
o<br />
o<br />
1<br />
—1—'—<br />
FIG. 5. (a) Amplitude <strong>and</strong> phase of precursor with two perpendicular <strong>and</strong> two parallel injectors<br />
(at t = 620 ms). Solid lines are theoretical values predicted with PEST code, (b) Behaviour of typical<br />
sawtooth.<br />
0.4 -<br />
FIG. 6. Change of soft X-ray radial profile before <strong>and</strong> after mode crash, (a) Crash of internal mode<br />
producing ERP with several ms delay; (b) crash of internal mode having additional inversion around<br />
q = 2 surface; (c) crash with ERP event; (d) typical sawtooth crash.<br />
1<br />
1<br />
o<br />
1<br />
6<br />
1<br />
0<br />
0<br />
T<br />
0<br />
o<br />
30<br />
1<br />
1<br />
30<br />
0<br />
-<br />
—<br />
—<br />
-<br />
0 -<<br />
(a)<br />
(b)
<strong>IAEA</strong>-CN-47/A-V-2 283<br />
amplitude s. Another difference between the internal disruptions<br />
shown here <strong>and</strong> the typical sawtooth was the profile of<br />
the heat redistribution at the time of the "crash," as shown<br />
in Fig. 6. In the figure, the As/s for various types of<br />
events are shown, where As/s is the drop in the X-ray signal<br />
at the crash normalized to the average value. While the sawtooth<br />
exhibits a relatively large drop in the plasma center<br />
<strong>and</strong> an inversion near the q = 1 radius (curve d), one type of<br />
internal disruption exhibits only a small, but broad, drop in<br />
the center, with large positive As/s beyond (curve a). The<br />
normalized amplitude As/s did not decrease within the field of<br />
view. Occasionally, an additional inversion was observed near<br />
z » 40 cm, close to the estimated location of q = 2 surface as<br />
shown on curve b. The "coupled disruption" events [curve<br />
(b))] coincided with spikes in the H /D emission. The type<br />
of crash that does not exhibit a second inversion (curve a)<br />
tended to cause the ERP event (curve c) within a few msec,<br />
most likely due to the development of a large temperature<br />
gradient at a larger minor radius following the internal disruption.<br />
The large temperature gradient did not develop in<br />
the second type of internal disruption (curve b) because of<br />
the double inversion; therefore, this "coupled disruption"<br />
event did not lead to an ERP. There is also a possibility<br />
that coincident with the coupled disruption, a small ERP<br />
occurred which might have been masked in our measurement by<br />
the q = 2 disruption. The energy loss evaluated from the diamagnetic<br />
flux signal at the ERP events was 3 to 4% of the<br />
stored energy. This value was consistent with the thermal<br />
energy loss estimated from the change of the soft X-ray<br />
signal.<br />
To test the relation between the observed internal<br />
oscillations <strong>and</strong> the ideal MHD prediction, the soft X-ray<br />
array signals were calculated using the simulation from the<br />
ideal-MHD code, PEST, assuming that the emissivity was proportional<br />
to the integral along the sight of the square of the<br />
pressure. As shown by the solid line in Fig. 5(a), theory<br />
predicts a broad phase shift presumably due to the strong<br />
coupling to the higher-m components. This compares well with<br />
the experimental observation. Furthermore, it was recently<br />
pointed out [13] that pressure-driven internal modes are<br />
unstable at high Bfc/S , even for q(0) > 1 if the shear is<br />
reduced around the magnetic axis. Under that condition the<br />
mode tends to couple to the plasma periphery; the experimental<br />
profiles were not far from the onset condition.<br />
3.2.2 8t-Collapse Phase<br />
The actual collapse of gt occurs during an otherwise<br />
steady-state portion of the discharge. Associated with the
284 OKABAYASHI et al.<br />
beginning of the loss of plasma <strong>and</strong> beam energy during this<br />
time was a continuous mode, as observed on various magnetic<br />
pick-up coils, with a frequency of up to 15 kHz <strong>and</strong> locked to<br />
the plasma rotation. This continuous mode grew after several<br />
internal disruptions <strong>and</strong>/or fishbones. The internal structure<br />
of this mode was similar to that of the internal disruption<br />
precursor, exhibiting m/n = 1/ 1 behavior. Dependent on the<br />
precise discharge, however, the strength of the internal<br />
m/n = 1/1 varied. For discharges in which the continuous<br />
m/n =1/1 was dominant internally, the magnetic loops observed<br />
higher m (4 to 6)/n = 1 components, indicating a strong<br />
toroidal coupling of the internal mode. However, for<br />
discharges in which the internal m/n = 1/1 was not dominant<br />
(e.g., higher amplitude m > 2 components observed on the soft<br />
X-rays), the magnetic loops indicated m/n = 2/1 structure of<br />
the continuous modes. During the continuous modes, the<br />
excitation of ERP's occasionally coincided with a decrease in<br />
frequency (at constant Bg signal amplitude) of the mode.<br />
The continuous oscillations were observed to slow down<br />
during the discharge, corresponding to a slowing down of the<br />
plasma rotation. Once locked, however, the n = 1 mode grew<br />
(it is difficult to identify m numbers due to slow rotation),<br />
as observed from a toroidal array of B loops, <strong>and</strong> was associated<br />
with a large loss of energy. As was the case in the lowq<br />
disruption, the mode locked in phase with the same toroidal<br />
orientation mentioned<br />
disruption.<br />
earlier in connection with the high-St<br />
3.3 Tangential Beam-Driven Instability at Modest Indentation<br />
<strong>and</strong> Low Density<br />
With purely tangential injection for plasmas with 3C<br />
= 1.0 to 1.2 <strong>and</strong> low indentation, a loss of fast ions<br />
associated with bursts of low-frequency (20 to 30 kHz) <strong>and</strong><br />
high-frequency (150 to 220 kHz) MHD activity was<br />
observed [14]. As shown in Fig. 7 the fast-ion loss, detected<br />
on both the neutron <strong>and</strong> the neutral charge-exchange detectors,<br />
caused a significant power loss only in low density (n < 1.5<br />
x 10 cm" ) plasma, where there was a correspondingly high<br />
ratio of beam ion pressure to plasma thermal pressure. The<br />
fast-ion losses occurred during periods of either low plus<br />
high-frequency activity or high-frequency activity alone. The<br />
range of high frequencies was comparable to the transit<br />
frequency of tangentially moving beam ions, indicating a<br />
resonant interaction between the fast particles <strong>and</strong> the mode<br />
similar to fishbone loss [15]. The greatest particle loss<br />
occurred during the combined low- <strong>and</strong> high- frequency<br />
events. The low-frequency portion exhibited a growing<br />
m/n = 1/1 structure <strong>and</strong> led to a "crash" that had a much
-0.3^1<br />
(mWb) -0.4<br />
NEUTRON<br />
FLUX<br />
CHARGE 4<br />
EXCHANGE<br />
FLUX (A.U.) 0<br />
MIRNOV<br />
SIGNAL 0<br />
(A.U.)<br />
Hq-SIGNAL<br />
(A.U.)<br />
1.6<br />
1.4<br />
1.2<br />
-5<br />
'1.0 - Stable<br />
0.8<br />
0.6<br />
<strong>IAEA</strong>-CN-47/A-V-2 285<br />
CENTRAL X-RAY DIODE<br />
(Z=0)<br />
.,— ^ ~<br />
E06E DIODE<br />
(Z = 27cm)<br />
- ^ ~ ^ ^ *^V_- •<br />
525 530 535 540 545 550<br />
TIME(ms)<br />
FIG. 7. Characteristics of parallel injection.<br />
~1 1— T"<br />
Unstoble<br />
0.4 _. 1 , I , I . L I , L<br />
0.6 0.8 1.0 1.2 1.4 1.6 1.8 2.0 2.2<br />
1<br />
o,»- 2ii<br />
FIG. 8. Comparison of onset dependence of fast ion loss on /3 , (J, for perpendicular <strong>and</strong><br />
parallel injections.
286 OKABAYASHI et al.<br />
smaller central drop <strong>and</strong> much broader inversion radius than a<br />
typical sawtooth, but was similar to that of the internal<br />
disruption cases. The average energetic ion confinement time,<br />
inferred from the drops in the neutron emission, differed<br />
little from that associated with the fishbone instability<br />
during purely perpendicular injection. In addition, the<br />
values of $. <strong>and</strong> (3 for which the tangential <strong>and</strong> fishbone<br />
modes go unstable are similar (Fig. 8).<br />
4. Confinement <strong>and</strong> Transport in H-Mode<br />
PBX plasmas limited by a magnetic separatrix internal to<br />
the vessel rather than by a material surface were produced by<br />
using a flat or only slightly increasing (
<strong>IAEA</strong>-CN-47/A-V-2 287<br />
1.5 2.0<br />
TF(Tesla)<br />
FIG. 9. Dependence of H-mode confinement time on toroidal field.<br />
An analysis of T.-profile data on Dili has indicated that the<br />
ion thermal diffusivity is neither neoclassical-like in<br />
magnitude nor in form [17]. The Dili results indicated that<br />
while X' was °f tne order of the neoclassical value in the<br />
center of the discharge, it could be as much as ten times the<br />
neoclassical value halfway out, <strong>and</strong> that ion thermal<br />
conduction, under these conditions, could dominate the<br />
electron <strong>and</strong> ion power balance.<br />
Radial ion temperature profiles from charge-exchange<br />
recombination of O^ + [18] have allowed the further investigation<br />
of this topic in these PBX H-mode plasmas. An example<br />
of the results of these analyses is shown in Fig. 10. Figure<br />
10(a) shows the T. <strong>and</strong> T profiles, while Fig. 10(b) shows the<br />
corresponding difrusivities. The T. profile labeled ax- was<br />
calculated in the traditionally st<strong>and</strong>ard fashion: the neoclassical<br />
multiplier a was adjusted in order to match the<br />
measured central T., <strong>and</strong> it was assumed to be constant across<br />
the plasma in order to determine the remainder of the T.<br />
profile [19]. For the case shown, a = 0.5 when the Chang-<br />
Hinton neoclassical x- i- s assumed [Fig. 10(b)]. The second T.<br />
profile is the measured one, <strong>and</strong> this was used directly to<br />
deduce x.; from the ion power balance. The shaded region<br />
corresponds to the b<strong>and</strong> of X' deduced is this fashion. Rather<br />
than plot a y. from a single power balance calculation,
288 OKABAYASHI et al.<br />
3.0<br />
^<br />
Tii.xf) (a)<br />
FIG. 10. (a) Calculated (— —) <strong>and</strong> measured ( ) 7} profiles; (b) thermal diffusivity.<br />
several calculations were performed/ each with a T. profile<br />
varied r<strong>and</strong>omly within the experimental uncertainties. The<br />
shaded area, then, is the envelope of x- ' s as determined from<br />
these various calculations. Because of uncertainties in T.(r)<br />
<strong>and</strong> T (r), the v. (r) inside r<br />
mid<br />
should be ignored.<br />
= 5 cm <strong>and</strong> beyond 20 0 cm<br />
It is clear from Fig. 10(b) that the two x^ profiles [0.5<br />
x x^ h <strong>and</strong> x-; (^) ] are not dramatically different in magnitude<br />
unlike the Dili result. In fact, the computed x- ^ s less than<br />
the neoclassical value in the inner half of the discharge<br />
rather than greater. In addition, to within the uncertainties<br />
in the data <strong>and</strong> the calculation, the difference in the two xprofiles<br />
is not reflected in the T. profiles; the T. (r)<br />
determined from the assumption of 0.5 x x- is consistent with<br />
the measured profile. The reason for this is that in the
<strong>IAEA</strong>-CN-47/A-V-2 289<br />
discharges analyzed, the ion thermal conduction loss never<br />
dominates <strong>and</strong> is responsible for, at most, 30% of the total<br />
energy loss.<br />
5. Summary<br />
An extensive study was carried out to evaluate the MHD<br />
behavior of plasmas residing along the first stability boundary.<br />
At the highest f3 , the achievable $. is limited by hard<br />
disruptions produced by external kink modes or substantial<br />
energy loss due to the large internal disruption. At lower 8<br />
<strong>and</strong> lower plasma indentations, various MHD modes, all with<br />
m/n = 1/1 internal activity, grow <strong>and</strong> are associated with loss<br />
of thermal <strong>and</strong> fast-ion energy. The growth of these modes is<br />
consistent with the onset of internal kink modes. In addition<br />
to the internal modes, edge phenomena, such as ERP's <strong>and</strong> the<br />
edge inversions in the coupled disruptions, lead to thermal<br />
energy loss. Purely tangential injection excites lowfrequency<br />
modes similar to fishbones, but which rotate with<br />
the plasma, <strong>and</strong> high-frequency modes that appear to be responsible<br />
for fast-ion loss through some resonant process. The<br />
presence <strong>and</strong> locking of the continuous mode clearly indicates<br />
that non-ideal MHD effects must play an important role during<br />
the saturated MHD activities in the 3 -collapse phase.<br />
Finally, transport analyses of H-mode plasmas with the<br />
observed T.(r) profile did not indicate a large difference<br />
between measured <strong>and</strong> neoclassical x- values.<br />
REFERENCES<br />
[1] CHANCE, M., JARDIN, S., STIX, T., Phys. Rev. Lett. 51 (1983) 1963.<br />
[2] MANICKAM, J., GRIMM, R., OKABAYASHI, M., Phys. Rev. Lett. 51 (1983) 1959.<br />
[3] OKABAYASHI, M., et al., in Plasma Physics <strong>and</strong> Controlled <strong>Nuclear</strong> Fusion Research 1984<br />
(Proc. 10th Int. Conf. London, 1984), Vol. 1, <strong>IAEA</strong>, Vienna (1985) 229.<br />
[4] TROYON, F., GRUBER, J., Phys. Lett. A 110 (1985) 29.<br />
[5] SYKES, A., TURNER, M.F., PATEL, S., in Controlled Fusion <strong>and</strong> Plasma Physics (Proc. 1 lth<br />
Europ. Conf. Aachen, 1983), Pt. II, European Physical Society (1983) 363.<br />
[6] BOL, K., et al., Phys. Rev. Lett. 57 (1986) 1891.<br />
[7] TAKAHASHI, H., et al., Rep. PPPL-2391, Princeton Plasma Physics Laboratory (1986).<br />
[8] OKABAYASHI, M., et al., in Proc. Int. School of Plasma Physics, Varenna, Italy, 1985 (to be<br />
published).<br />
[9] KAYE, S., BELL, M., BOL, K., BOYD, D., BRAU, K., et al., J. Nucl. Mater. 121 (1984) 115.<br />
[10] FONCK, R.J., BEIRSDORFER, P., BELL, M., BOL, K., BOYD, D., et al., in Heating in<br />
Toroidal Plasmas (Proc. 4th Int. Symp. Rome, 1984), Vol. 1, ENEA, Frascati (1984) 37.<br />
[11] WAGNER, F., BECKER, G., BEHRINGER, K., CAMPBELL, D., EBERHAGEN, A., Phys.<br />
Rev. Lett. 49 (1982) 1408.<br />
[12] McGUIRE, E., et al., in Plasma Physics <strong>and</strong> Controlled <strong>Nuclear</strong> Fusion Research (Proc. 10th<br />
Int. Conf. London, 1984), Vol. 1, <strong>IAEA</strong>, Vienna (1985) 117.
290 OKABAYASHI et al.<br />
[13] MANICKAM, J., et al., private communication (1986).<br />
[14] HEIDBRINK, W., et al., Phys. Rev. Lett. 57 (1986) 835.<br />
HEIDBRINK, W., et al., Rep. PPPL-2405, Princeton Plasma Physics Laboratory, Princeton, NJ<br />
(1986).<br />
[15] KAITA, R., et al., Plasma Phys. Controll. Fusion 28 (1986) 1319.<br />
[16] IDA, K., et al., Rep. PPPL-2313, Princeton Plasma Physics Laboratory (1986).<br />
[17] GROEBNER, R., PFEIFFER, W., BLAU, F., BURRELL, K., FAIRBANKS, E., et al., Nucl.<br />
Fusion 26 (1986) 543.<br />
[18] GAMMEL, G., KAITA, R., FONCK, R.J., JAEHNIG, K., POWELL, E., Rev. Sci. Instrum.<br />
57 (1986) 1800.<br />
[19] KAYE, S.M., GOLDSTON, R., BELL, M., BOL, K., BITTER, M., et al., Nucl. Fusion 24<br />
(1984) 1303.<br />
DISCUSSION<br />
G. BECKER: When studying ballooning stability in ASDEX discharges, it was<br />
found that the results depended appreciably on the beam contribution to the pressure<br />
profile <strong>and</strong> the time evolution of the current density profile. Did you include these<br />
effects in your ballooning mode analysis?<br />
M. OKABAYASHI: Our MHD analysis was carried out with the equilibria<br />
matched with the current <strong>and</strong> pressure profiles evaluated, first, from Thomson scattering<br />
Te(r) <strong>and</strong> ne(r) data, <strong>and</strong>, second, from the output of the TRANSP analysis.<br />
The ballooning mode was stable for both profiles.
STABILIZATION OF THE TEARING MODE<br />
T.C. HENDER, D.C. ROBINSON, J.A. SNIPES<br />
Euratom-UKAEA Fusion Association,<br />
Culham Laboratory,<br />
Abingdon, Oxfordshire,<br />
United Kingdom<br />
Abstract<br />
<strong>IAEA</strong>-CN-47/A-V-3<br />
STABILIZATION OF THE TEARING MODE.<br />
Various methods of stabilizing MHD instabilities in tokamaks are examined <strong>and</strong> compared with<br />
experiments. The intrinsic stabilizing effect of average curvature on the tearing mode is discussed, with<br />
particular reference to JET. Stabilization by RF current drive/heating <strong>and</strong> induced helical fields is<br />
considered. It appears possible to stabilize all gross resistive instabilities in the tokamak at moderate<br />
beta.<br />
1. INTRODUCTION<br />
The m = 2 tearing mode in the tokamak has been shown both theoretically [1]<br />
<strong>and</strong> experimentally [2] to play a dominant role in causing the major disruption. Control<br />
of this mode may lead to suppression of the major disruption <strong>and</strong> to an extension<br />
of the operating regime of the tokamak (higher I, N, beta). Control of the m = 1<br />
mode could permit more peaked pressure profiles, better control of the m = 2 mode<br />
<strong>and</strong> avoidance of the problems associated with the sawtooth collapse.<br />
2. STABILIZATION BY PROFILE AND PARAMETER CONTROL<br />
In this section we consider the intrinsic stabilizing effect of the average curvature<br />
on the tearing mode [3], which is particularly pronounced on JET because of its<br />
tight aspect ratio, high conductivity temperature <strong>and</strong> high beta potential. We also consider<br />
the stabilizing effect of local RF current drive/heating modifications to the<br />
equilibrium current profile.<br />
The studies discussed in this section are conducted using the linear stability code<br />
FAR [4, 5]. This code solves the compressible (or incompressible) resistive MHD<br />
equations in full toroidal geometry with no ordering assumptions.<br />
2.1. The m = 2 tearing mode<br />
The tight aspect ratio <strong>and</strong> the high degree of shaping in JET lead to strong toroidal<br />
coupling between the m = 2 harmonic <strong>and</strong> its resonant side-b<strong>and</strong>s (m = 3, 4 ...<br />
291
292 HENDER et al.<br />
2.0-<br />
1.5-<br />
1.0-<br />
0.5-<br />
Z 0.0-<br />
-0.5-<br />
-1.0-<br />
-1.5-<br />
-2.0-<br />
1 1 1<br />
/<br />
/<br />
\<br />
/<br />
/<br />
/<br />
\ A<br />
\<br />
1 1 1<br />
—1 1 1 1<br />
0.0 0.5 1.0 1.5 2.0 2.5 3.0 15 4.0 4.5<br />
\<br />
„-————,<br />
z<br />
1<br />
^. —<br />
\ ••<br />
• "<br />
R<br />
» • • " * .<br />
* * * '<br />
* * - I<br />
* # ^ . '<br />
•-.. ..••.."••" / A<br />
FIG. 1. m = 2 <strong>and</strong> m = 3 toroidal side-b<strong>and</strong> isl<strong>and</strong>s. The solid ellipse is the liner location, the<br />
broken ellipse is the plasma-vacuum interface <strong>and</strong> the squares are the locations ofpoloidal coils.<br />
for q0 > 1). Figure 1 shows the magnetic isl<strong>and</strong> structure in a constant toroidal<br />
angle plane for JET shortly before a density limit disruption when the n = 1 mode<br />
is growing linearly <strong>and</strong> is not rotating. The poloidal field strength at the liner is<br />
8IVB3 = 1%. In this case, q varies between 1.08 at the axis <strong>and</strong> 4.6 at the plasma<br />
edge. The dominant m = 2 isl<strong>and</strong>s <strong>and</strong> the toroidal side-b<strong>and</strong> m = 3 isl<strong>and</strong>s are<br />
clearly visible. The toroidal coupling is weakly stabilizing; decreasing the aspect<br />
ratio at constant q (which strengthens the coupling) lowers the growth rate. A far<br />
stronger stabilization, however, arises from the average curvature effects which<br />
increase with beta [3]. As the magnetic Reynolds number (S) increases (<strong>and</strong> the<br />
growth rate y decreases) the relative importance of the stabilizing average curvature<br />
terms (DR < 0) increases. Figure 2 shows how the n = 1 growth rate varies
5x10<br />
<strong>IAEA</strong>-CN-47/A-V-3 293<br />
10 2x10 5x10 10 2x10 5x10<br />
FIG. 2. Growth rate versus S for JET, with q = 1.08 (1 + (p/0.508)Y<br />
(solid line is growth rate, broken line is frequency).<br />
with S for a typical JET discharge with b/a = 1.4, j80 = 0.7% <strong>and</strong><br />
q = 1.08 (1 + Go/0.508) 8 ) w . This case is moderately unstable in the cylindrical<br />
limit (A' = 4.7). The growth rate of the tearing mode is strongly reduced with<br />
increasing S <strong>and</strong> becomes overstable at high S (as predicted in Ref. [3]). For values<br />
of S consistent with the flat-top in JET (~3 X 10 7 ) this case is approximately marginally<br />
stable to the n = 1 mode. The strength of the average curvature terms also<br />
increases with beta (since DR oc (3) <strong>and</strong> complete stability to the n = 1 mode occurs<br />
at j80 = 1-1% when S = 10 5 , for this case. It should be noted that, in part, this<br />
stabilization is probably also due to a decrease in A' as beta increases.<br />
This inherent stability to tearing modes may be related to the absence of m = 2<br />
oscillations <strong>and</strong> the low level of coherent MHD activity (5Be/B9 ~3 x 10~ 5 ) which<br />
is observed for the majority of the time in JET discharges with q^ > 2.3. During<br />
the q <strong>and</strong> density limit pre-disruption phase, in which strong m = 2 activity<br />
(6BS/B9 ~ 1 %) is observed, the temperature (<strong>and</strong> therefore S <strong>and</strong> beta) at the q = 2<br />
surface decrease. Since the critical A' is proportional to (a 2 T 2 /3o/Ro) 1/3 , the<br />
tearing mode is rapidly destabilized by falling |80 <strong>and</strong> S, in agreement with the<br />
experimental observations.<br />
For cases in which m = 2 activity is observed on JET, we have compared the<br />
theoretically predicted <strong>and</strong> the experimentally measured phase <strong>and</strong> amplitude variations<br />
of the poloidal fluctuations (8Be) at the liner. Figure 3 shows a comparison of<br />
the amplitude variation of 83$ with poloidal angle between the experimental<br />
measurements on JET <strong>and</strong> the predictions from the FAR code. The theoretical results
294 HENDER et al.<br />
-E 0<br />
1.0 -•<br />
0.5 -<br />
m<br />
2 1.0<br />
0.5 -<br />
- \<br />
JET '<br />
FAR '<br />
i<br />
(a)<br />
/ \<br />
/ (b) \<br />
(1)<br />
1 (3)<br />
120 240<br />
Coil angle<br />
I<br />
I<br />
1<br />
il -<br />
FIG. 3. Fluctuating poloidal field amplitude variation for JET.<br />
(a) RF shot with q^ ~ 5, (b) OH shot with qt ~ 7.0, (c) NBI shot with q$ ~ 6.5; with FAR<br />
predictions for increasingly peaked current profiles: (1) (1 + (iji/OA) 4 )' 1 '', (2) {1 + ty/OA) 2 )' 2 ,<br />
(3) (1 - t/0.85), q0 = 1.08 at $0 = 0.8%.<br />
reproduce the strong in-out ballooning asymmetry shown by the experiment <strong>and</strong> indicate<br />
that the in-out ratio becomes stronger for more peaked current profiles. Between<br />
the liner <strong>and</strong> limiter surfaces (in the FAR calculations) we have imposed the<br />
equilibrium constraints P = Jz = 0 <strong>and</strong>, to match experimental observations, used<br />
a high resistivity (5 X 10 4 relative to its central value). The locations of the liner,<br />
the plasma-vacuum interface <strong>and</strong> the poloidal field coils are shown in Fig. 1 for the<br />
same case as shown in Fig. 3, curve (2).<br />
We have also investigated the effects of localized heating <strong>and</strong>/or current drive,<br />
which allows us to tailor the current profile near the q = 2 surface. A possible<br />
scheme for JET is to use ECRH downshifted by 60 GHz, which leads to a localized<br />
unidirectional driven current [6]. We have added a Gaussian perturbation to the toroidal<br />
equilibrium current to simulate the driven current (51). We find that the stabilization<br />
is very sensitive to the radial location of the current perturbation <strong>and</strong> that it is<br />
optimized when it is centred on the q = 2 surface; this is in agreement with<br />
experimental results from T-10 [7]. From examining a range of q-profiles we conclude<br />
that 8I/I ~ 5 % should be sufficient to stabilize the m = 2 tearing mode in<br />
JET, in all but the most extreme cases. Ray-tracing <strong>and</strong> Fokker-Planck calculations<br />
360
<strong>IAEA</strong>-CN-47/A-V-3 295<br />
0 5 10 15<br />
Aspect Ratio<br />
FIG. 4. Stabilization of the resistive m = 1 mode by lowering the aspect ratio when q' = 0, S = 10 s<br />
indicate that such a current can be achieved with 2 MW of ECRH [6]. It should be<br />
noted that the intrinsic stability of the tearing mode in JET means that cylindrical<br />
estimates of 6I/I necessary to stabilize a given case would be much larger.<br />
2.2. The m = 1 sawtooth mode<br />
Because of the different physics of the toroidal m = 1 mode, stabilization techniques<br />
that are applicable to m > 2 instabilities will not necessarily work for the<br />
m = 1 mode.<br />
At |3 < |8crit, with monotonically increasing q-profiles <strong>and</strong> q0 < 1, the ideal<br />
internal kink mode is stable [8]. In these cases, however, the generally large values<br />
of A' (—100) result in a resistive kink instability with y « S" 1/3 , a result which has<br />
been confirmed numerically [9]. The resistive m = 1 kink mode has been proposed<br />
as providing an explanation for the sawtooth [10], though experiments on JET<br />
suggest a much faster scaling [11]. The rapid growth of the resistive m = 1 kink<br />
mode means that the average curvature terms do not stabilize this mode. With a tight<br />
aspect ratio (which makes the ideal energy strongly stabilizing) <strong>and</strong> high S it is<br />
possible for the m = 1 mode to have a tearing mode scaling (7 0 at q = 1), tend to be weak because the<br />
toroidal curvature vanishes at q = 1 <strong>and</strong> also the local aspect ratio is generally quite<br />
large.<br />
It is possible to reduce the growth rate, <strong>and</strong> in some cases to achieve complete<br />
stability to the resistive m = 1 mode, by reducing q' near q = 1. In practice, this<br />
may be achieved by RF current drive or indeed it may be the profile which the plasma<br />
chooses in some cases [12]. Figure 4 shows the growth rate of the n = 1 mode as
296 HENDER et al.<br />
a function of aspect ratio for the profile q = 1 — 0.2 (1 — (p/0.58) 2 ) 3 , with<br />
S = 10 5 <strong>and</strong> 0 = 0. For this q-profile there is a very strong stabilizing effect when<br />
the aspect ratio is decreased. This stabilization is a toroidal effect. For the same<br />
q-profile in the cylindrical limit the m = 1 mode is destabilized when the aspect ratio<br />
is reduced (i.e. the ratio of length to radius). This is partly because in the cylindrical<br />
limit the ideal internal kink mode is unstable at zero beta [8]. This method of stabilizing<br />
the m = 1 resistive mode appears to be sensitive to the form of the q-profile; for<br />
other q-profiles, with q' = 0 at q = 1, we have not been able to achieve complete<br />
stability.<br />
3. STABILIZATION WITH HELICAL FIELDS<br />
In this section we examine the effects of resonant fields induced by saddle coils<br />
external to the plasma, as studied on Pulsator [13] <strong>and</strong> TOSCA [14]. Because of the<br />
complex boundary conditions we use in this case the reduced tokamak MHD equations.<br />
Single helicity non-linear calculations show that if we apply a (2, 1) helical<br />
current such that its x-points <strong>and</strong> the 0-points of an existing (2, 1) plasma isl<strong>and</strong> are<br />
aligned, then the isl<strong>and</strong> width first decreases. However, the final saturated state is<br />
such that the x-points of the saddle coil <strong>and</strong> of the plasma isl<strong>and</strong> are aligned <strong>and</strong>,<br />
because of the influence of the saddle coil, the isl<strong>and</strong> width increases slightly. We<br />
can exploit the initial decrease in isl<strong>and</strong> width by using a pair of orthogonal coils to<br />
actively stabilize the (2, 1) mode. This scheme seems particularly attractive for a<br />
locked or slowly rotating (-400 Hz) (2, 1) mode such as that which precedes the<br />
disruption in JET. We have also examined the effect of adding a static saddle coil<br />
current to a toroidally rotating plasma. For a (2, 1) saddle coil perturbation which<br />
gives vacuum isl<strong>and</strong>s that are significantly smaller than the intrinsic saturated plasma<br />
isl<strong>and</strong>, the isl<strong>and</strong> continues to rotate <strong>and</strong> has a slightly enhanced width. For larger<br />
saddle coil currents the plasma isl<strong>and</strong> locks to the phase of the imposed perturbation<br />
<strong>and</strong> the isl<strong>and</strong> width is slightly increased. Experimentally it has been observed on<br />
machines such as Pulsator [13] <strong>and</strong> TOSCA [14] that large (2,1) saddle coil currents<br />
will lock the mode <strong>and</strong> may cause a disruption (<strong>and</strong> indeed the mode lock observed<br />
on JET may be caused by a similar phenomenon, with the mode locking to small<br />
inhomogeneities in the external fields). Lower currents, however, have been<br />
observed experimentally to stabilize the mode without phase locking. It appears that<br />
this stabilization must be due to effects not included in our simulation (quasi-linear<br />
modifications to the resistivity, toroidal coupling, etc.).<br />
4. CONCLUSIONS<br />
Various methods for stabilizing MHD instabilities in the tokamak have been<br />
examined. For the m = 2 tearing mode the average curvature (i.e. beta) is strongly
<strong>IAEA</strong>-CN-47/A-V-3 297<br />
stabilizing — an effect which is particularly pronounced at tight aspect ratio <strong>and</strong> high<br />
conductivity temperatures. The average curvature terms are also stabilizing in the<br />
non-linear Rutherford regime [15]. This stabilization effect, however, depends<br />
strongly on the details of the MHD equations within the resistive layer <strong>and</strong> may<br />
therefore be affected by kinetic effects.<br />
Local flattening of the current (<strong>and</strong> q) with RF current drive/heating can stabilize<br />
the resistive m = 1 <strong>and</strong> m = 2 modes. For the m = 1 mode this is a purely<br />
toroidal effect.<br />
The m = 2 mode can be stabilized with an applied (2, 1) helical field, using<br />
an active feedback system of two orthogonal coil sets. A static saddle coil perturbation,<br />
with the induced saddle coil isl<strong>and</strong> widths comparable to the intrinsic plasma<br />
isl<strong>and</strong>, will phase lock a rotating mode; this is in agreement with experiment.<br />
ACKNOWLEDGEMENTS<br />
The authors are indebted to the ORNL MHD Group for providing them with<br />
a copy of the FAR code <strong>and</strong> for their continued collaboration <strong>and</strong> help. The authors<br />
would also like to thank R. J. Hastie for numerous useful discussions <strong>and</strong> suggestions.<br />
This work was performed under a Task Agreement between the JET Joint<br />
Undertaking <strong>and</strong> Culham Laboratory.<br />
REFERENCES<br />
[1] WADDELL, B.V., et al., Phys. Rev. Lett. 41 (1978) 1386.<br />
[2] ROBINSON, D.C., McGUIRE, K., Nucl. Fusion 19 (1979) 115.<br />
[3] GLASSER, A.H., et al., Phys. Fluids 18 (1975) 875.<br />
[4] HENDER, T.C., HASTIE, R.J., ROBINSON, D.C., submitted to Nucl. Fusion.<br />
[5] CHARLTON, L.A., et al., J. Comput. Phys. 63 (1986) 107.<br />
[6] O'BRIEN, M., et al., in Controlled Fusion <strong>and</strong> Plasma Heating (Proc. 13th Europ. Conf.<br />
Schliersee, 1986), Vol. 2, European Physical Society (1986) 270.<br />
[7] ALIKAEV, V.V., ARSENTIEV, Yu.I., BAGDASAROV, A.A., et al., in Plasma Physics <strong>and</strong><br />
Controlled Nucler Fusion Research 1984 (Proc. 10th Int. Conf. London, 1984), Vol. 1, <strong>IAEA</strong>,<br />
Vienna (1985) 419.<br />
[8] BUSSAC, M.N., et al., Phys. Rev. Lett. 35 (1975) 1638.<br />
[9] HASTIE, R.J., HENDER, T.C., CHARLTON, L.A., HOLMES, J.A., CARRERAS, B.A.,<br />
submitted to Phys. Fluids.<br />
[10] WADDELL, B.V., et al., Nucl. Fusion 18 (1978) 735.<br />
[11] EDWARDS, A.W., et al., Rep. JET-P(86)12, Culham Laboratory, Abingdon (1986).<br />
[12] SOLTWISCH, H., SCHLUTER, J., STODIEK, W., MANICKAM, J., Paper <strong>IAEA</strong>-CN-47/<br />
A-V-l, these Proceedings, Vol. 1.<br />
[13] KARGER, F., WOBIG, H., CORTI, S., et al., in Plasma Physics <strong>and</strong> Controlled <strong>Nuclear</strong> Fusion<br />
Research 1974 (Proc. 5th Int. Conf. Tokyo, 1974), Vol. 1, <strong>IAEA</strong>, Vienna (1975) 207.
298 HENDER et al.<br />
[14] ELLIS, J.J., HOWLING, A.A., MORRIS, A.W., ROBINSON, D.C., in Plasma Physics <strong>and</strong><br />
Controlled <strong>Nuclear</strong> Fusion Research 1984 (Proc. 10th Int. Conf. London, 1984), Vol. 1, <strong>IAEA</strong>,<br />
Vienna (1985) 363.<br />
[15] KOTSCHENREUTHER, M., et al., Phys. Fluids 28 (1985) 294.<br />
DISCUSSION<br />
M. PORKOLAB: It is possible that we have already observed the effect you<br />
propose to use for stabilization of the sawteeth, namely to flatten the current profile<br />
near the q = 1 surface. In contrast to results for ASDEX, the inductance
EXPERIMENTAL AND THEORETICAL<br />
STUDIES OF CIRCULAR CROSS-SECTION<br />
HIGH BETA TOKAMAKS*<br />
G.A. NAVRATIL, Y. BARANSKY, A. BHATTACHARJEE,<br />
C.K. CHU, A.V. DENIZ, A.A. GROSSMAN, A. HOLLAND,<br />
T. IVERS, X.L. LI, T.C. MARSHALL, M.E. MAUEL,<br />
S. SABBAGH, A.K. SEN, J. VAN DAM 1 , X.-H. WANG<br />
Plasma Physics Laboratory,<br />
Columbia University,<br />
New York, New York<br />
M. HUGHES, M. PHILLIPS, A.M.M. TODD<br />
Grumman Corporation,<br />
Princeton, New Jersey<br />
United States of America<br />
Abstract<br />
<strong>IAEA</strong>-CN-47/A-V-4<br />
EXPERIMENTAL AND THEORETICAL STUDIES OF CIRCULAR CROSS-SECTION HIGH<br />
BETA TOKAMAKS.<br />
The paper presents the first results from Columbia University's high beta tokamak, HBT,<br />
demonstrating the production of plasmas with poloidal beta of the order of the aspect ratio,<br />
/3p ~ R/a = c~'. Results from a theoretical study of equilibrium, stability <strong>and</strong> transport in a<br />
conceptual second regime experiment, SRX, are also presented. Methods to access the second regime<br />
<strong>and</strong> the advantages of large aspect ratio, second regime operation for tokamak fusion reactors are<br />
discussed.<br />
1. Introduction<br />
Conventional tokamak experiments have been limited to levels of volume<br />
average beta, , less than fic = 0.035 /p(MA)/oBpwhich corresponds to the<br />
theoretically predicted onset of external kink instabilities <strong>and</strong> internal ballooning<br />
modes[l,2]. Although it has been shown theoretically that these instabilities<br />
restabilize at higher beta under certain conditions[3-5], no tokamak experiment<br />
has operated in this "second stability" regime. The second regime is characterized<br />
by large values of the poloidal beta, ePp=* 1, <strong>and</strong>, in this paper, we report<br />
experimental <strong>and</strong> theoretical results relevant to these high /3_ plasmas. The<br />
* Work supported by United States Department of Energy, Grants Nos. DE-FG02-86ER53222<br />
<strong>and</strong> DE-FG02-86ER53236, <strong>and</strong> by Grumman Corporation.<br />
1 Present address: Institute for Fusion Studies, Austin, TX, USA.<br />
299
300 NAVRATIL et al.<br />
4<br />
3<br />
2<br />
I<br />
3<br />
I I I l\jl I I I I<br />
IQ_<br />
3 s d<br />
CO<br />
d<br />
ffi<br />
CC<br />
s I—t<br />
03 T-<br />
1<br />
o<br />
1<br />
in<br />
q d<br />
h—h—I<br />
I—d—I<br />
q<br />
(w)z<br />
s<br />
8<br />
I I I •+—I-<br />
q<br />
d<br />
(LU)Z<br />
in<br />
q<br />
d<br />
o<br />
o<br />
CVJ<br />
-q d<br />
9<br />
.8 d<br />
oE<br />
, q<br />
d<br />
O<br />
1<br />
I" a. •«<br />
.2 §<br />
q<br />
"of<br />
-a *"<br />
.9<br />
-S 9 1<br />
in<br />
, q<br />
d<br />
.8 d<br />
I
<strong>IAEA</strong>-CN-47/A-V-4 301<br />
experimental results were observed with the HBT tokamak, <strong>and</strong> they demonstrate<br />
the existence of tokamak equilibrium with ej5p ~ 1 <strong>and</strong> > f5c for as many as<br />
20 Alfven transit times (tA = qRIVA). To explore the physics of high (5p<br />
plasmas more completely, the theoretical work has described tokamak<br />
equilibrium, stability <strong>and</strong> transport for a conceptual second regime experiment<br />
(SRX) sustained with auxiliary heating.<br />
2. HBT Experiment<br />
The HBT experiment is a pulsed, high-beta tokamak replacing the earlier<br />
Torus II device[6]. HBT can produce very high beta plasmas ( < 30%, Bt <<br />
0.4T) by rapidly reversing the toroidal field (reverse bias),or lower beta plasmas<br />
( < 4%, Bt < 0.7T) by rapidly increasing the toroidal field (parallel bias). A<br />
quartz vacuum chamber surrounds the plasma, allowing fast programming<br />
(
302 NAVRATIL et al.<br />
In Eq. (1), the plasma size (/?, a), mass (M), diamagnetism (//,•), current (Ip), <strong>and</strong><br />
the applied vertical field (5V) can be measured as a function of time to determine<br />
the poloidal beta. For the reverse bias case (Fig. la), Eq. (1) gives £/3p=> 0.8<br />
<strong>and</strong>, for the parallel bias case (Fig. lb), ePp~ 0.75. The expected Shafranov<br />
shift for both examples is of the order of A = 0.2a = 0.01m, comparable with<br />
measured shifts. When plasmas with lower /L are produced, nearly concentric<br />
flux surfaces are observed as expected[8].<br />
0<br />
5<br />
_4<br />
CO<br />
CO<br />
0<br />
150<br />
l>100<br />
50<br />
0<br />
31<br />
18 24<br />
rr<br />
"cd<br />
(a) Reverse Bias (b) Parallel Bias<br />
: \<br />
f V":<br />
Shafranov q<br />
Cylindrical q<br />
Plasma Boundary<br />
Magnetic Center<br />
V ^/Inductive ^J^V 3<br />
S < p> = 4%<br />
Plasma Kinetic<br />
17<br />
60 80 100 120 140 160 95 115 135 155 175 195<br />
lisec<br />
FIG. 2. Time evolution of (a) a reverse bias discharge made with 80 mtorr He fill pressure, <strong>and</strong><br />
(b) a parallel bias discharge with 22 mtorr H2 fill pressure, showing the transition from low e@p to<br />
high e/3p. For each discharge, the four plots illustrate: (i) the evolution of e@p <strong>and</strong> (|3)/
<strong>IAEA</strong>-CN-47/A-V-4 303<br />
2.2. Investigation of the transition from low to high ef$p<br />
Eq. (1) can also be used to calculate the time evolution of the discharge<br />
parameters, allowing the investigation of the transition to high epp from low e/L,<br />
as summarized in Fig. 2. For the first example (Fig. 2a), the toroidal field is<br />
reversed at t = 70}isec, inducing several MA of poloidal currents <strong>and</strong> coupling<br />
300J into the plasma. After ionization <strong>and</strong> heating, Wp = 0.37'5PpR\i^p 2 ~ 100J,<br />
~ 4/Jc <strong>and</strong> e(5p ~ 0.5. As the discharge continues, both the inductive stored<br />
energy (Wj = 0.5L/A where L is the plasma's inductance) <strong>and</strong> Wp gradually<br />
decrease, although Wj is observed to decrease more rapidly than Wp,leading to an<br />
increase in epp. After 30|isec, the safety factor, q, has increased to 2 <strong>and</strong> epp has<br />
increased to 1. The poloidal flux contours shown in Fig. la correspond to the<br />
plasma shown in Fig. 2a at t = 95jisec.<br />
Fig. 2b shows the parallel bias example. With this formation method, a<br />
rapid compression of the plasma occurs at the same time as the plasma current is<br />
rapidly increased. Although this method couples less total energy to the plasma<br />
as does reverse bias, by reducing the gas fill pressure <strong>and</strong> substituting H2 for He,<br />
parameters similar to the previous case can be achieved. As shown in the figure,<br />
the initially high current dissipates shortly after formation,raising q from slightly<br />
less than one to more than 2.5. Thereafter, the plasma current <strong>and</strong> energy decay<br />
with a time-constant of =60jasec while maintaining a high beta configuration (ef}p<br />
« 0.8, = 2 fic) for more than 80nsec. With Bt = 0.4T <strong>and</strong> = 2 x<br />
10 21 m" 3 , this corresponds to 20 Alfven transit times.<br />
For both of the examples shown in Fig. 2, the plasma was observed to<br />
evolve without macroscopic instability <strong>and</strong> to terminate when the resistive decay<br />
of the vertical field, Bv, was unable to center the plasma within the vacuum<br />
vessel. Although these experiments establish that high e/L plasmas can be<br />
maintained for times long compared to zA, we do not yet know whether these<br />
equilibria are stable as the plasma's collisionality is reduced. Investigating MHD<br />
stability at higher temperatures <strong>and</strong> reduced collisionality remains a current<br />
research activity of the HBT experiment.<br />
3. Large Aspect Ratio, Second Regime Tokamak<br />
When operating in the second stability regime, a large aspect ratio tokamak<br />
can provide significant advantages for a fusion reactor[9]. With large aspect ratio<br />
<strong>and</strong> circular cross-section, a tokamak can access the second stability regime at<br />
lower than a conventional tokamak. This is seen by examining a simple<br />
estimate of ePp shown in Eq. (2)<br />
p> (2)
304 NAVRATIL et al.<br />
TABLE I. TARGET PARAMETERS FOR THE SRX EXPERIMENT<br />
ePp<br />
=<br />
Q0 =<br />
qa=t<br />
-- 3.68%<br />
1.16<br />
= 4.2<br />
1.01<br />
U<br />
q(Y)'^2.5<br />
Rla = 9<br />
5=0<br />
a = 0.175 m<br />
Paur = 2-3MW<br />
/p = 51.2kA<br />
BT= IT<br />
(£>/a)c n=1 = 0.25-0.3<br />
(b/d)c n = 2 = 0.15-0.2<br />
(Wa)c n =3 = 0.05-0.1<br />
(Z?/a)c n>3 = oo<br />
To minimize the required for second regime access (ePp ~ 1), we should<br />
reduce e, choose a circular cross-section ( K = 1), <strong>and</strong> operate with high q. The<br />
results of equilibrium, stability <strong>and</strong> transport calculations for a second regime<br />
experiment (SRX) based on this concept are described below. In addition,<br />
extensions to the theories describing transition into the second regime from low<br />
beta using either energetic particles or toroidal rotation are discussed.<br />
3.1. Equilibrium <strong>and</strong> Stability Boundaries<br />
Ideal MHD stability analysis has defined the target parameters for the<br />
second stable region of SRX, <strong>and</strong> these are shown in Table I. Low toroidal mode<br />
number, n, ballooning modes, driven by the pressure gradient in the low shear<br />
region, require a close fitting conducting shell, 0.5 < (b/a)c n ~^ < 0.10, for<br />
stability [10]. Here,(6/a) is the shell displacement from the plasma edge<br />
normalized to the plasma radius. Raising the axis shear to balance high <strong>and</strong> low n<br />
internal instabilities would increase the critical wall position. The fact that modes<br />
with n > 1 set the minimum requirement, <strong>and</strong> that (b/a)c is observed to increase<br />
rapidly for all modes when epp > 1, indicate that the pressure gradient rather than<br />
the parallel current is the dominant instability driver.<br />
Current or safety factor, q(y/), programming has been suggested as a<br />
method to improve second region access[10]. We have demonstrated stable<br />
access for all ideal MHD modes in SRX when q0 < 3.1, qa = 4.1, (b/a) > 0.05,<br />
p(\j/) oc ^2.5( ancj q(yfy oe y/ 4.0 Again, stability of the « = 3 mode defines the<br />
minimum wall position as ePp is increased. The minimum wall requirement<br />
applies only in the middle of the unstable region. Restabilization, as described<br />
above, is again observed at higher ePp. Even in the absence of a completely<br />
stable access path, current programming can significantly reduce the ePp required<br />
for second region operation (e.g. epp < 0.7 for q0 „, 2). This technique could<br />
then be used in conjunction with the other mechanisms discussed in Section 3.3.
<strong>IAEA</strong>-CN-47/A-V-4 305<br />
3.2. Transport Modeling <strong>and</strong> Power Requirements<br />
A flux surface averaged transport code[ll] has been used to estimate the<br />
auxiliary heating power necessary to obtain the second regime SRX design point<br />
plasma of Table I with neutral beam injection. The transport model includes<br />
neoclassical coefficients supplemented by a microinstability model of anomalous<br />
diffusion[12]. Similar models have been used to match PBX[13] <strong>and</strong> TFTR[14]<br />
results. Electromagnetic effects (e.g. ballooning modes), which are expected to<br />
play an important role at high , are not included in the present transport<br />
P'<br />
-2.00E+06 -<br />
•1.00E+06<br />
•1.00E + 06<br />
0.00 0.10 0.20 0.30 0.40 0.50 0.60 0.70 0.80 0.90 1.00<br />
0.00 0.10 0.20 0.30 0.40 0.50 0.60 0.70 0.80 0.90 1.00<br />
FIG. 3. Profiles qfp': (a) calculated from a 1.5-D transport code with 5 MW of neutral beam power,<br />
<strong>and</strong> (b) corresponding to the stable second regime design point of Table I.
306 NAVRATIL et al.<br />
model. However, the analysis does provide an estimate of the required power for<br />
an SRX plasma with a stable access path to the second regime. The confinement<br />
times obtained from this code are similar to those predicted by L-mode scaling.<br />
Shown in Fig. 3a is the p' profile generated by the transport code <strong>and</strong> in Fig. 3b<br />
the p' profile for the stable design point equilibrium. The corresponding pressure<br />
profiles for these two cases are nearly identical. Our results suggest that a device<br />
based on the design parameters of Table I can exceed j5c by a substantial factor<br />
(>4) <strong>and</strong> that the target parameters can be achieved with a neutral beam power of<br />
2 to 3 MW.<br />
3.3. Stabilization Mechanisms for Second Regime Access<br />
We have examined <strong>and</strong> extended two proposed stabilization schemes for<br />
transition from the first to the second regime: (1) energetic particle stabilization,<br />
<strong>and</strong> (2) induced toroidal rotation[9]. The original work on energetic particle<br />
stabilization showed that highly energetic particles introduced into the bad<br />
curvature region of a tokamak could improve the stability of the system against<br />
ideal ballooning modes[16]. We have extended this work to include finite aspect<br />
ratio effects in an analytic equilibrium with scalar pressure <strong>and</strong> an anisotropic<br />
energetic particle pressure. Even without aspect ratio corrections, an additional<br />
region of ballooning instability exists beyond the so-called "drift reversal line"<br />
(see Ref. 16). When the energetic particle beta is comparable to the plasma beta,<br />
finite aspect ratio effects can completely remove the original ballooning unstable<br />
region, but the new instability region persists. This may limit the magnitude of<br />
the local p' in a high beta plasma stabilized using this technique.<br />
A WKB theory has been developed for n = °° ballooning modes in an<br />
equilibrium with large rigid toroidal rotation, <strong>and</strong> sufficient conditions for<br />
stability, which extend earlier work[17], have been obtained. For large flow<br />
velocities on the order of Mach 1, a possible stabilization mechanism is provided<br />
by the centrifugal separation of the surfaces of constant mass density <strong>and</strong><br />
pressure. In the central part of the equilibrium, the density gradient caused by the<br />
centrifugal force may offset the destabilizing effects of the pressure gradient.<br />
4. Fusion Reactor <strong>Applications</strong><br />
In order to quantify the differences between a conventional first regime<br />
reactor <strong>and</strong> a large aspect ratio second regime reactor, zero-dimensional<br />
calculations based on a model developed by Uckan <strong>and</strong> Sheffield[18] have been<br />
used to directly compare the two configurations. By limiting the magnetic field at<br />
the toroidal field coil to 12T, limiting the neutron wall loading to 5MW/m 2 , <strong>and</strong><br />
considering "Starfire-sized" reactors with net electrical output of 1.2GW, very<br />
similar operating parameters <strong>and</strong> costs were observed for first regime reactors
<strong>IAEA</strong>-CN-47/A-V-4 307<br />
with elongation <strong>and</strong> triangularity sufficient to raise fic > 6% (K => 2, 8 ~ 0.4) <strong>and</strong><br />
for second regime reactors with large aspect ratios (R/a > 6). However, the large<br />
aspect ratio reactor can operate (1) at half the field strength at the toroidal field<br />
coils, allowing the use of NbTi superconductors, <strong>and</strong> (2) with 16 times less<br />
inductive energy stored in plasma current,reducing the potential for disruptioninduced<br />
damage. The high <strong>and</strong> magnetic field utilization of the large aspect<br />
ratio second regime reactors also permit cost effective compact reactors (with net<br />
electrical output of the order of 300MW) <strong>and</strong> may also make a reasonably sized<br />
tokamak reactor burning advanced fuels feasible. Indeed, by increasing to<br />
30% <strong>and</strong> B, to 10T, 2 £, 4 can increase by a factor of 150 over that needed for<br />
DT fusion. The zero-dimensional reactor model has also been used to estimate<br />
the confinement needed for DT ignition by extrapolating present empirical scaling<br />
laws to high beta <strong>and</strong> large aspect ratio. As in first regime reactors, it is observed<br />
that only a limited subset of these scaling laws predict ignition for reasonably<br />
sized reactors, <strong>and</strong> these have been used to specify the confinement which must<br />
be observed in the conceptual SRX experiment to demonstrate trends leading to<br />
ignition[19].<br />
REFERENCES<br />
[1] BERNARD, L.C., HELTON, F.J., MOORE, R.W., Nucl. Fusion 23 (1983) 1475.<br />
[2] TROYON, F., GRUBER, R., SAURENMANN, H., SEMENZATO, S., SUCCI, S., Plasma<br />
Phys. 26 (1984) 209.<br />
[3] MERCIER, C, in Plasma Physics <strong>and</strong> Controlled <strong>Nuclear</strong> Fusion Research 1978 (Proc. 7th Int.<br />
Conf. Innsbruck, 1978), Vol. 1, <strong>IAEA</strong>, Vienna (1979) 701.<br />
[4] CHANCE, M.S., JARDIN, S.C., STIX, T.H., Phys. Rev. Lett. 51 (1983) 1963.<br />
[5] COPPI, B., CREW, G.B., RAMOS, J.J., Comments Plasma Phys. Controll. Fus. 8 (1983) 11.<br />
[6] CHU, C.K., DENIZ, A., GEORGIOU, G.E., GROSS, R.A., GROSSMANN, A.A., et al.,<br />
Nucl. Fusion 25 (1985) 1109.<br />
[7] HOLLAND, A., NAVRATIL, G.A., Rev. Sci. Instrum. 57 (1986) 1557.<br />
[8] DENIZ, A.V., MARSHALL, T.C., IVERS, T., LI, X., MAUEL, M., Phys. Fluids 29 (1986)<br />
4119.<br />
[9] NAVRATIL, G.A., MARSHALL, T.C., Comments Plasma Phys. Controll. Fus. 10 4 (1986).<br />
[10] TODD, A.M.M., et al., Paper <strong>IAEA</strong>-CN-47/E-III-ll, these Proceedings, Vol. 2.<br />
[11] BATEMAN, G., Proc. International Centre for Theoretical Physics, Trieste, 1985.<br />
[12] TANG, W.M., Rep. PPPL-2311, Plasma Physics Lab., Princeton Univ., NJ (1986).<br />
[13] JARDIN, S.C., et al., Rep. PPPL-2358, Plasma Physics Lab., Princeton Univ., NJ (1986).<br />
[14] REDI, M., Rep. PPPL-2368, Plasma Physics Lab., Princeton Univ., NJ (1986).<br />
[15] KAYE, S.M., GOLDSTON, R.J., Nucl. Fusion 25 (1985) 65.<br />
[16] ROSENBLUTH, M.N., et al., Phys. Rev. Lett. 51 (1983) 1967.<br />
[17] HAMEIRI, E., LAURENCE, P., J. Math. Phys. 25 (1984) 296.<br />
[18] UCKAN, N.A., SHEFFIELD, J., Rep. ORNL/TM-9722, Oak Ridge National Lab. (1985). Also<br />
in Tokamak Startup (KNOEPFEL, H., Ed.), Plenum Press, New York <strong>and</strong> London (1986) 45.<br />
[19] MAUEL, M.E., submitted to <strong>Nuclear</strong> Fusion.
308 NAVRATIL et al.<br />
DISCUSSION<br />
D.C. ROBINSON: In your HBT experiments with €/3p ~ 1, was the discharge<br />
characterized by central q values greater or less than one?<br />
G.A. NAVRATIL: We have produced discharges with central q greater than<br />
one, but for those discussed here the central q was near one.<br />
D.C. ROBINSON: Could I also ask how you account for the absence of strong<br />
MHD instabilities in your plasmas with e/3p ~ 1, given such central q values?<br />
G.A. NAVRATIL: We have computed the stability of equilibria similar to these<br />
<strong>and</strong> expect them to be unstable. Two effects which may reduce the growth rate of<br />
these modes come from the collisional nature of these plasmas <strong>and</strong> the presence of<br />
a conducting halo plasma with finite pressure.
DISRUPTION CONTROL EXPERIMENTS<br />
USING LOCAL MODULAR<br />
MULTIPOLE FIELD COILS<br />
<strong>IAEA</strong>-CN-47/A-V-5<br />
K. YAMAZAKI, K. KAWAHATA, Y. ABE, R. AKIYAMA,<br />
T. AMANO, R. ANDO, Y. HAMADA, S. HIROKURA,<br />
K. IDA, E. KAKO, O. KANEKO, Y. KAWASUMI,<br />
S. KITAGAWA, T. KURODA, K. MASAI, K. MATSUOKA,<br />
A. MOHRI, M. MUGISHIMA, N. NODA, I. OGAWA,<br />
Y. OGAWA, K. OHKUBO, Y. OKA, K. SAKURAI, M. SASAO,<br />
K. SATO, K.N. SATO, S. TANAHASHI, Y. TANIGUCHI,<br />
K. TOI, T. WATARI<br />
Institute of Plasma Physics,<br />
Nagoya University,<br />
Nagoya, Japan<br />
Abstract<br />
DISRUPTION CONTROL EXPERIMENTS USING LOCAL MODULAR MULTIPOLE FIELD<br />
COILS.<br />
In the JIPP T-IIU tokamak, major disruptions have been successfully suppressed by using compact<br />
local sets of I = 3 modular multipole field coils with an m = 3/n = 2 dominant helical component.<br />
It is found that stabilization can be attributed to the excitation of a 'mini-disruption' induced by the 3/2<br />
helical field perturbation before the catastrophic stage that leads to a major disruption. Because of the<br />
quick but mild ergodization of the m = 2/n = 1 magnetic isl<strong>and</strong>s by this mini-disruption, temperature<br />
flattening is impeded <strong>and</strong> a two-step disruption that would lead to disruptive current termination is<br />
avoided. This system is easily applicable to larger tokamaks because of compact coil utilization, slow<br />
pulse application <strong>and</strong> quick stabilization response. It has also been demonstrated that this coil system<br />
can be used for edge plasma control with an ergodic limiter configuration.<br />
1. INTRODUCTION<br />
The usefulness of the superposition of weak external helical field perturbations<br />
on tokamak plasmas for stability studies [1] <strong>and</strong> transport studies [2] has already<br />
been widely recognized. The stabilization of the m = 2/n = 1 isl<strong>and</strong> by an<br />
m = 2/n = 1 resonant helical field (m <strong>and</strong> n are the poloidal <strong>and</strong> toroidal mode<br />
numbers) with gradual current profile modification or fast in-phase feedback schemes<br />
has been demonstrated. Stabilization by a non-resonant helical field has also been<br />
tried with the production of an ergodic region outside the q = 2 surface. In contrast<br />
to these previous experiments, in our experiments we investigated the effect of<br />
ergodization inside <strong>and</strong>/or outside the q = 2 surface. We found a new, quick stabilization<br />
process through excitation of a small disruption ('mini-disruption') induced by<br />
309
310 YAMAZAKI et al.<br />
the helical field. In contrast to a configuration with complicated purely helical coils<br />
or saddle coils, the coil configuration used here is rather compact. With this coil set,<br />
tests of both core ergodization for disruption control <strong>and</strong> edge ergodization for<br />
ergodic limiter experiments have been carried out.<br />
2. HELICAL FIELD CONFIGURATION<br />
Two sets of toroidally localized multipole (I = 3) field coils ('local helical<br />
coils', Fig. l(a)) have been used; they are mounted on two vacuum vessel sectors of<br />
30° at opposite sides of the torus. These coils were installed initially with the aim<br />
of achieving m = 3/n = 1 ergodic limiter configurations [3]. When the coil currents<br />
are driven in the anti-parallel direction, an m = 3/n = 2 helical field with 1/1, 2/2<br />
<strong>and</strong> 4/2 side-b<strong>and</strong> components (A (anti) mode: core ergodization mode) is produced;<br />
when the coil currents are driven in the parallel direction, an m = 3/n = 1 field with<br />
2/1,4/1 <strong>and</strong> 4/3 components (D (dual) mode: edge ergodization mode) is produced<br />
(Fig. l(b».<br />
100<br />
Plasma Vesse|<br />
FIG. 1. (a) Configuration of the local helical coil, (b) Radial field components of the local helical coil<br />
for an A-mode pulse with an m = 3/n = 2 dominant component (Ij = —I2), <strong>and</strong> for a D-rnode pulse<br />
with an m = 3/n — 1 dominant component (1/ = I2), with Ihe[ = 75 hi.
<strong>IAEA</strong>-CN-47/A-V-5 311<br />
The JIPP T-IIU machine (R = 91 cm, a = 24 cm) was operated at<br />
IT < Bt s 3 T <strong>and</strong> 100 kA < I,, =s 300 kA. The applied 3/2 radial perturbation<br />
field strength at the plasma surface, Br3/2(a), is about 30 G at a maximum helical<br />
coil current Ihe, of 15 kA (Fig. l(b), left). The ratio of this perturbation field to the<br />
poloidal field of the plasma current, Br3/2(a)/B^(a), is about 1.0-1.5%.<br />
3. DISRUPTION CONTROL EXPERIMENTS:<br />
Pulse application to unstable discharges<br />
The changes in MHD activity during pulse application are measured mainly by<br />
single, 10- <strong>and</strong> 20-channel Mirnov coil poloidal arrays, a 10-channel grating polychromator<br />
receiving second harmonic electron cyclotron emission (ECE), <strong>and</strong> a<br />
7-channel soft-X-ray (SXR) pin diode poloidal array.<br />
The typical discharge waveforms with <strong>and</strong> without pulse application to the<br />
mildly unstable discharges are shown in Fig. 2. Figure 3 is a plot of the time variations<br />
of the electron temperature profile T^ 5 (r), before pulse application, without a<br />
pulse <strong>and</strong> with a pulse; third-order spline-fitting curves are used; the current profile<br />
j(r) can be roughly estimated from the electron temperature profile (j(r) oc T|- 5 (r)).<br />
Without pulse application (Fig. 2(a)) the plasma current (q^ « 3.2-3.4 <strong>and</strong><br />
ne « 2 x 10" 13 cm- 3 ) is terminated by a few pre-disruptions <strong>and</strong> by the subsequent<br />
major disruption. In this case, the discharge proceeds with successive phenomena<br />
characterized by the stages of initial 'precursor oscillation', 'soft mode locking',<br />
'pre-disruptions', 'major disruption' <strong>and</strong> 'current quench' (Fig. 2(a)). The peaked<br />
electron temperature profile at t = 90 ms is changed to the flattened profile near the<br />
centre by the onset of precursor oscillations (Fig. 3(a)). During the precursor oscillation<br />
phase, the strong 2/1-mode toroidal 'co'-rotation (rotation in the plasma current<br />
direction) gradually comes to a st<strong>and</strong>still <strong>and</strong> then leads to the pre-disruption.<br />
According to the magnetics, SXR <strong>and</strong> ECE temperature fluctuation measurements,<br />
a pure m = 2/n = 1 mode (R « 100 cm) accompanied by 1/1 deformation<br />
(R « 88 cm) grows, <strong>and</strong> an m = 1/n = 1 isl<strong>and</strong> quickly develops with double mode<br />
frequency on this 1/1-deformed surface just before the pre-disruption. The ECE temperature<br />
decay during the pre-disruption is initiated mainly near the q = 2 surface<br />
as a result of 2/1-1/1 interaction, as predicted by theory [4]. The isl<strong>and</strong> width of the<br />
2/1 mode is not reduced by this pre-disruption <strong>and</strong> finally the plasma current is terminated<br />
through the two-step disruption process. Although the T]- 5 (r) profile does not<br />
correspond exactly to the the j(r) profile, it is suggested from the flat profile<br />
(Fig. 3(b)) that the central qg before the major disruption in the case without a pulse<br />
is larger than 1.3 [5]; this is consistent with the theoretical prediction of 'bubble'<br />
formation [6].<br />
When an A-mode pulse (m = 3/n = 2 dominant) is applied during the unstable<br />
period (Fig. 2(b)), the m = 2 mode toroidal rotation gradually comes to an end <strong>and</strong>
312 YAMAZAKI et al.<br />
> ><br />
8<br />
>*<br />
}<br />
JD1.<br />
-i-<br />
•of
116.5<br />
<strong>IAEA</strong>-CN-47/A-V-5 313<br />
(a)<br />
0.7 0.9 1 i<br />
R(m)<br />
(Te(keV)]' /<br />
1.5 '<br />
FIG. 3. Time evolution of the one-half power of the electron temperature profile T'e- 5 : (a) before pulse<br />
application (t < -100 ms), (b) without a pulse (t > -100 ms) <strong>and</strong> (c) during an A-mode pulse<br />
(t > -100 ms).<br />
is finally more tightly locked in phase than it is without pulse application. A minidisruption<br />
is excited before the above-mentioned pre-disruption in the case without<br />
a pulse; this mini-disruption is characterized by a mild <strong>and</strong> global change in the<br />
plasma profile. The 2/1 magnetic isl<strong>and</strong> disappears in this mini-disruption stage,<br />
whereas it did not disappear in the pre-disruption stage when no pulse was applied.
314 YAMAZAKI et al.<br />
After one or two mini-disruptions the plasma current channel becomes more peaked<br />
than in the case without a helical pulse, which often leads to the occurrence of small<br />
sawtooth oscillations. In contrast to the situation existing in the case without a pulse,<br />
the profile after the mini-disruption induced by the A-mode pulse remains almost<br />
constant, except just during pre-disruption, <strong>and</strong> does not change to the flat profile<br />
(Fig. 3(c)). This quick rearrangement of the magnetic configuration due to the<br />
favourable mini-disruption helps avoid disruptive current terminations.<br />
The D-mode pulse (m = 3/n = 1 dominant), however, is not effective in<br />
suppressing major disruptions <strong>and</strong> sometimes the discharge is destabilized. This may<br />
be due to the fact that the 3/1-dominant field does not directly affect the 2/1-1/1 interaction<br />
<strong>and</strong> that it causes undesirable disturbances on the q = 3 surface or the plasma<br />
edge surface.<br />
8<br />
4<br />
0<br />
240<br />
120 r<br />
a.u.<br />
Ip(kA)<br />
Te«ntre(au)<br />
f<br />
100<br />
time (ms)<br />
100 150<br />
time(ms)<br />
4<br />
2<br />
2 00<br />
200<br />
FIG. 4. Ergodic limiter experiments with application of a D-mode pulse.
4. ERGODIC LIMITER EXPERIMENTS:<br />
Pulse application to stable discharges<br />
<strong>IAEA</strong>-CN-47/A-V-5 315<br />
Helical magnetic field perturbations are also applied to stable discharges with<br />
q^ ~ 3-4 in order to clarify the effect of ergodization on the transport process.<br />
When a D-mode pulse is applied, a hard-X-ray burst due to loss of runaway electrons,<br />
a decrease of the C-IV, C-V, O-V <strong>and</strong> Fe-IX line intensities, <strong>and</strong> a decay of edge<br />
ECE temperature are observed, with a time delay At! after pulse application (see<br />
Fig. 4). Ergodization of the edge confinement region <strong>and</strong> a resultant favourable effect<br />
of impurity influx suppression in the time interval Atj are suggested. The quick<br />
onset <strong>and</strong> duration of this ergodization depend on the pulse height <strong>and</strong> the width of<br />
the helical perturbations, which suggests the existence of an ergodization threshold.<br />
On the other h<strong>and</strong>, an A-mode pulse does not significantly influence the stable<br />
discharges, even with a maximum coil current of 15 kA.<br />
5. CONCLUSIONS<br />
In the JIPP T-IIU tokamak experiment it has been demonstrated that the<br />
m = 3/n = 2 dominant helical field perturbation produced by toroidally localized<br />
multipole field coils induces one or two mini-disruptions in the tokamak plasma <strong>and</strong><br />
that the 2/1 magnetic isl<strong>and</strong> is ergodized by this mini-disruption. Temperature flattening<br />
is interrupted <strong>and</strong> two-step disruption is avoided. With this scenario, a compact<br />
local helical coil system producing 'dirty' spectral field components is used instead<br />
of complicated purely toroidal helical coils. This may be acceptable in a large tokamak<br />
because it reduces the probability of disruptive current terminations through<br />
slow feedback.<br />
Also, preliminary ergodic magnetic limiter experiments have been carried out<br />
using the local helical coil system with an m = 3/n = 1 dominant helical component.<br />
The favourable effect of edge ergodization on the edge temperature drop has been<br />
confirmed <strong>and</strong> the effectiveness of this coil configuration for transport <strong>and</strong> stability<br />
control verified.<br />
REFERENCES<br />
[1] KARGER, F., WOBIG, H., CORTI, S., et al., in Plasma Physics <strong>and</strong> Controlled <strong>Nuclear</strong> Fusion<br />
Research 1974 (Proc. 5th Int. Conf. Tokyo, 1974), Vol. 1, <strong>IAEA</strong>, Vienna (1975) 207.<br />
[2] OHYABU, N., et al., Nucl. Fusion 25 (1985) 1684.<br />
[3] KAWAMURA, T., et al., J. Nucl. Mater. 111&112 (1982) 268.<br />
[4] TURNER, M.F., WESSON, J.A., Nucl. Fusion 22 (1982) 1069.<br />
[5] YAMAZAKI, K., et al., Quick Profile Reorganization Driven by Helical Field Perturbation for<br />
Suppressing Tokamak Major Disruptions, Res. Rep. IPPJ-796, Inst. of Plasma Physics, Nagoya<br />
Univ. (1986).<br />
[6] KLEVA, R.G., et al., Phys. Fluids 29 (1986) 457.
316 YAMAZAKI et al.<br />
DISCUSSION<br />
K. McGUIRE: In your A-mode type stabilization of the major disruption, could<br />
you improve the density limit or the low q^ limit?<br />
K. YAMAZAKI: No, we have not yet managed to extend the operating region.<br />
The density limit was somewhat improved, but not substantially. The reason why the<br />
present system was not effective is that in the case of low qyhigh density the growth<br />
of the MHD mode is too fast to be controlled by the present slow pulse coil system<br />
outside the vacuum vessel. Another reason might be that the disruption mechanism<br />
for low q/high density is different from the 2/1 - 1/1 interaction of mildly unstable<br />
medium q <strong>and</strong> medium density discharges. However, we are still trying to improve<br />
the operational regime by using the present 'mini-disruption' scheme with other helical<br />
field components.<br />
D.C. ROBINSON: I noticed that your A-mode coil configuration (m = 3,<br />
n = 2) had a significant m = 1, n = 1 component. Did you observe any significant<br />
effect of this coil configuration on sawtooth activity?<br />
K. YAMAZAKI: We applied the A- <strong>and</strong> D-mode helical pulses to stable OH<br />
<strong>and</strong> ICRF heated discharges with sawteeth, but did not observe any significant<br />
changes in sawtooth behaviour. We think the m = 1/n = 1 component is still too<br />
small to modify the sawtooth activity. We plan, however, to add new coils <strong>and</strong> to<br />
perform further sawtooth stabilization experiments.
STUDIES OF MHD MODES<br />
AND HIGH FREQUENCY FLUCTUATIONS<br />
ON THE HT-6B AND HT-6M TOKAMAKS<br />
Jikang XIE, Jiayu CHEN, Wenkang GUO, Yuping HUO,<br />
HT-6B GROUP, HT-6M GROUP<br />
Institute of Plasma Physics,<br />
Academia Sinica,<br />
Hefei, Anhui, China<br />
Abstract<br />
<strong>IAEA</strong>-CN-47/A-V-6<br />
STUDIES OF MHD MODES AND HIGH FREQUENCY FLUCTUATIONS ON THE HT-6B AND<br />
HT-6M TOKAMAKS.<br />
Detailed studies of MHD modes have been performed on the HT-6B tokamak by means of weak<br />
resonant helical fields (RHFs). The experimental results show that the MHD behaviour cannot be<br />
explained by the current tearing mode theory. A very interesting point is that a weak RHF (about 0.5%<br />
of Bp) could significantly influence sawtooth processes <strong>and</strong> thereby change the global thermal properties<br />
of the plasma. A series of voltage pulses were applied to HT-6M plasma. The investigations<br />
included low frequency MHD modes, high frequency magnetic fluctuations, Ho line emission <strong>and</strong> ECE<br />
signals. High frequency fluctuations have been suppressed by the voltage pulses.<br />
1. INTRODUCTION<br />
Plasma parameters for conditions close to ignition have already been achieved<br />
in tokamaks. However, there are still many important processes of the plasma besides<br />
transport which are not yet clear. There are many reports on high frequency fluctuations,<br />
but no conclusion has been reached as to their physical origin, their relation<br />
with other plasma processes <strong>and</strong> the way of control. Low frequency MHD perturbations,<br />
which are directly related with plasma disruptions <strong>and</strong> which have an influence<br />
on the global thermal properties of the plasma, have long been regarded as tearing<br />
modes [1]. Recently, this theory has been questioned because of some experimental<br />
results [2]. It seems necessary to find a new explanation, also for sawtooth processes.<br />
Therefore, a careful study of such processes is certainly of value for the further<br />
development of tokamaks.<br />
To obtain more information <strong>and</strong> to investigate different aspects of MHD modes<br />
<strong>and</strong> high frequency fluctuations, we studied the changes of these modes under the<br />
influence of external disturbances [3, 4]. When I = 2 <strong>and</strong> ( = 3 weak resonant<br />
helical fields (RHFs) were used as active magnetic probes, many new phenomena<br />
could be observed; these seem to give a physical picture for the low frequency modes<br />
which is totally different from the usual one. Also, when skin current pulses were<br />
applied, some new properties of high frequency fluctuations were found.<br />
317
318 XIE et al.<br />
The HT-6B is an air-core transformer tokamak with i = 2 <strong>and</strong> i = 3 windings<br />
on its vacuum chamber. The operational parameters are: R = 45 cm, a = 12.5 cm,<br />
B, = 6-8 kG, Ip < 40 kA, n,. = (0.7-3) x 10 13 cm " 3<br />
= 150-250 eV,<br />
Zeff < 2. The diagnostics of HT-6B are nearly all conventional, including<br />
multichannel soft-X-ray fluctuation measurements, multichannel spectroscopy, fivechannel<br />
ECE, cos m$ coils <strong>and</strong> more than twenty magnetic probes.<br />
The HT-6M is a new air-core transformer tokamak with the following<br />
parameters: R = 65 cm; a = 20 cm; B, = 15 kG, Ip < 120 kA, Zeff = 1.5-2.5,<br />
Te = 400-700 eV, ii,, = (0.9-2) x 10 13 cm" 3 . It is equipped with I = 3 helical<br />
windings <strong>and</strong> a second Ohmic heating winding just outside the vacuum chamber.<br />
2. MHD MODE STUDIES WITH A RESONANT HELICAL FIELD<br />
The helical windings on HT-6B can produce steady or pulsed RHFs with a<br />
magnitude of 0.5-5% of Bp. Without an RHF we observed all the typical MHD<br />
phenomena which appear also on other devices. The main results of experiments with<br />
RHFs are as follows:<br />
(a) The fact that different n,m modes always have the same frequency has long<br />
been observed on all tokamaks including the HT-6B. Normally, this is explained by<br />
the rotation of the magnetic isl<strong>and</strong>s which can be observed by the phase shifts of<br />
signals of Mirnov probes located at different poloidal positions. On HT-6B, the rotation<br />
of the magnetic isl<strong>and</strong> was stopped by a weak RHF, as shown in Fig. 1; the RHF<br />
was turned on at 6 ms <strong>and</strong> turned off at 12 ms. In some cases, non-rotating Mirnov<br />
signals or signals without any phase relation were observed even without an RHF.<br />
Obviously, this means that the frequency (about 20 kHz on HT-6B) is not entirely<br />
due to magnetic isl<strong>and</strong> rotation.<br />
(b) I T I<br />
FIG. 1. Phase shifts on adjacent Mimov probes,<br />
(a) without RHF <strong>and</strong> (b) with RHF.
<strong>IAEA</strong>-CN-47/A-V-6 319<br />
FIG. 2. Suppression of m = 2,3,4,5 modes, <strong>and</strong> enhancement of sawteeth<br />
on soft-X-ray <strong>and</strong> ECE signals by an I = 3 RHF.<br />
FIG. 3. Changes ofm—2 <strong>and</strong> m = 3 modes, soft-X-ray signals<br />
<strong>and</strong> ECE signals when ant-2 RHF is turned on.<br />
(b) The weak I = 3 RHF of about 1% Bp(a) can suppress all m = 2,3,4<br />
modes effectively when q(a) > 3 (Fig. 2). Oscillations of the same frequency in soft-<br />
X-ray <strong>and</strong> spectroscopic signals are also suppressed. In the case of a weak<br />
( = 2 RHF with q(a) > 2.5 the same phenomena could be observed (Fig. 3). It<br />
should be emphasized that our RHFs were rather weak so that only the magnetic<br />
structure close to the corresponding resonance surface could be changed. This local<br />
-I
320 XIEetal.<br />
ty^js\_/\y\>^^<br />
J=3 RHF on 400us<br />
FIG. 4. Reduction <strong>and</strong> relaxation of sawteeth on soft-X-ray signals<br />
to 20 kHz Mimov oscillations when the RHF is turned off.<br />
Weak J=3 RHF on<br />
FIG. 5. Application of a strong 1 = 2 RHF to an t = 3 stabilized plasma,<br />
causing a new mode on cos m6 coil signals.<br />
resonant interaction of the RHF with the plasma has been proven by two facts:<br />
(1) when the direction of the toroidal magnetic field was reversed, the weak helical<br />
field could not influence the plasma fluctuations; <strong>and</strong> (2) in the case of q(a) < 3,<br />
the I = 3 helical current could not suppress the MHD modes. Since the magnetic<br />
isl<strong>and</strong>s of different m-modes did not overlap in our experiments, it is difficult to<br />
explain why such localized disturbances could suppress the m = 2,3,4,5 modes,<br />
each of which is concentrated only near the corresponding resonant surface according<br />
to tearing mode theory.<br />
(c) The sawtooth oscillations which appeared on HT-6B in soft-X-ray signals,<br />
ECE signals <strong>and</strong>, in some cases, even in magnetic signals, were dramatically<br />
modified by a weak RHF. Mostly, an RHF (I = 3 or I = 2) increased the sawtooth
<strong>IAEA</strong>-CN-47/A-V-6 321<br />
amplitude <strong>and</strong> prolonged the repetition period, as shown in Fig. 2. The ECE signals<br />
showed an increment of the central electron temperature. In extreme cases, an RHF<br />
moved the inverse surface of a sawtooth (q = 1 surface) outwards, <strong>and</strong> the sawtooth<br />
oscillation appeared even in the soft-X-ray signal of the edge chord. In some<br />
discharge regimes without an RHF there was no sawtooth oscillation, only a 20 kHz<br />
fluctuation in the soft-X-ray signals. After the weak RHF was turned off, the large<br />
amplitude sawteeth disappeared with a 1 ms delay (see Fig. 4). All these facts seem<br />
to indicate that the very localized changes of the magnetic structure caused by a weak<br />
RHF could bring about a strong resonant change of the energy process of the plasma,<br />
especially in the inner part.<br />
(d) A relatively strong ( = 2 RHF in some cases increased the 20 kHz oscillation<br />
<strong>and</strong> suppressed sawteeth, but did not disrupt the discharge. When the I = 2 RHF<br />
was larger than 2% Bp(a), the discharge deteriorated immediately. An experiment<br />
was performed in which two RHFs (I = 2 <strong>and</strong> ( = 3) were combined. The MHD<br />
fluctuations were stabilized by a suitable I = 3 RHF; in this way the discharge could<br />
be prevented from suddenly turning on a strong I = 2 RHF, as shown in Fig. 5.<br />
When the I = 2 RHF was turned on, there were suddenly more m = 2 <strong>and</strong> m = 4<br />
perturbations, but the t = 3 mode remained stable.<br />
(e) Similar effects on RHFs have also been observed on the HT-6M tokamak.<br />
3. SKIN CURRENT PULSE EXPERIMENTS ON HT-6M<br />
In an attempt to change the edge conditions, four voltage pulses (V-pulses),<br />
0.2-1 ms wide, with 10-100 V loop voltage, were applied to the plasma during the<br />
discharges via the second Ohmic heating winding. Pulse currents, Ip, of up to 15 kA<br />
(20% of Ip) were induced in the co-direction <strong>and</strong> the counter-direction with regard<br />
to Ip (Fig. 6). Some of the preliminary results are as follows:<br />
(a) The amplitudes of the m = 2,3,4,5 MHD modes did not change much<br />
during the pulse process with Ip up to 15% of Ip (Fig. 7). When Ip was slightly<br />
larger than 15% Ip, the amplitudes of the m = 2 mode were enlarged, but those of<br />
the m = 3 mode were not enlarged. Usually, the discharge was interrupted immediately<br />
after a fast rise of the m = 2 mode amplitude, with Ip more than 20% of Ip.<br />
It was found that the instant of the enhancement of the m = 2 mode or the low<br />
frequency magnetic oscillation Br (see below) was at the set-up of a positive electric<br />
field of the V-pulse, i.e. in the direction of Ip.<br />
(b) A broad-b<strong>and</strong> high frequency magnetic fluctuation was observed by a small<br />
Br coil close to the edge of the plasma. The amplitude of this fluctuation was<br />
Br/Bp(a) = 10~ 5 to 10 " 4 . In many cases there was a large component of about<br />
250 kHz. Suppression of these fluctuations by a V-pulse was observed (Fig. 8). After<br />
the V-pulse was switched on, the high frequency fluctuation Br gradually disappeared,<br />
but a low frequency (about 10 kHz) magnetic oscillation began to grow;
322 XIE et al.<br />
FIG. 6. Discharge with V-pulse, plasma current Ip (20.4 kA/div.), loop voltage VL (6.26 V/div.),<br />
position of plasma Dh (10.5 kA-cm/div.) <strong>and</strong> electron density Ne (3.5 x IO 12 cm~ 3 /div.).<br />
The dashed line denotes the position of the plasma without a V-pulse, time 3.84 ms/div.<br />
4b<br />
—•<br />
J1*<br />
r<br />
m=2<br />
*»• •4-r<br />
m=3<br />
m=4<br />
m=5<br />
4*<br />
•«••<br />
FIG. 7. Waveforms of the m = 2,3,4,5 MHD modes<br />
during a V-pulse, time 200 fis/div.<br />
m=2<br />
••*<br />
HFM<br />
•ill<br />
I<br />
i<br />
f<br />
k III<br />
1<br />
it l! M*<<br />
/7G. 8. Waveforms of the m = 2 MHD mode am* //je WgA frequency<br />
magnetic fluctuation (HFM) during a V-pulse, time 200 jisldiv.
<strong>IAEA</strong>-CN-47/A-V-6 323<br />
this was not correlated with the MHD modes mentioned before. The amplitude of this<br />
oscillation increased with increasing voltage.<br />
(c) The horizontal displacement of the plasma underwent a shift during the<br />
pulse processes <strong>and</strong> did not recover after the V-pulse had passed by (Fig. 6). The<br />
delay of the shift may be related to the slight change in the profile of the plasma<br />
current density.<br />
It was found that the Ha line emission from the edge as well as the line density<br />
of the plasma did not increase during the V-pulse process. The edge heating effect<br />
was observed by ECE measurements.<br />
4. DISCUSSION<br />
Low frequency MHD oscillations are very complicated phenomena which<br />
depend sensitively on the discharge conditions, such as electron density, impurities<br />
<strong>and</strong> wall conditions. Also, the discharge conditions have an influence on the<br />
effectiveness of the RHF. Although the experimental RHF results discussed above<br />
can only be reproduced in some discharge regimes, they show that the observed<br />
'MHD oscillations' cannot be properly explained by the tearing mode theory;<br />
however, they give some clues to finding the mode structures.<br />
Our experimental RHF results can be partly explained by assuming that the<br />
observed mode was a single mode which extended through the whole plasma. From<br />
a recent study of profile consistency it became clear that the RHF strongly influences<br />
sawtooth processes through this mode.<br />
Our skin current experiments also showed the complexity of the low frequency<br />
magnetic fluctuations. We still do not know the real nature of the observed 10 kHz<br />
mode, but it is obvious that the high frequency fluctuation is of electromagnetic<br />
origin.<br />
REFERENCES<br />
[1] WHITE, R.B., MONTICELLO, D.A., ROSENBLUTH, M.N., WADDELL, B.V., in Plasma<br />
Physics <strong>and</strong> Controlled <strong>Nuclear</strong> Fusion Research 1976 (Proc. 6th Int. Conf. Berchtesgaden,<br />
1976), Vol. 1, <strong>IAEA</strong>, Vienna (1977) 569.<br />
[2] CAMPBELL, D.J., GILL, R.D., GOWERS, C.W., et al., Sawtooth Activity in Ohmically<br />
Heated JET Plasmas, Rep. JET-P(86)05, JET Joint Undertaking, Abingdon, Oxfordshire (1986).<br />
[3] ZHAO, Quingchu, CHEN, Jiayu, XIE, Jikang, et al., in Plasma Physics <strong>and</strong> Controlled <strong>Nuclear</strong><br />
Fusion Research 1984 (Proc. 10th Int. Conf. London, 1984), Vol. 1, <strong>IAEA</strong>, Vienna (1985) 345.<br />
[4] HT-6B GROUP, Paper ASIPP/11, presented at 12th Europ. Conf. on Controlled Fusion <strong>and</strong><br />
Plasma Physics, Budapest, 1985.
<strong>IAEA</strong>-CN-47/A-VI-l-l<br />
ANOMALOUS TRANSPORT IN JET PLASMAS<br />
D.F. DUCHS, T.E. STRINGER, A. TARONI, M. BRUSATI,<br />
N.A. GOTTARDI, T. HELLSTEN, F. TIBONE<br />
JET Joint Undertaking,<br />
Abingdon, Oxfordshire,<br />
United Kingdom<br />
Abstract<br />
ANOMALOUS TRANSPORT IN JET PLASMAS.<br />
Local thermal fluxes have been determined experimentally for ohmic, RF wave <strong>and</strong> neutral beam<br />
heated JET plasmas through direct power balance calculations <strong>and</strong> through a modified application of<br />
'predictive' equilibrium transport codes. A realistic way of describing the RF power deposition profile<br />
has been developed. Free-boundary plasmas, important for magnetic limiter cases in JET, can now be<br />
computed fully self-consistently. The experimental local fluxes have been compared with available<br />
analytically derived fluxes, but no acceptable agreement could be found. Many discharges can,<br />
however, be modelled empirically by modifying the electron thermal transport equation so that the<br />
steady state Te profile is constrained to fit the observed canonical shape, with both ohmic <strong>and</strong><br />
additional heat sources.<br />
1. INTRODUCTION<br />
In this paper we attempt to assess the status of theoretical<br />
underst<strong>and</strong>ing of anomalous transport in JET plasmas. This is<br />
done by deriving local fluxes from measurements <strong>and</strong> comparing<br />
them with presently available theoretical ones which are<br />
applicable under JET conditions. Sections 2 <strong>and</strong> 3 present the<br />
experimental values which are obtained firstly by the usual<br />
method of the integrated power balance <strong>and</strong> secondly by applying<br />
a full predictive transport code in steady state. The chosen<br />
cases include JET discharges where the plasma is heated<br />
ohmically, by ion cyclotron waves, <strong>and</strong> by neutral injection.<br />
Those discharges have been selected where a maximum number of<br />
diagnostics were available with reliable results so that the<br />
uncertainties on the fluxes could be minimised. In Section H, a<br />
number of proposed theoretical formulae are reviewed <strong>and</strong> checked<br />
against JET data. Finally, in Section 5, an empirical approach is<br />
outlined by which also the plasma evolution in time is modelled<br />
successfully. The highlights are summarised in Section 6.<br />
2. FLUXES FROM INTEGRATED POWER BALANCE<br />
If V. denotes the volume inside a chosen magnetic flux<br />
surface S., we define the average primary electron thermal energy<br />
flux density at time point t as<br />
fUt) = i<br />
325
326 DUCHS et al.<br />
consisting of a convective <strong>and</strong> a conductive term. We prefer this<br />
quantity fe rather than xe ( or Xp because it is closer to the<br />
actual measurements <strong>and</strong> avoids special assumptions <strong>and</strong> errors<br />
connected with local gradients. The flux is calculated as a<br />
function of i^ from the power balance<br />
fe(i|>,t) =1 |- i_ / i ne Te dV<br />
dV - / na _H—I dV<br />
PRF dv + ; PNBI dV} (2)<br />
An analogous equation holds for f^^.t). Additional possible<br />
terms (e.g. ionisation, adiabatic compression, etc.) were<br />
estimated as negligible. The geometry, i.e. ty, S^ <strong>and</strong> V.,are<br />
taken from solutions of the Grad-Schltlter-Shafranov equation<br />
which agree with outside magnetic probe measurements. These<br />
solutions also provide the ohmic heating term. The bolometer<br />
array signals deliver the radiation loss term after the charge<br />
exchange neutral share is computed <strong>and</strong> subtracted.<br />
Only the electron part of the ion cyclotron heating in the<br />
central region can be estimated experimentally. Therefore, the<br />
total deposition profile is calculated using the global wave code<br />
LION [i]. This code calculates wave propagation for the<br />
magnetosonic wave in toroidal geometry, assuming the plasma<br />
species to be Maxwellian. In the case of on-axis heating of<br />
hydrogen minority at its fundamental cyclotron resonance, the<br />
distortion of the velocity distribution of the heated minority<br />
ions becomes strong [2]. At low density, the heating of the<br />
minority species outside the central region is still high enough<br />
to produce strong Doppler broadening of the resonance, which<br />
broadens the power deposition. The power transfer to the<br />
electrons <strong>and</strong> ions from that absorbed by the minority ions is<br />
calculated with the Fokker-Planck code BAFIC [2]. Direct<br />
electron heating has been neglected. The power deposition on the<br />
electrons is then checked against measurements, <strong>and</strong> generally<br />
good agreement is found. At high temperatures, significant ion<br />
heating occurs,due to second harmonic absorption by the<br />
deuterons.<br />
Also the power deposition from neutral beams cannot be<br />
measured directly <strong>and</strong> has been computed by Monte-Carlo or pencil<br />
beam codes, with the total power, temperature <strong>and</strong> density<br />
profiles, <strong>and</strong> Zg^ as measured input [3]. A major source of<br />
uncertainty is the ion temperature profile which we took from the<br />
neutral particle analyser diagnostics [i] when available.<br />
These profiles suffice to determine the remaining terms in<br />
eq. (2) if the equilibration (te ) is assumed to be classical.
-1.5<br />
<strong>IAEA</strong>-CN-47/A-VI-l-l 327<br />
• 2 - 4 .6 .8 1 r [m] 1.4 o .2 .4 .6 .8 1 1.4<br />
FIG. 1. Local power balance (integrals over magnetic flux surface volume inside r) for a JET pulse<br />
during (a) ohmic heating <strong>and</strong> (b) RF heating. Ip = 2 MA, B, = 2.2 T, H minority (nH/nD -2%)<br />
heating in (b).<br />
Figure 1 shows the individual terms of eq. (2) for an<br />
ohmically (la) <strong>and</strong> an RF heated (1b) JET plasma. The average<br />
minor radius r is used here as a flux surface label, i.e. it<br />
specifies S. <strong>and</strong> V.. The integrated ohmic input power is denoted<br />
by P«, the RF input by P^p. the power exchanged between electrons<br />
<strong>and</strong> ions by Pe^, the radiation loss by Pracj» <strong>and</strong> the temporal<br />
change in thermal (electron) energy content by £ . The result of<br />
the balance is Fg = fg'S..<br />
These cases have been chosen because Fg is a significant<br />
term (i.e. not only a difference of large numbers) over the whole<br />
cross-section.<br />
In order to set off the difference between ohmic <strong>and</strong><br />
additionally heated plasmas, the figures 1 to 3 refer to two<br />
different time slices of the same discharge with a total plasma<br />
current I = 2 MA <strong>and</strong> a toroidal field (on axis) of 2.2 T.<br />
Figure 2 presents a typical result obtained through the<br />
above procedure for the ohmic case. Figure 2a shows the measured<br />
plasma characteristics, i.e. density, temperature <strong>and</strong> q-profiles,<br />
while the local mean thermal fluxes are given in Fig. 2b. The<br />
same quantities for a neutral beam heated case are shown in<br />
Fig. 1.<br />
The error margin for these fluxes is assessed by varying the<br />
terms in eq. (2) within the experimental errors.
328<br />
2.5<br />
2.0<br />
DUCHS et al.<br />
rum<br />
FIG. 2. (a) Plasma parameter profiles, <strong>and</strong> (b) measured surface averaged thermal fluxes ffor electrons<br />
<strong>and</strong> ions, for the ohmically heated JET plasma (Fig. I (a)). Theoretical results for the dissipative trapped<br />
electron mode (DTEM), scaled down by a factor of 50, <strong>and</strong> for the ion temperature gradient (1TG)<br />
instability, scaled down by a factor of 50, are also shown.<br />
0 .2 .4 .6 .8 1 r[m] 1.4 0 .2 .4 .6 .8 1<br />
FIG. 3. (a) Plasma parameter profiles for an RF heated JETplasma, <strong>and</strong> (b) surface averaged thermal<br />
fluxes fas derived (Section 3) for electrons <strong>and</strong> ions. The uncertainty off is enhanced within the sawtooth<br />
region (dashed curves). The electron heat fluxes predicted for the dissipative trapped electron mode<br />
(DTEM) <strong>and</strong> the microtearing (MT) mode are also shown.
-'.<br />
<strong>IAEA</strong>-CN-47/A-VI-l-l 329<br />
JfA<br />
1
330 DUCHSetal.<br />
3. FLUXES FROM EQUILIBRIUM/TRANSPORT CODES IN STEAD? STATE<br />
Our second method to obtain measured fluxes uses a full<br />
equilibrium/transport code (in i|>(R,Z),t) containing more detailed<br />
physics. For example, this code has been restructured to allow<br />
fully consistent free-boundary equilibrium transport calculations.<br />
The mathematical methods have been published recently [5]. The<br />
code interacts with the external coils, which is especially<br />
important for magnetic limiter cases in JET. In the interpretative<br />
application it is, of course, used to reproduce the<br />
measured magnetic (probe, loop) signals, thus checking whether<br />
the equilibria are consistent with (transport) pressure <strong>and</strong><br />
current density profiles. In addition, it contains detailed<br />
modelling of impurity diffusion <strong>and</strong> radiation, neutral atom<br />
distributions, the sawtooth region, <strong>and</strong> boundary conditions.<br />
The present method of application is as follows: The<br />
measured basic plasma parameters (densities, temperatures,<br />
fields) are inserted as initial values. The measured complex<br />
quantities, such as radiation losses, neutron yields, charge<br />
exchange neutrals, are examined immediately through the models<br />
for their consistency with the basic parameters; this leads<br />
either to corrections or to an assessment of error bars. In the<br />
spirit of "shooting methods" an ansatz for the desired fluxes is<br />
guessed <strong>and</strong> programmed; for example, the result of the previous<br />
(cruder) power balance method could be chosen, or any function of<br />
the basic parameters <strong>and</strong> their derivatives. The code is then<br />
stepped forward in time, <strong>and</strong>, in stationary state, must reproduce<br />
the input initial value profiles, provided that our ansatz for<br />
the fluxes was suitable, otherwise it is to be modified. This<br />
method lends itself readily to sensitivity studies by determining<br />
those terms which predominantly cause deviation from steady<br />
state.<br />
The method can, of course, also be applied to non-stationary<br />
conditions, except that then several sets of measurements at<br />
consecutive time slices are required.<br />
Figure 3 presents the fluxes for an RF-heated JET plasma<br />
evaluated by this method.<br />
We have analysed many other cases which are being collected,<br />
with some attempts at "scaling" for a forthcoming JET report [6].<br />
U. COMPARISON WITH THEORY<br />
Expressions for the anomalous transport, derived<br />
analytically for different instabilities, have been evaluated for<br />
JET parameters <strong>and</strong> compared with the measured fluxes. The<br />
extensive review in Ref. [11] <strong>and</strong> more recent literature has been<br />
taken into account. Only those modes which may be unstable in<br />
JET conditions, <strong>and</strong> for which predicted loss rates are available,<br />
will be discussed. Space does not permit these expressions to be<br />
reproduced here, they may be found in the references quoted. The<br />
notation here is the same as in the references.
a) Electron transport<br />
<strong>IAEA</strong>-CN-47/A-VI-l-l 331<br />
A significant level of agreement has recently been achieved<br />
[7,8] between the global energy confinement times measured on<br />
several tokamaks <strong>and</strong> prediction based on the dissipatlve trapped<br />
electron mode (DTEM). However, when the predicted local thermal<br />
diffusivity [8], including Zeff in the collision frequency vei,<br />
is compared with the experimental value in JET, the predicted<br />
value is typically an order of magnitude too high within the<br />
region where the DTEM should be dominant (see Fig.2b). Because<br />
of the strong dependence of the diffusivity on temperature (xe ~<br />
Te 7/z for the DTEM <strong>and</strong> xe ~ T e 3/ * for tne collisionless trapped<br />
electron mode) <strong>and</strong> on the characteristic lengths rn <strong>and</strong> r^., the<br />
global confinement time is sensitive to the temperature profile<br />
<strong>and</strong> cannot be adequately expressed in terms of the peak or mean<br />
temperature.<br />
It is questionable whether the temperature in JET is low<br />
enough, even in the edge region, to satisfy the criteria for the<br />
rippling instability [9]. In any case, the predicted diffusivity<br />
turns out to be too low by about two orders of magnitude.<br />
The microtearing mode (MT) [10] could develop under JET<br />
conditions for mode numbers m such that<br />
in MKS units <strong>and</strong> eV. The predicted electron thermal diffusivity,<br />
Xe - T 7 ^ 2 /n Z r.p 2 B 2 , has a parametric dependence similar to the<br />
DTEM, <strong>and</strong> is larger in magnitude. Close to the plasma edge in<br />
JET its value is comparable to the experimental value, but as one<br />
moves into the plasma it exceeds the experimental value by a<br />
rapidly increasing factor, as illustrated in Fig. 3b.<br />
Collisional drift wave transport [13] could occur in the JET<br />
edge region; however, the magnitude of the flux comes out too<br />
small by 1-2 orders of magnitude.<br />
Stochastic transport due to electrostatic trapping in drift<br />
waves has been proposed in Ref [it]. It could occur within the<br />
operating range of JET. However, as most of the other models, it<br />
reproduces neither the spatial dependence nor the scaling with<br />
global parameters obtained in JET.<br />
b) Ion transport<br />
The neoclassical ion heat diffusivity [15] is a factor 1-8<br />
below the experimental value in JET. For example, in Fig. 3b<br />
best fit was obtained with once neoclassical.<br />
The observed saturation in TE at higher densities has been<br />
reproduced in several tokamaks by including in the transport code<br />
the diffusivity derived for the ion temperature gradient
332 DUCHS et al.<br />
2<br />
3.25<br />
3.5<br />
NBI + RF<br />
9MW 4MW<br />
1.10B<br />
FIG. 5. Comparison between measured <strong>and</strong> empirically modelled (evolving) Te profiles for combined<br />
ion cyclotron heating (H minority) <strong>and</strong> neutral beam heating of a JET plasma (lp = 2 MA,<br />
B, =2.2 T).<br />
instability (ITG) [7,8]. However, the predicted thermal<br />
diffusivity for this mode in JET is more than an order of<br />
magnitude higher than the experimental value (see Fig. 2b).<br />
5. EMPIRICAL FLUX DESCRIPTION<br />
ctory<br />
[16] has been pursued<br />
the development of empirical prescriptions<br />
further.<br />
A widely applicable prescription is based on the experimental<br />
finding that, largely independent of additional heating<br />
<strong>and</strong> radiation losses, two parameters suffice to describe the<br />
electron temperature profile Tg(p) in all steady states (for<br />
Qb < 7) by<br />
Te(p) = Te(pb) expla[i-(p/pb) 2 ]J CO<br />
or an expression with similar profile characteristics.<br />
The flux surface coordinate ("radius") pb lies towards the<br />
inside of the radiation dominated layer, for most JET discharges<br />
close to the limiter radius. The parameter a can vary between<br />
1.5 < a < 2.2<br />
with a strong peak around a = 1.9, <strong>and</strong> no clear dependence on<br />
other plasma parameters.<br />
All rigorously derived transport equations are based on the<br />
assumption that the parameters of the system tend towards<br />
thermodynamic equilibrium, e.g. flat profiles for vanishing<br />
sources. It is possible to restructure the balance equations so
1.0-<br />
0.0-4<br />
<strong>IAEA</strong>-CN-47/A-VI-l-l<br />
12 13<br />
<br />
Shot 10237<br />
/7G. tf. Evolution of on-axis electron temperature Te(0) <strong>and</strong> volume averaged electron temperature<br />
334 DUCHS et al.<br />
It is not clear whether these requirements lead to a unique<br />
solution, nor is a sufficiently wide data base available yet for<br />
point b.<br />
An application of this procedure to particle transport is<br />
given by the popular anomalous inward particle flux term [18,19].<br />
Several practical approaches to solve the above problem for<br />
Te have been reported [20,21], <strong>and</strong> the connections to widely used<br />
empirical formulae have been pointed out. Our method [21 ] has,<br />
in the meantime, been successfully checked against a number of<br />
JET discharges including strong additional combined RF <strong>and</strong><br />
neutral beam heating <strong>and</strong> X-point plasmas. Figure 5 shows an<br />
example of "profile consistency". Figure 6 demonstrates good<br />
agreement with the measured time evolution of the electron<br />
temperature.<br />
6. CONCLUSIONS<br />
Measured local thermal fluxes in JET plasmas are presented.<br />
A vital ingredient is the power deposition for the various<br />
heating schemes. For the RF deposition the theoretical model<br />
which has been developed shows good agreement with measurements.<br />
The JET code now allows transport calculations with fully<br />
consistent free boundary equilibria. The application of<br />
predictive transport codes to obtain experimental local fluxes is<br />
outlined.<br />
Previous studies have mostly compared measured <strong>and</strong> predicted<br />
global energy confinement times. The comparison of local energy<br />
fluxes made here is a more exacting test of theory. The low<br />
collisionality regime accessible to JET also extends the<br />
parameter range. Our comparison shows that theoretically<br />
predicted loss rates do not agree with the observed radial<br />
variation in the fluxes.<br />
Empirically the temporal evolution of discharges in JET can<br />
be reproduced well by a prescription which enforces a certain<br />
shape of the Tg profile in ohmic <strong>and</strong> additionally heated steady<br />
state plasmas.<br />
ACKNOWLEDGEMENTS<br />
We are indebted to W.G.F. Core, S. Corti, M. von Hellerman, F.<br />
Romanelli <strong>and</strong> E. Springmann for their help <strong>and</strong> useful<br />
discussions.<br />
REFERENCES<br />
[1] APPERT, K., et al., Plasma Phys. Contrail. Fusion 28 (1986) 133.<br />
[2] SUCCI, S., et al., Comput. Phys. Commun. 40 (1986) 137.<br />
[3] WATKINS, M.L., et al., in Controlled Fusion <strong>and</strong> Plasma Heating (Proc. 13th Europ. Conf.<br />
Schliersee, 1986), Part I, European Physical Society (1986) 156.<br />
[4] CORTI, S., et al., ibid., p. 109.
<strong>IAEA</strong>-CN-47/A-VI-l-l 335<br />
[5] CENACCHI, G., TARONI, A., in Computational Physics (Proc. 8th Europ. Conf. Eibsee,<br />
1986), European Physical Society (1986) 57.<br />
[6] DUCHS, D.F., et al., JET Report, to be published.<br />
[7] DOMINGUEZ, R.R., WALTZ, R.E., Rep. No. GA-A-18184, General Atomic, San Diego, CA<br />
(1986).<br />
[8] ROMANELLI, F., TANG, W.M., WHITE, B.B., Rep. PPPL-2310, Plasma Physics Lab.,<br />
Princeton Univ., NJ (1986).<br />
[9] GARCIA, L., DIAMOND, P.H., CARRERAS, B.A., CALLEN, J.D., Phys. Fluids 28 (1985)<br />
2147.<br />
[10] DRAKE, J.F., GLADD, N.T., LIU, C.S., CHANG, C.L., Phys. Rev. Lett. 44 (1980) 994.<br />
[11] LIEWER, P.C., Nucl. Fusion 25 (1985) 543.<br />
[12] REBUT, P.H., BRUSATI, M., Plasma Phys. Contrail. Fusion 28 (1986) 113.<br />
[13] TERRY, P.W., DIAMOND, P.H., Phys. Fluids 28 (1985) 1419.<br />
[14] HORTON, W., CHOI, D.-I., YUSHMANOV, P.N., PARAIL, V.V., to be published.<br />
[15] CHANG, C.S., HINTON, F.L., Phys. Fluids 25 (1982) 1493.<br />
[16] COPPI, B., Comments Plasma Phys. Controll. Fusion 5 (1980) 261.<br />
[17] REBUT, P.H., et al., Paper <strong>IAEA</strong>-CN-47/E-III-4, these Proceedings, Vol. 2.<br />
[18] COPPI, B., SHARKY, N., Nucl. Fusion 21 (1981) 1363.<br />
[19] BEHRINGER, K., et al., in Divertors <strong>and</strong> Impurity Control in Tokamaks (Proc. <strong>IAEA</strong> Tech.<br />
Comm. Mtg Garching, 1981), Max-Planck-Institut fur Plasmaphysik, Garching (1981).<br />
[20] TANG, W.M., Rep. PPPL-2311, Plasma Physics Lab., Princeton Univ., NJ (1986).<br />
[21] TARONI, A., TIBONE, F., in Controlled Fusion <strong>and</strong> Plasma Heating (Proc. 13th Europ. Conf.<br />
Schliersee, 1986), Part I, European Physical Society (1986) 160.
MICROINSTABILITY BASED MODELS<br />
FOR CONFINEMENT PROPERTIES<br />
AND IGNITION CRITERIA IN TOKAMAKS<br />
W.M. TANG, CM. BISHOP 1 , B. COPPP, S.M. KAYE,<br />
F.W. PERKINS, M.H. REDI, G. REWOLDT<br />
Princeton Plasma Physics Laboratory,<br />
Princeton University,<br />
Princeton, New Jersey,<br />
United States of America<br />
Abstract<br />
<strong>IAEA</strong>-CN-47/A-VI-1-2<br />
MICROINSTABILITY BASED MODELS FOR CONFINEMENT PROPERTIES AND IGNITION<br />
CRITERIA IN TOKAMAKS.<br />
The results of theoretical studies are reported for: (1) the use of microinstability based thermal<br />
transport models to interpret the anomalous confinement properties observed in key tokamak experiments<br />
such as TFTR, <strong>and</strong> (2) the likely consequences of the presence of such instabilities for future<br />
ignition devices. Transport code simulations using profile consistent forms of anomalous thermal diffusivities<br />
due to drift type instabilities have yielded good agreement with the confinement times <strong>and</strong> temperatures<br />
observed in TFTR under a large variety of operating conditions including pellet fuelling in<br />
both Ohmic <strong>and</strong> neutral-beam-heated discharges. With regard to achieving an optimal ignition margin,<br />
the adverse temperature scaling of anomalous losses caused by drift modes leads to the conclusion that<br />
it is best to operate at the maximum allowable density while holding the temperature close to the minimum<br />
value required for ignition.<br />
ANALYSIS OF ANOMALOUS THERMAL CONFINEMENT IN TOKAMAKS<br />
Identification of the primary physical processes responsible<br />
for the anomalous thermal transport properties currently observed<br />
in tokamaks is vitally important not only for the effective<br />
development of methods to improve performance in existing devices<br />
but also for the proper planning of future ignition experiments.<br />
In recent work [1-4] it has been demonstrated that if realistic<br />
profile constraints are invoked, then most of the significant<br />
confinement trends in lowjbeta tokamaks can be explained by<br />
electrostatic (E * Bo) transport caused by drift-type<br />
microinstabilities. Anomalous thermal transport models based on<br />
the associated physics have yielded predictions in very favorable<br />
agreement with a substantial experimental data base with respect<br />
to both the scaling <strong>and</strong> the magnitude of the energy confinement<br />
time (TE) <strong>and</strong> the central electron temperature (Teo).<br />
1 Culham Laboratory, Abingdon, Oxfordshire, UK.<br />
2 Massachusetts Institute of Technology, Cambridge, MA, USA.<br />
337
338 TANG et al.<br />
In the present studies, the profile-consistent<br />
microinstability models derived in Ref. [2")have been used in the<br />
BALDUR (time-dependent, 1D) transport code [5] for the purpose of<br />
interpreting experimental results from TFTR including ohmic<br />
heating, neutral-beam-injection (NBI) heating, <strong>and</strong> pellet-fuelling<br />
in both ohmic <strong>and</strong> NBI-heated discharges. The theoretical<br />
expressions for the anomalous thermal diffusivities (xe, Xi) are<br />
based on the presence of trapped-electron drift modes <strong>and</strong>/or<br />
toroidal ion temperature gradient (n^) modes in the bulk region of<br />
optimal thermal insulation (roughly located between the q = 1 <strong>and</strong><br />
q = 2 surfaces in the plasma). They incorporate the familiar<br />
mixing length estimate for the magnitude of the fluctuations <strong>and</strong><br />
also include the assumption that a temperature "profile<br />
consistency" constraint [6] is satisfied. The latter is required<br />
here because the present state of development of nonlinear<br />
toroidal microinstability theories cannot provide reliable scaling<br />
with non-dimensional parameters such as q <strong>and</strong> because mechanisms<br />
outside the realm of microinstabilities could be playing a<br />
prominent role outside the q = 2 region. If the parameter, n^ =<br />
dJlnTj/dilnn^, remains below a critical magnitude, (npc (roughly<br />
about 2), then the dominant instability is the trapped-electron<br />
mode, <strong>and</strong> the associated form of the electron diffusivity can be<br />
expressed as<br />
TP 0 O.H(1+.25a)1oV' 8 F (p)<br />
Xe (cm /sec) 0.170.2R 0.4 0.9 (1><br />
neQR a Z BT qa<br />
with<br />
H<br />
[1-exp(-o )]exp(2a r 2 /3a 2 ) Jo r/a o dxxh(x)<br />
r/a<br />
[ne(r)/neo] [r 2 /a Z )\\ dxxh(x)<br />
where a = qa + 0.5, P(MW) is the total equilibrated ("steadystate")<br />
value of the input power (minus radiation losses), h(x) is<br />
the energy deposition profile, neo(10 cm ->), R(m), a(m), BT(T),<br />
<strong>and</strong> an is the usual parabolic density profile parameter. In<br />
arriving at Eq. (1), the intrinsic temperature dependence has been<br />
eliminated in terms of a power dependence through an assumed<br />
thermal steady state [2]. The influence of these modes on Xi<br />
tends to be masked by the usual ion neoclassical transport [2].<br />
However, if n^ > (ni)c, then the toroidal n^-modes become dominant<br />
[7], <strong>and</strong> the associated profile-consistent form of the anomalous<br />
ion diffusivity becomes<br />
n K<br />
i, ,<br />
*i 08 0 2 H<br />
(RB_q ) ' (a)<br />
T^a<br />
For a sufficiently collisionless plasma, Xe als0 scales as E Q-<br />
(2). On the other h<strong>and</strong>, for values of \>*e (the usual banana
<strong>IAEA</strong>-CN-47/A-VI-1-2 339<br />
regime colllsionality parameter) i 0.1 to 0.2, the electron loss<br />
channel remains sensitive to collisions in the presence of n^modes.<br />
This is due to the fact that even though it does not<br />
strongly affect these instabilities, the non-adiabatic trappedelectron<br />
response does determine Xe' Hence, the associated form<br />
of xe tends to be very similar to Eq. (1).<br />
Simulations of nearly two dozen TFTR discharges covering a<br />
wide range of experimental conditions were carried out with the<br />
BALDUR transport code using xe = *e E ° + x£ E . Xi = Xi E0 + Xi* (with<br />
X^ 1 = 0 if Hj i 1,5 at q = 1,5). Other important effects, such as<br />
sawteeth behavior inside the q = 1 region, radiation processes,<br />
etc. have also been included <strong>and</strong> are described in Ref.[5l. With<br />
regard to particle transport, empirical models were constructed to<br />
produce density profiles approximating the Thomson-scatter ingmeasured<br />
density data. In particular, D = D NE0 + D AN0M <strong>and</strong> v =<br />
v 0 + v AN0M . For example, in simulating the pellet-fuelled<br />
cases, D AN0M (cm 2 /sec) = n x 10 16 /ne(r) with v ANOff = 2D AN0M r/a 2<br />
before <strong>and</strong> V ANOM = 0 after the pellets are injected. The results<br />
from the predictive simulations of numerous TFTR large plasma<br />
discharges are summarized on Fig. 1 <strong>and</strong> Table 1 . On Fig. 1 the<br />
calculated energy confinement times are plotted as a function of<br />
the familiar neoAlcator parameter <strong>and</strong> compared with the<br />
experimental results from a large number of gas-fuelled ohmicallyheated<br />
discharges (crosses) as well as from pellet-fuelled ohmic<br />
cases (open diamonds). For the gas-fuelled cases it is quite<br />
clear that the anomalous enhancement of Xi associated with r^modes<br />
(solid circles) can account for the observed saturation of<br />
TE at values below those predicted by calculations using only Xi E °<br />
(open circles). The result from the simulation of an ohmic PDX<br />
plasma is also displayed to indicate consistent size-scaling at a<br />
small value of the neoAlcator parameter. With regard to the<br />
pellet-fuelled cases the simulation.results are again in very good<br />
agreement with the experimental data. As shown on Fig. 1, the<br />
first pair of diamonds correspond to values of tE at two points in<br />
time after the injection of a single pellet, <strong>and</strong> the second pair<br />
of diamonds to the analogous situation for a three-pellet<br />
experiment. The higher TE in each pair represents the confinement<br />
at the time closer to the time of injection,. In these cases the<br />
global confinement times are lower than those for the gas-fuelled<br />
experiments because of larger energy losses associated with<br />
convection <strong>and</strong> radiation. However, the simulations also indicate<br />
that the central confinement is significantly improved after<br />
pellet injection because of the resultant peaking in the density<br />
profile. This trend, which is in agreement with that found in the<br />
TRANSP data analysis, is likely due to xe scaling as 1/ne(r) <strong>and</strong><br />
to the fact that the r^-driven anomalous enhancement of x^ can be<br />
eliminated (e.g. in the 3-pellet case). Results for TE <strong>and</strong> Te<br />
from simulations of a representative set of NBI-heated TFTR<br />
discharges are given in Table 1 <strong>and</strong> show good agreement with the<br />
experimental values. These include a pellet-injection NBI case
340 TANG et al.<br />
Km »<br />
.1 ><br />
I on<br />
^ H « ^<br />
—* ^- *« o —<<br />
d d d d d<br />
o •* —
0.7<br />
0.6<br />
0.5<br />
_Q4<br />
V><br />
-<br />
-<br />
0.2-<br />
0.1 -<br />
. V<br />
/, po f,,<br />
<strong>IAEA</strong>-CN-47/A-VI-1-2 341<br />
1 ' '<br />
T<br />
IP<br />
M a 8<br />
I<br />
o<br />
-^Neo Alcator<br />
t<br />
8 . siu Xe TE ,Xi neo +Xi 1 ' i<br />
,<br />
10<br />
neqa<br />
* Gas Puff Experiment<br />
« Pellet Experiment<br />
FIG. 1. Results of simulations of neutral beam heated TFTR shots.<br />
(shot 14773) <strong>and</strong> a typical "supershot" discharge (shot 22014).<br />
All of the results displayed in Fig. 1 <strong>and</strong> Table 1 were computed<br />
using Eq. (1). With regard to the "supershot" case, preliminary<br />
calculations using a more realistic version of Xe^ r ^ (which takes<br />
into account only the power into the electron channel <strong>and</strong> the<br />
proper transition into the collisionless regime) has yielded close<br />
agreement with the experimental values given in Table 1; i.e. TE<br />
= 0.14s <strong>and</strong> Tg = 6.2 keV. In addition, all of the computed<br />
temperature profiles correlated well with the data, • <strong>and</strong><br />
comparisons of the theoretical \e(r) given by Eq. (1) <strong>and</strong> those<br />
obtained from TRANSP data analysis studies of a number of ohmic<br />
<strong>and</strong> NBI-heated TFTR discharges have also indicated reasonable<br />
agreement.<br />
Before proceeding with the further development <strong>and</strong><br />
application of the profile-consistent models just described to<br />
the important class of H-mode NBI-heated divertor plasmas, it is<br />
necessary to first establish the proper behavior of the<br />
microinstabilities invoked under such conditions. In previous<br />
studies involving comprehensive kinetic toroidal computations [8],<br />
it was demonstrated that the weaker pressure gradients in the<br />
interior region of H-mode plasmas led to correspondingly weaker<br />
instabilities. Although this reduction in the local anomalous<br />
thermal diffusivity in the inner zone is consistent with the<br />
observed improvement in TE, it leaves open the question of the<br />
nature of the transport properties in the very steep gradient<br />
region near the edge. Specifically, in order to be consistent<br />
with the thermal fluxes calculated in the interior, the local<br />
thermal diffusivity in the edge zone must be greatly reduced.<br />
20
342 TANG et al.<br />
This issue has been addressed in the present work by interfacing<br />
the kinetic stability code [8] with a model tokamak equilibrium<br />
with a separatrix [9]. The equilibrium here takes into account<br />
the enhanced local shear effects near the separatrix <strong>and</strong> is<br />
basically an extension of the familiar "s-a model" [10] whose<br />
finite-beta properties are primarily governed by the magnitude of<br />
the local pressure gradient. Fully electromagnetic calculations<br />
of the dominant toroidal microinstabilities were carried out using<br />
as input parameters the edge data obtained from careful<br />
measurements of H-mode <strong>and</strong> L-mode PDX tokamak discharges. The<br />
results generally indicate that the proximity of the separatrix to<br />
the magnetic surface considered has a significant stabilizing<br />
influence. This effect is considerably stronger for the H-mode<br />
cases with their characteristically steeper edge profiles. In<br />
particular, the finite-beta-modified drift-type electrostatic<br />
modes are found to be stable over a region extending several<br />
centimeters inside the separatrix for the H-mode profiles but over<br />
a much smaller range for the L-mode. These enhanced local<br />
stability properties near the separatrix thus serve to support the<br />
notion that thermal transport properties in H-mode plasmas are<br />
reconcilable with microinstability-based models.<br />
CONSEQUENCES OF MICROINSTABILITIES FOR IGNITION IN TOKAMAKS<br />
The favorable correlations between the confinement trends<br />
observed under a large variety of tokamak operating conditions <strong>and</strong><br />
the results from the anomalous transport studies just described as<br />
well as from previous work [1-4] serve to emphasize the importance<br />
of addressing the consequences of drift-type instabilities for<br />
future ignition devices. Under steady-state conditions, the<br />
simplest form of the basic homogeneous (zero-dimensional) thermal<br />
energy balance equation is given by<br />
p - p + p + p _ p (3)<br />
h Le Li R ct V<br />
where Pn is the external heating power density, PLe <strong>and</strong> PL1<br />
represent the losses due to electron <strong>and</strong> <strong>and</strong> ion conductivity, PR<br />
represents radiation losses, <strong>and</strong> Pa is the a-particle heating<br />
term. In earlier calculations [11,12] it was demonstrated that<br />
the familiar Murakami density limit represents a balance between<br />
radiation losses (PR) <strong>and</strong> ohmic heating input power (P^)-<br />
However, since the fusion power (Pa) will offset PR at<br />
temperatures characteristic of ignition conditions (TQ > 6 keV),<br />
this limit should not be relevant. Instead, attention needs to be<br />
focused on the influence of enhanced forms of P^g <strong>and</strong> Pj^ caused<br />
by the presence of microinstabilities. First consider the<br />
situation where the dominant terms in Eq. (1) are Pa, PR (from<br />
bremsstrahlung), <strong>and</strong> PLe from anomalous losses associated with the<br />
dissipative trapped-electron modes. Using the simple local form
<strong>IAEA</strong>-CN-47/A-VI-1-2 343<br />
for> Xe given in Ref. [1] <strong>and</strong> applying the boundary conditions of<br />
sawtooth flattening for q £ 1 <strong>and</strong> Te = 0 for q >_ 2, the<br />
corresponding 1-D radial equation yields eigenvalue solutions<br />
which can be expressed in the form of an ignition criterion,<br />
[no(i0 15 Cnf 3 )BT(i0 T)] 2 [a(m)] 2 - 5 [R(m)] 1 - 5 > U.e^/qJ 1 * V CO<br />
Since P^e is independent of density in the dissipative trappedelectron<br />
regime, it can be concluded that for ignition experiments<br />
falling in this regime, the density can be increased to the point<br />
where the criterion given by Eq. (4) can be satisfied, provided<br />
external power (Pn) is supplied to compensate for the heat<br />
capacity of the increased density <strong>and</strong> to maintain TQ > 6 keV so<br />
that Pa > PR. The power required to balance the thermal<br />
conduction losses is estimated to be Pcrit(MW) = 120 (3/qa) '<br />
(To/6 keV) -t> a^/tZB^UR) 0 - 5 ). These results clearly suggest<br />
that the optimal ignition scenario would involve operating at<br />
(i) the lowest allowable temperature (consistent with ignition),<br />
(ii) the highest allowable density (consistent with MHD 8-limits<br />
but not the Murakami limit), <strong>and</strong> (iii) the flattest density<br />
profiles (because of the strong an-dependence in the local model<br />
used for xe^* However, with regard to (iii), it should be<br />
strongly cautioned that if the density profiles are allowed to be<br />
too flat, then n^ can easily exceed (ni)c« The consequent<br />
enhancement of PLi due to n^-instabilities can then pose a very<br />
restrictive density constraint in the ignition temperature<br />
regime. In order to simply illustrate this point, it is<br />
convenient to express Eq. (3) in a schematic form highlighting the<br />
density <strong>and</strong> temperature dependences in each term, i.e. (taking It<br />
= Te = T)<br />
9/2 2f 1/2 5/2^ 5/2 ,-,<br />
P h " Y TE T "•" t V " V > + n \ T (5)<br />
q/2<br />
with. ^TE" being the dissipative trapped-electron losses,<br />
n ^ ^BN b e i n 8 losses due to brejivastrahlung <strong>and</strong> ion neoclassical<br />
conduction, YaT 5/2 s Pa, <strong>and</strong> nYn T 5/2 being the r^-mode losses. In<br />
the absence of the last ternf, Eq. (5) clearly indicates that,<br />
provided Ph > YTET y/ , there would indeed be no density limit for<br />
T 2. TMI, with TMI = (TTBN/Ya) 3 minimum ignition temperature.<br />
However, if present, this density-dependent loss term would force<br />
operating below an upper density bound at T < TMI <strong>and</strong> above a<br />
lower density bound at T > TMI. The latter situation simply<br />
corresponds to requiring PQ > ni^/P . Estimates from Eq. (5)<br />
indicate that the external power i needed to reach ignition is<br />
proportional to T^i • Hence, in order to avoid such stringent<br />
constraints, pellet-injection fuelling procedures could be adopted<br />
to produce density profiles sufficiently peaked to suppress the<br />
Hi-modes. After exceeding the required ignition temperature, a
344 TANG et al.<br />
less discriminating fuelling system would be adequate since Pa<br />
could then offset any ensuing anomalous losses of this type. In<br />
general, for T > Traj, the power losses resulting from drift modes<br />
increase at least as rapidly with T as the fusion power.<br />
Consequently, the optimum path to ignition should exploit<br />
favorable scalings with BT, density, size, etc., while holding T<br />
close to Tmj.<br />
ACKNOWLEDGMENTS<br />
We are indebted to P.C. Efthimion, G.L. Schmidt, D.R.<br />
Mikkelsen, <strong>and</strong> the TFTR physicists for providing the data as well<br />
as valuable assistance needed to carry out the BALDUR<br />
simulations. Special thanks are extended to S. Hiroe, B. LeBlanc,<br />
<strong>and</strong> B. Grek for providing the profile data from PDX used in the Hmode<br />
calculations.<br />
This work was supported by United States Department of Energy<br />
Contract No. DE-ACO2-76-CHO-3073 <strong>and</strong> for F. Perkins also by NASA<br />
Contract No. NAGW-91 <strong>and</strong> by the National Bureau of St<strong>and</strong>ards.<br />
REFERENCES<br />
[1] PERKINS, F.W., in Heating in Toroidal Plasma (Proc. 4th Int. Symp. Rome, 1984), Vol. 2,<br />
Int. School of Plasma Physics, Varenna (1984) 977.<br />
PERKINS, F.W., SUN, Y.C., Rep. PPPL-2261, Plasma Physics Lab., Princeton Univ.,<br />
Princeton, NJ (1985).<br />
[2] TANG, W.M., Nucl. Fusion 26 (1986) 1605.<br />
[3] DOMINGUEZ, R.R., WALTZ, R.E, Rep. GA-18184, GA Technologies, Inc., San Diego, CA<br />
(1986).<br />
[4] ROMANELLI, F., TANG, W.M., WHITE, R.B., Nucl. Fusion 26 (1986) 1515.<br />
[5] SINGER, C.E., et al., Rep. PPPL-2073, Plasma Physics Lab., Princeton Univ., Princeton, NJ<br />
(1986).<br />
[6] COPPI, B., Comments Plasma Phys. Controll. Fusion 5 (1980) 261.<br />
[7] TANG, W.M., REWOLDT, G., CHEN, Liu, Phys. Fluids 29 (1986) 3715.<br />
[8] TANG, W.M., et al., Nucl. Fusion 25 (1985) 151.<br />
REWOLDT, G., et al., Phys. Fluids 25 (1982) 480.<br />
[9] BISHOP, P.M., Rep. CLM-P-764, UKAEA Culham Lab., Abingdon (1985).<br />
[10] CONNOR, J.W., et al., Phys. Rev. Lett. 40 (1978) 396.<br />
[11] PERKINS, F.W., HULSE, R.A., Phys. Fluids 28 (1985) 1837.<br />
[12] COPPI, B., TANG, W.M., Rep. PPPL-2343, Plasma Physics Lab., Princeton Univ.,<br />
Princeton, NJ (1986).
DRIFT WAVE MODELS<br />
OF TOKAMAK CONFINEMENT<br />
R.E. WALTZ, R.R. DOMINGUEZ, S.K. WONG 1 ,<br />
GA Technologies, Inc.,<br />
San Diego, California<br />
P.H. DIAMOND, G.S. LEE 2 , T.S. HAHM, N. MATTOR<br />
Institute for Fusion Studies,<br />
University of Texas,<br />
Austin, Texas<br />
United States of America<br />
Abstract<br />
<strong>IAEA</strong>-CN-47/A-VI-1-3<br />
DRIFT WAVE MODELS OF TOKAMAK CONFINEMENT.<br />
Drift wave models are used to explain the observed tokamak confinement scaling with density,<br />
power, size <strong>and</strong> magnetic field. Some additional edge mechanism is required to obtain the observed<br />
scaling with safety factor <strong>and</strong> to account for H-mode transitions.<br />
1. INTRODUCTION<br />
Simple scaling models for Ex Bo transport from drift wave turbulence<br />
have had considerable recent success in explaining many universally<br />
observed features of tokamak confinement. This paper summarizes<br />
those successes <strong>and</strong> discusses the remaining difficulties of such models.<br />
The theory is broken into drift wave models for the bulk plasma which<br />
control the scaling of confinement time with power (temperature), density,<br />
size, <strong>and</strong> magnetic field, <strong>and</strong> models for the edge plasma which<br />
control the scaling of confinement time <strong>and</strong> temperature profiles with<br />
safety factor, q, <strong>and</strong> possibly transitions to improved divertor (H-mode)<br />
confinement.<br />
We report first on the application of some simple mixing length<br />
models in a st<strong>and</strong>ard tokamak transport code [1]. Then,as an example of<br />
much recent work on the theory <strong>and</strong> simulation of drift wave turbulence<br />
itself, we summarize an analytic re-examination of ion temperature gradient<br />
mode turbulence [2]. Finally, we discuss several models for the<br />
edge plasma, their difficulties <strong>and</strong> their promises.<br />
1 Jaycor, San Diego, CA, USA.<br />
2 Oak Ridge National Laboratory, Oak Ridge, TN, USA.<br />
345
346 WALTZ et al.<br />
2. TRANSPORT CODE SIMULATIONS<br />
In the bulk plasma, turbulent transport from two drift mode<br />
branches is important: the dissipative trapped electron (DTE) mode<br />
for o>*/i>eff < 1 or the collisionless trapped electron (CTE) mode for<br />
^•/^efT > 1> <strong>and</strong> the ion temperature gradient (rji) mode. At the plasma<br />
edge, the collisional circulating electron (CCE) mode for ue/u)te > 1 or<br />
possibly the universal circulating electron (UCE) mode for ue/./kl) • [(«./!**), 1] (la)<br />
Di = (t*/*2) • [(2/r) • (LJR) • (W^)] 1/2 (lb)<br />
DCE = {"./kl) • (u;,/u>te) • [(!/e/u;te, 1]^ (lc)<br />
where 7 is the linear growth rate <strong>and</strong> kx = (1/Axk) is the inverse<br />
mixing length. We assumed kx equal to an rms poloidal wavenumber<br />
kg = 0.3p~ l . [The notation is st<strong>and</strong>ard: e = r/R, a>» = kg(cTe/eB)/Ln,<br />
VfS =• ue/e, ve is the electron collision frequency, r = Te(Ti, Ln <strong>and</strong><br />
LT are density <strong>and</strong> temperature gradient lengths, u;te = ve/Rq,-with<br />
ve = (2Te/me) 1/2 , p. = c,/9,i with c, = (Te/rm) 1 ' 2 <strong>and</strong> Q = eB/rmc]<br />
To specify the model further, we took the turbulent heat diffusivities<br />
to be Xe = c • 5/2 • [bTE + DcB) (1 + ceifi • LJR • Ln/LT) <strong>and</strong><br />
Xi = c • 5/2 • [Difi + Cie(DTE + -DcJsOLwhere Ce< = 3 represents electron<br />
transport driven by the ion modes <strong>and</strong> Cie = 1 represents ion transport<br />
driven by electron modes. /< = 1(0) for r/i = Ln/Lri ~> (•C) ?7ith ^ 1><br />
the ion mode threshold. A small <strong>and</strong> generally unimportant electron<br />
to ion exchange A = Cje • nT • C(DTE + DCE)/L^twas included, c is<br />
the "fit" coefficient (e.g., c = 1 for Dili, Alcator-A <strong>and</strong> -C, JET, <strong>and</strong><br />
c = 0.3 for ISX-A). While the model was designed to fit Dili, subsequent<br />
simulations of ohinic Alcator density scans showed premature density<br />
saturation due to the electron driven CCE-mode scaling. This suggests<br />
that we assume the electron branch of the scaling to be stabilized by<br />
electron temperature gradients rje except on the extreme edge. Neoclassical<br />
ion heat loss, classical exchange, Spitzer's relation between current<br />
<strong>and</strong> voltage, as well as sawteeth degradation inside q = 1 were included.<br />
Edge losses from convection, <strong>and</strong> charge exchange were not explicitly<br />
included, <strong>and</strong>, more importantly, radiation was also not included.
50 -<br />
OH, 1 = 473 kA .<br />
B = 24 kG /<br />
• w<<br />
10 - tVi<br />
Sff- 4.0 3.0<br />
- 1.8 1.4<br />
<strong>IAEA</strong>-CN-47/A-VI-1-3 347<br />
C. T<br />
2.0<br />
0.8<br />
1<br />
n(x10 13 cirr 3 )<br />
FIG. 1. Dill density scan with Ohmic heating, showing total energy confinement lime TE with i)i mode<br />
"on" <strong>and</strong> "off" <strong>and</strong> electron energy confinement time TEe in comparison with experiment;<br />
n = n(0) (1 - ^ 2<br />
In low density ohmically heated plasmas, the DTE mode provides<br />
the confinement time scaling (rB oc a?/x) r^ 71 « na 1 - 04 ^ 1 - 79 ? 1 - 16<br />
5-°- 33 Z- 0 - 17 (Ln/a) 0 - 83 , which is very close to the established neo-<br />
Alcator scaling. At higher densities,many tokamaks (e.g., Dili, Alcator-<br />
C gas) have progressively flatter density profiles (Ln large) with r)i increasing<br />
past the threshold. This causes the ion channel to be degraded<br />
well below the neoclassical confinement limit, as often observed (e.g.,<br />
ISX-A, Alcator-A, Alcator-C pellet), <strong>and</strong> TE
348 WALTZ et al.<br />
50<br />
10<br />
q(a)-<br />
OH "OFF", 50%-50% WEDGE HEATING<br />
n = 6x10 13 cm" 3 , Pg = 3 MW, B = 24 kG, a,, = 0.6,<br />
1.75-2.25;<br />
2.75-3.25<br />
2-2.5; 3-3.5<br />
6.0<br />
, A<br />
4.19<br />
A I<br />
100 500<br />
FIG. 2. Dili confinement time TE versus current at fixed power; 0% with no tearing mode short circuit;<br />
50% partial tearing mode short circuit; 100% complete short circuit q > 2 (see Ref. [3]); dashed lines<br />
indicate data for short circuit only at q = 2 <strong>and</strong> 3.<br />
Dili (<strong>and</strong> several other tokamaks) typically beam heat from the<br />
77; saturated ohmic regime. The power scaling from this mode when<br />
acting alone is rEB ex p-° 6 n 0 - 6 I°- 8 a 2 - 2 (a/R)- ls q 0 - 6 . With sufficient<br />
power or steepening density profile, the electron confinement may saturate<br />
with nearly identical CTE mode scaling [3]. Accounting for the<br />
beam penetration effect modifies the density scaling from n 0
<strong>IAEA</strong>-CN-47/A-VI-1-3 349<br />
Some edge mechanism must be found to degrade the edge confinement<br />
at high q, making the effective size smaller than a <strong>and</strong> canceling<br />
the q 0 - 8 factor [3]. The CCE mode with x « q 2 R 2 B~ 2 L- 2 nZT-^ 2<br />
has these qualitative properties. However, when acting alone with the<br />
bulk drift waves, it produces only a modest current scaling (no more<br />
than r oc I° A ). Some additional high-g mechanism is needed. If we assume<br />
that low-m tearing modes short-circuit the heat flow near integer<br />
g-surfaces (q = m to m + VB, m = 2,3,4..., <strong>and</strong> VB is the fractional<br />
amount between adjacent rational surfaces that is short-circuited), then<br />
the observed scaling T OC IB 0 can be obtained for VB = 0.50. The current<br />
scaling of these models is illustrated by Dili simulations shown<br />
in Fig. 2.<br />
In addition to controlling the g-scaling, the edge mechanism must<br />
cool the edge sufficiently to force current to the center, thereby producing<br />
sawteeth <strong>and</strong> maintaining q(0) ~ 1. [The drift wave models<br />
alone are not sufficient <strong>and</strong> the tearing mode short circuits are<br />
needed to force sawteeth at high q.] We have shown [4] that g(0) = 1<br />
<strong>and</strong> Spitzer's law are sufficient to bound the temperature profile to<br />
q(a) > T(0)/{T) > g(a) 2 / 3 <strong>and</strong> provide the so-called principle of profile<br />
consistency. In fact, both ohmic <strong>and</strong> beam heated discharges from<br />
Dili <strong>and</strong> TFTR have T(0)/(T) ~ g(a) 2 / 3 , the minimum requirement<br />
for sawteeth, <strong>and</strong> recent high-g Alcator discharges without sawteeth fall<br />
well below the peakedness bounds.<br />
3. THEORY OF ION TEMPERATURE GRADIENT<br />
MODE TURBULENCE<br />
Tji-mode turbulence or ion pressure gradient driven turbulence<br />
(IPGDT) is of interest, not only because of its crucial role in tokamak<br />
confinement scaling described above, but also as a paradigm for<br />
saturated multifield turbulence. It has a long history [5], with contributions<br />
from many workers. To facilitate analytic progress, the more<br />
tractable sheared slab model is considered here rather than the toroidal<br />
model [6]. The latter includes ion curvature drifts (oc 1/R) in addition<br />
to ion parallel motion. Special emphasis is placed on the validity of the<br />
mixing length estimates <strong>and</strong> the relation of ion thermal transport to<br />
electron heat <strong>and</strong> particle confinement.<br />
IPGDT develops from unstable Tft-modes, which result from the<br />
coupling of sound waves to radial ion temperature gradients. For
350 WALTZ et al.<br />
Vi ^ Wicrit > 1> IPGDT can be described by coupled equations for vorticity<br />
(Vniji), parallel flow velocity (v||), <strong>and</strong> ion pressure (p). In a field<br />
with shear length La = Rq/s (s = d£nq/d£nr) <strong>and</strong> with L^/LaLj- » • Ln/La. In general, the characteristic length<br />
of the modes is Ax*. ~ [(•yk/v*)/(Ln/La)] 1 / 2 pa. Shorter wavelength<br />
modes develop frequencies u>r ~ 7 as k$pa —» 1. Ultimately, ion L<strong>and</strong>au<br />
damping, represented in the fluid model as a parallel ion viscosity<br />
//|| ~ (
<strong>IAEA</strong>-CN-47/A-VI-1-3 351<br />
even if "inertial range" properties are insensitive to /i||, macroscopic observables<br />
are determined by spectrum sums whose limits of integration<br />
depend on dissipation. Indeed, C(Re) —» oo as ^|| —> 0!<br />
Several transport coefficients of practical interest have been derived<br />
using the theory of IPGDT. The ion thermal diffusivity is given<br />
by<br />
Xi = 0.4|C(Re)| 2 (j> 2 .c./L.) [(1 + m)/rf (3)<br />
Using the dissipative trapped electron response (for i/*e < 1), the accompanying<br />
electron thermal Xe diffusivity <strong>and</strong> particle diffusion Dn are<br />
obtained from quasilinear theory [xe, Dn oc |e f?ecrit» an<br />
inward flow results. A normally outward heat conduction flow with<br />
similar scaling is induced by IPGDT at the edge.<br />
There are several correlations with experiments. IPGDT drives a<br />
toroidal flow viscosity fx± ~ Xt>which may explain the Dili observation<br />
that toroidal flow damping times r^ are comparable to Tg in co-injection<br />
heated plasmas. In addition, impurity gradients can have a significant<br />
effect on IPGDT. In particular, for an impurity species with density noj<br />
<strong>and</strong> scale length Lnj, IPGDT transport is modified according to the substitution<br />
(1+17,-) -»' A(l+77i), where A = [l + Z(noI/noi) {L^/L^)]- 1 .<br />
Thus, impurity distributions peaked at the edge enhance IPGDT, while<br />
distributions peaked on axis quench it. In particular, the inward par-
352 WALTZ et al.<br />
tide flux at the edge (u»e > 1) is strongly enhanced,rn —» A 3 rn,for<br />
edge-peaked impurity profiles. This enhancement may underlie the<br />
density profile steepening <strong>and</strong> improved particle confinement following<br />
impurity puffing observed during the Z-mode of the ISX-B tokamak.<br />
From the previous intermediate formulas, alternative scalings can<br />
be obtained in other physical limits. For example, in the extremely<br />
flat density profile limit,L 2 n/LaLT » 1. jk - ^*[{ L n/L,){l + Vi)M 1/2 ,<br />
giving the mixing length estimate Xi ~ [(1 + ^i)/ T ]/ :> 4 c »/in> a P a rt from<br />
logarithmic factors. In the extreme toroidal limit, jy. ~ u3m\2(Ln/R)<br />
(1 + m)/r] 1/2 , with Xi ~ [2 i,L,/R) (1 + Vi)H • /^c,/Ln,using the shear<br />
mixing length [6]. [The latter formula differs from the toroidal scaling<br />
Eq. (lb) [7,8] where a shearless mixing length Ax = 3p, was used.]<br />
These formulas differ most significantly from Eq. (3) in their dependence<br />
on La. However, they are difficult to distinguish experimentally because<br />
q{r)/s(r) is a weak function of q(a) in the bulk plasma where rji mode<br />
turbulence is dominant.<br />
4. THE EDGE PLASMA<br />
Our underst<strong>and</strong>ing of the edge plasma <strong>and</strong> the mechanism for<br />
controlling g-dependence remains unsatisfactory. Other models have<br />
been considered in place of the CCE-mode scaling with only partial<br />
success. For example, limiting the edge pressure gradient to the critical<br />
ideal value (P' < P^t
<strong>IAEA</strong>-CN-47/A-VI-1-3 353<br />
oci-Vi? 2 (£?|,/5) 4 / 3 T-^n^L^a 2 ' 3 (6)<br />
where E\\ = V\OOP/2TTR — T}\\J\\. (This scaling is at fixed mode number<br />
(m)^ suggested by numerical calculations. It also includes impurity<br />
effects.) These diffusivities from DFT all have favorable T-scaling (in<br />
contrast to transport from bulk drift waves) <strong>and</strong> x«L] oc s~ 2 q 2 . We<br />
speculate that both features may be used to explain the improved edge<br />
confinement layer just inside the separatrix of the ASDEX H-mode.<br />
Diverted plasmas naturally have a hotter edge on closed field lines exploiting<br />
the favorable T-dependence. Perhaps more importantly, it can<br />
be shown [11] that while q diverges logarithmically near a separatrix,<br />
s~ 2 q 2 vanishes algebraically as (1 — r 2 /r^p) 2 , allowing a steep gradient<br />
in T as well as n to be supported as r —> r^p. Also, the steepening<br />
density gradient may allow ideal ballooning modes to be diamagnetically<br />
stabilized. Indeed, using a> = a>»;/2 ± (w 2 ^ — 47^IHD) 1 / 2 /2, modes<br />
with kjp 2 > (2Ll/LpR) [1 - (Lp/P)((3/Lp)crit], corresponding to the<br />
full range of "high-n" modes for ASDEX parameters, are stable.<br />
ACKNOWLEDGMENT<br />
This is a report of work sponsored by the U.S. Department of<br />
Energy under Contract Nos. DE-AC03-84ER53158 <strong>and</strong> DE-FG05-<br />
80ET53088.<br />
REFERENCES<br />
[1] DOMINGUEZ, R.R., WALTZ, R.E., Nucl. Fusion 27 (1987) 65.<br />
[2] LEE, G.S., DIAMOND, P.H., Phys. Fluids 29 (1986) 3291.<br />
[3] PERKINS, F.W., in Heating in Toroidal Plasmas (Proc. 4th Int. Symp. Rome, 1984), Int. School<br />
of Plasma Physics, Varenna (1984).<br />
TANG, W.M., CHENG, C.Z., KROMMES, J.A., et al., in Plasma Physics <strong>and</strong> Controlled<br />
<strong>Nuclear</strong> Fusion Research 1984 (Proc. 10th Int. Conf. London, 1984), Vol. 2, <strong>IAEA</strong>, Vienna<br />
(1985) 213.<br />
[4] WALTZ, R.E., WONG, S.K., GREENE, J.M., DOMINGUEZ, R.R., Nucl. Fusion 26 (1986)<br />
1729.<br />
[5] POGUTSE, O.P., Sov. Phys. — JETP 25 (1967) 498.<br />
COPPI, B., ROSENBLUTH, M.N., SAGDEEV, R.Z., Phys. Fluids 10 (1967) 582.<br />
[6] HORTON, W., CHOI, Duk-In, TANG, T.M., Phys. Fluids 24 (1981) 1077.
354 WALTZ et al.<br />
[7] ANTONSEN, T., COPPI, B., ENGLADE, R., Nucl. Fusion 19 (1979) 641.<br />
[8] WALTZ, R.E., Phys. Fluids 29 (1986) 3684.<br />
[9] CONNOR, J.W., TAYLOR, J.B., TURNER, M.F., Nucl. Fusion 25 (1985) 65.<br />
[10] HAHM, T.S., TERRY, P.W., DIAMOND, P.H., Rep. IFSR-180, Inst. for Fusion Studies,<br />
Texas Univ., Austin (1985), submitted to Phys. Fluids.<br />
[11] HAHM, T.S., DIAMOND, P.H., Rep. IFSR-230, Inst. for Fusion Studies, Texas Univ., Austin<br />
(1986); Phys. Fluids (in press).
DISCUSSION<br />
ON PAPERS <strong>IAEA</strong>-CN-47/A-VI-l-l TO A-VI-1-3<br />
B.P. LEHNERT: Did you take into account interaction of plasma <strong>and</strong> neutral<br />
gas in the edge region? The reason for my question is that even small amounts of<br />
recycling neutral gas could have an effect on the plasma profiles in a quasi-steady<br />
state. As an example, an increasing average plasma density will lead to a decreasing<br />
penetration length of the neutral gas, <strong>and</strong> this in turn will lead to a growing plasma<br />
pressure gradient in the edge region.<br />
D.F. DUCHS: Neutral gas is self-consistently included in both the JET model<br />
<strong>and</strong> the Princeton model. The model developed by GA Technologies explicitly<br />
excludes neutral gas. We do not believe that it affects our results very much.<br />
G. BECKER: One problem with electron heat diffusivities derived from drift<br />
wave turbulence is that their scalings differ from the scalings of the coefficients determined<br />
from the experiments by local transport analysis or transport modelling. Discrepancies<br />
occur with the dependence on the ion mass number <strong>and</strong> the main magnetic<br />
field, <strong>and</strong> in neutral beam heated plasmas also with the current or B . I therefore<br />
conclude that the present drift wave models do not explain the experimental<br />
behaviour observed.<br />
D.F. DUCHS: As I have shown, our comparisons would lead to the same conclusion.<br />
However, if global profile consistency is considered, for example including<br />
constraints, the dependent variables, such as Te in the expression for xe» can be<br />
expressed in terms of BT. Such scaling shows good agreement with the experimental<br />
results. In this sense, one should not rule out unstable drift waves as possible turbulence<br />
mechanisms.<br />
K. ITOH: Did you observe that the discrepancy between the experimentally<br />
derived heat flux <strong>and</strong> the theory, for example in the dissipative trapped electron<br />
mode, scaled with the plasma size? In other words, when comparing the data with<br />
the experiment, did you find that an 'intermittence of the scale length' appeared in<br />
V? e<br />
355<br />
D.F. DUCHS: In our JET calculations we did not vary the plasma rise very<br />
much. However, we know from experience that, for example, 'Venetian blinds'<br />
effectively reduce the plasma radius.<br />
B. COPPI: The nature of the TJ; modes changes considerably over the rji range<br />
1 - 4. In addition, the spatial mode localization is an important factor to be considered<br />
in assessing the relevant transport. How is all this accounted for in the expression<br />
for Xi presented by the group from GA Technologies?<br />
D.F. DUCHS: The range of validity of the •ql theory presented is:<br />
•fi.crit. < *?; < WLj- Clearly, the theory fails for ^ ~ ijicrit, where detailed kinetic<br />
analysis is needed, <strong>and</strong> for ^ > La/Lj., with a weaker dependence on rj;. The latter<br />
regime may be relevant for some of the JET cases. For ij, cril < T\{ < L6/LT, Xj is<br />
well approximated by the given expression. In the codes, a threshold turn-on function,<br />
varying rapidly with rj-^ is used as an approximation for reasons of practicality.
MHD STABILITY AND TRANSPORT<br />
OF BEAM HEATED ASDEX DISCHARGES<br />
IN THE VICINITY OF THE BETA LIMIT<br />
<strong>IAEA</strong>-CN-47/A-VI-2<br />
O. GRUBER, G. BECKER, G. von GIERKE, K. GRASSIE, O. KLUBER,<br />
M. KORNHERR, K. LACKNER, J.K. LEE 1 , H.P. ZEHRFELD, H.S. BOSCH,<br />
H. BROCKEN, A. EBERHAGEN, G. FUSSMANN, O. GEHRE,<br />
J. GERNHARDT, E. GLOCK, G. HAAS, J. HOFMANN, A. IZVOZCHIKOV 2 ,<br />
G. JANESCHITZ, F. KARGER, M. KAUFMANN, M. KEILHACKER 3 ,<br />
M. LENOCI, G. LISITANO, F. MAST, H.M. MAYER, K. McCORMICK,<br />
D. MEISEL, V. MERTENS, E.R. MULLER 3 , H. MURMANN 3 ,<br />
H. NIEDERMEYER, W. POSCHENRIEDER, H. RAPP, H. RIEDLER,<br />
H. ROHR, J. ROTH, F. RYTER 4 , F. SCHNEIDER, C. SETZENSACK,<br />
G. SILLER, P. SMEULDERS 3 , F.X. SOLDNER, E. SPETH, K.-H. STEUER,<br />
O. VOLLMER, F. WAGNER, D. ZASCHE<br />
Euratom-IPP Association,<br />
Max-Planck-Institut fur Plasmaphysik,<br />
Garching, Federal Republic of Germany<br />
Abstract<br />
MHD STABILITY AND TRANSPORT OF BEAM HEATED ASDEX DISCHARGES IN THE<br />
VICINITY OF THE BETA LIMIT.<br />
Neutral beam heated H mode discharges in ASDEX exhibit a beta limit at /3C = 2.8 Ip/(aBt)<br />
[%, MA, m, T] in agreement with theoretical predictions. A 'hard /3 saturation' is always observed<br />
nearly without prior confinement deterioration up to |8max. Enhanced losses set in after the attainment<br />
of finm, causing a subsequent decrease of the energy content by typically 30%. Analyses with the<br />
TRANSP <strong>and</strong> BALDUR codes using measured plasma parameters reveal this transport enhancement to<br />
be mainly due to electron heat conduction <strong>and</strong> convection losses. Impurity accumulation is correlated<br />
with the time evolution of j3. It can be ruled out as directly responsible energy loss channel, but may<br />
cause enhanced current density flattening <strong>and</strong> a consequent reduction in the maximum stable /3 values.<br />
Using the pressure <strong>and</strong> current density profiles from the transport analyses, the authors try to identify<br />
the responsible instabilities theoretically. Low m (< 6) pressure driven tearing modes are predicted by<br />
the 3-D CART code <strong>and</strong> are seen in Mirnov coil signals, but show no clear experimental correlation<br />
with the observed 0 limitation. The solution of the full ideal MHD ballooning equation predicts these<br />
plasmas to be stable, leaving resistive ballooning modes in an intermediate range of wavenumbers<br />
(between 30 <strong>and</strong> 50) as a possible cause of the observed behaviour.<br />
1 GA Technologies, San Diego, CA, USA.<br />
2 Academy of <strong>Sciences</strong>, Leningrad, USSR.<br />
3 JET Joint Undertaking, Culham, Oxfordshire, UK.<br />
4 Centre de recherches en physique des plasmas, Ecole polytechnique f&Je'rale de Lausanne,<br />
Lausanne, Switzerl<strong>and</strong>.<br />
357
358 GRUBER et al.<br />
1. Introduction<br />
In the divertor tokamak ASDEX neutral beam-heated H mode discharges allow,due to<br />
their superior confinement^ test of the B limits over a large range of magnetic fields<br />
(1.2 < B{ < 2.7 T) <strong>and</strong> plasma currents (0.2 < L < 0.48 MA) with the available<br />
modest beam powers of up to 4.5 MW. A clear "operational" beta limit at<br />
6C = 2.8 lp/(a Bt) [%, MA, m, T] is observed IV (2a = 0.8 being the horizontal<br />
plasma diameter). In the L mode even combined neutral beam <strong>and</strong> ion cyclotron<br />
resonance heating with powers up to 5 MW allowed - possibly restricted by the<br />
limited heating time IV - only values of Bmax 0.8Bc, which<br />
also exhibit only a small confinement deterioration before Bmax (see Fig.1 <strong>and</strong> Ref.<br />
/1,21). After attainment of Bmax the beta values of these discharges decay to about<br />
0.7Bc <strong>and</strong> often reach a new stationary state at this level(see Section 2). This<br />
saturation near the Bc limit without disruption is a peculiarity of the ASDEX<br />
discharges. Disruptions, however, may occur both during the rise <strong>and</strong> the fall of beta<br />
expecially at values of the cylindrical qa below three.<br />
A Bc limit similar to the one observed in ASDEX <strong>and</strong> other experiments 13,4/ has<br />
been predicted by MHD stability calculations for low m surface kinks /5/ <strong>and</strong><br />
ballooning modes /6/. For parameters <strong>and</strong> profiles of an actual ASDEX discharge<br />
series with Bmax = 0.9 Bc stability was found both with respect to ideal kink modes<br />
(using the ERATO code 121) <strong>and</strong> to ideal ballooning modes (by applying the<br />
criterion in the approximation for circular, concentric magnetic surfaces:<br />
2<br />
2u R q* dp v<br />
M Bt 2 V dr 'M
1.0-<br />
P/Pc.<br />
0.8-<br />
0.6-<br />
0.4-<br />
0.2-<br />
<strong>IAEA</strong>-CN-47/A-VI-2 359<br />
/*, 17005<br />
j<br />
8 468v/ +<br />
oh D<br />
y o<br />
-18 304<br />
-18056<br />
16 981 ^/ * ^18041<br />
+' /¥<br />
>' /•<br />
1*-!— 16 996<br />
,'^£=0.151 [MA]<br />
// ro»-o*<br />
// H-mode<<br />
I I<br />
0-<br />
lp= 270 kA<br />
310 kA<br />
410 kA<br />
Ip = 310 kA<br />
380 kA<br />
a<br />
a<br />
A<br />
•<br />
o<br />
3|P-dE/dt)<br />
bR0 B<br />
FIG. 1. Maximum normalized /3 values (S/0C (from diamagnetic &pX) as a function of normalized heating<br />
power PN = 3 (P — dE/dt)/(b RQB,) for NI heated H mode discharges. Points connected by lines<br />
indicate 0 decrease, after ^max, of the corresponding discharge.<br />
where f(s) is a known function of the shear s =( r/q*) dq*/dr 171, p is the total<br />
pressure, q*= 5Blr 2 /(2jtR0 0J r j{ r dr)[T, m, MA], <strong>and</strong> jt is the toroidal plasma<br />
current density).<br />
After these initial results, stability <strong>and</strong> transport studies of ASDEX divertor<br />
discharges at the 3 limit have been intensified applying refined diagnostics (e.g.<br />
detailed measurements of electron density <strong>and</strong> temperature profiles <strong>and</strong> of Mirnov<br />
<strong>and</strong> soft XR signals) <strong>and</strong> more detailed theoretical analysis. Based on measured<br />
profiles, plasma transport properties have been investigated by means of the PPPL<br />
analysis code TRANSP /8/ <strong>and</strong> of a modified version of the predictive transport code<br />
BALDUR121 (see Sections 2 <strong>and</strong> 3). The pressure <strong>and</strong> current profiles obtained<br />
from transport computations were then used to calculate consistent MHD equilibria<br />
(see Section 4), which were in turn subjected to stability analysis by the 3-D CART<br />
code /10/ (see Section 5) <strong>and</strong> by an exact solution of the ballooning mode equation<br />
(see Section 6).
360<br />
1.5-<br />
PrH0 6 $<br />
GRUBER et al.<br />
1.1 1.3 1.4 Us] 1.5<br />
6.0<br />
/Prdl<br />
[10^]<br />
-4.0<br />
FIG. 2. Time evolution of ft±, central non-inverted chord intensity \prd( of bolometer array <strong>and</strong> central<br />
radiation power density pr obtained by Abel inversion for a DP — D + discharge (No. 17005) <strong>and</strong><br />
two H° — D + discharges (No. 18040, No. 18041) with the same discharge parameter.<br />
2. Current density profile <strong>and</strong> B limit<br />
The p decrease after reaching transiently pc happens on a time-scale of about 30 to<br />
50 ms (see Fig.2). An explanation for this behaviour, advanced in /11/, consisted in<br />
a reduction of the ballooning mode limited beta due to broadening of the toroidal<br />
current density profile with time. In fact, integration of Eq. (1) over the whole<br />
cross-section yields a maximum attainable value of I3qa7e increasing with qa*/q0<br />
/12/ or the internal inductance Ij /11/ but depending only weakly on the finer<br />
details of the current density distribution (here e = a/R0, qa*= q*(a), qo» q(r= 0)).<br />
lndeed,during the high-beta phase, an increase of q0 is indicated by the
<strong>IAEA</strong>-CN-47/A-VI-2 361<br />
disappearance of sawteeth, <strong>and</strong> an Ij decrease can be deduced from magnetic<br />
measurements, although the characteristic time for current diffusion due to<br />
neoclassical resistivity significantly exceeds the time-scale of the R changes.<br />
There are two possibilities for reducing this apparent discrepancy of time-scales.<br />
First, the instability which causes the B limit might also give rise to an anomalously<br />
fast current flattening. Measurements suggest an additional, more classical<br />
explanation. In H mode discharges with Improved energy <strong>and</strong> particle confinement a<br />
central accumulation of metal impurities takes place /1/ yielding strongly peaked<br />
radiation power densities pr. Spectroscopy <strong>and</strong> soft XR diagnostics confirm that the<br />
evolution of the central peak of the bolometric profiles given in Fig. 2 is mainly due<br />
to increasing line radiation of highly ionized iron <strong>and</strong> does not result from density<br />
changes. In 8 limit shots using H° into D + injection the radiated central power<br />
density is smaller (see Figs. 2b <strong>and</strong> 2c), due to particle confinement deterioration<br />
with respect to the D°-> D + discharges of Fig. 2a. Although the central pr values<br />
become comparable to the local beam heating of the electrons, the globally radiated<br />
power rises at most by about 25 % <strong>and</strong> remains always less than one third of the<br />
total heating power. This implies that radiation itself is not responsible for the beta<br />
limitation. But central Zeff values above 4 are easily deduced if iron is assumed to<br />
cause the central radiation losses <strong>and</strong> if the temperature-dependent radiative power<br />
loss function including CX recombination with beam neutrals is applied/13/. This<br />
increase in Zeff at r < 15 cm can explain an enhanced <strong>and</strong> accelerated broadening of<br />
jt: TRANSP calculations in this case predict during the 6 decay of the D°-» D +<br />
discharge an increase of q0 from 1.1 to 1.45 (rather than to only 1.2 as would result<br />
for a fixed Zeff (r, t) = 1.5) <strong>and</strong> an Ij decrease from 1.2 to 1.04.<br />
This postulated influence of impurity accumulation <strong>and</strong> the consequent jt broadening<br />
is supported further by the clear correlation of the central radiation intensity with<br />
the time evolution of beta close to Bmax. For the same values of L, Bj, Ro<strong>and</strong> ne<br />
discharges in which the central radiation increases earlier - this may happen due to<br />
an earlier L to H transition or a longer ELM(edge-localized mode)-free H-phase -<br />
reach only smaller values of G/6C. Subsequently however betas decay to similar<br />
plateau values for both cases(see Figs. 2b <strong>and</strong> 2c). Overall, this time behaviour is<br />
consistent with the conjecture that the plasma stays at a marginal stability limit<br />
governed by current density profiles.
362 GRUBER et al.<br />
3. Transport in H mode discharges close to the B limit<br />
Detailed transport analyses have been carried out for all the discharges indicated in<br />
Fig.1. Input data used were:<br />
the electron density profiles ne (r, t) measured by a 4-channel HCN<br />
laser interferometer <strong>and</strong> a 16-spatial channel multi-pulse Thomson scattering<br />
system which provides profiles every 17 ms,<br />
electron temperature profiles Te (r, t) from 4-channel ECE diagnostic<br />
<strong>and</strong> multi-pulse Thomson scattering,<br />
the ion temperature Tj measured by passive <strong>and</strong> active CX diagnostic,<br />
Doppler broadening of CX recombination lines <strong>and</strong> neutron production rates,<br />
the bolometrically measured profiles of the radiation losses <strong>and</strong> global<br />
parameters like the loop voltage VL, lp, Bp ± = Bp th + Bp ± beam from diamagnetic<br />
flux measurements <strong>and</strong> Bp(( + I/2 with Bp)| =8p th + .5{Bpl beam + Bp|| beam )<br />
deduced from the poloidal fields <strong>and</strong> fluxes. The calculated kinetic pressures include<br />
the contributions due to the anisotropic fast beam ions (pi| beam =2p1 beam ) <strong>and</strong> are<br />
in good agreement with the magnetically measured ones.<br />
Beam-heated H mode discharges staying below I3C show energy replacement times<br />
comparable in magnitude to the ohmic ones (see Fig. 3) with (for q a > 3) a scaling<br />
T E = 0- 1 'pAj [s, MA, Aj = ion mass number] independent of the heating power (see<br />
Fig.1). For these high confinement times <strong>and</strong> consequently high plasma energies the<br />
convective losses Pconv/P =• 5/2rk(Te + Tj)/( G -EO) (with r the particle flux<br />
<strong>and</strong> the medium energy of the injected neutrals) <strong>and</strong> the ion conduction losses<br />
become comparable to the electron conduction losses. So, over a large part of the<br />
plasma cross-section in D° -» D + discharges Pconcj e amount to only between 0.2<br />
(Ip = 310 kA, qa*= 4) <strong>and</strong> 0.35 (lp = 410 kA, qa* = 2.7) of the total heating power<br />
compared to PQQ^ e = (0-5 — 0.65) • P in ohmic <strong>and</strong> L mode discharges /14/. Ion<br />
heat conduction x\ is taken throughout as 3 times the neoclassical value as calculated<br />
by C. Chang <strong>and</strong> F. Hinton for all discharge phases (OH, L, H), which gives the best fit<br />
to the Tj measurements.<br />
In discharges coming close to pc transport analyses confirm that additional energy<br />
losses set in just after Bmax has been reached. This confinement degradation can be<br />
seen by the time evolution of the confinement times in the D° ->• D + discharge
at<br />
0.15<br />
<strong>IAEA</strong>-CN-47/A-VI-2 363<br />
disruption<br />
1.2 13 t[s] 1.4<br />
t.u.- (b) y<br />
3.0-<br />
2.0-<br />
1.0-<br />
0-<br />
0.5 r/Q 1<br />
FIG. 3. (a) Time behaviour of energy replacement times TE* = E/(P — dEldt) with (TE*) <strong>and</strong> without<br />
(TE lh*) fast ions, <strong>and</strong> of thermal energy confinement time rE = E/(Pcond + Pconv) for a EP — D +<br />
discharge (No. 17005).<br />
(b) Evolution of electron thermal diffusivity \e (r, t) for the same discharge.<br />
shown in Fig. 3a. For these discharges the ion heating by the beams, Pbi, exceeds<br />
the electron heating, Pb6| (Pbj < 3Pbe) <strong>and</strong> the beam contributes about 25 % to the<br />
total 6 during the rise phase. The latter fact results in the difference of the x*E<br />
values with <strong>and</strong> without beam contribution. The confinement time xE is defined<br />
including only the conductive <strong>and</strong> convective losses <strong>and</strong> illustrates, when compared<br />
to T*E , the influence of the radiation <strong>and</strong> CX losses.<br />
These additional losses have to be attributed to an enhanced electron heat conduction<br />
<strong>and</strong> partly to the convection associated with the density decrease. This is shown by<br />
the time variation of the radial profiles of the electron heat diffusivity xe given in<br />
Fig. 3b which are found to be nearly time-independent in the H mode during the B<br />
rise phase, but are increased over the whole plasma during the G decrease. As ne <strong>and</strong><br />
Te decrease during the latter phase, this translates only into an approximate<br />
doubling of the electron heat conduction losses, which, at r = 0.75a increase from<br />
450 kW at 1.26 s to 900 kW at 1.38 s. An assumed additional increase of the ion<br />
heat conduction losses by 30 % brings the computed kinetic variation of Bp ^ <strong>and</strong><br />
Bpll + lj/2 in agreement with magnetic measurements.
364 GRUBER et al.<br />
A transport simulation of the H° -> D + discharge (see Fig.2b) by the predictive<br />
BALDUR code reproduces the measured evolution of the ne, Te <strong>and</strong> Tj profiles <strong>and</strong> of<br />
Rp up to the 3 limit if transport scalings derived from H-regime discharges well<br />
below Bg/15/ are applied: Xe H ( r )= 1-3 a 2 / (Ro rn lp) [m 2 / s, m, MA], particle<br />
diffusivity D H (r)=0.4.xe^(r) <strong>and</strong> anomalous pinch velocity<br />
vjn H (r)=-0.5iD H (r)rTe" 1 [m/s, m] (with rn = -n/(3n/ 3r) <strong>and</strong> rTe=<br />
-Tg/( 3Tg/ 3r)). After the attainment of Gmax also here the electron heat<br />
diffusivity in the region r < 0.7a has to be enhanced by a factor of 4 to simulate the<br />
measurements.<br />
4. MHD equilibria for stability analyses<br />
The above transport analyses produce profiles of the total plasma pressure p(r, t) =<br />
p tn + 1/2 (pi| beam +PjL beam ) <strong>and</strong> - by solving the poloidal field diffusion equation<br />
- of the current density profile jt (r, t). These profiles are used to calculate MHD<br />
equilibria whose stability is then analyzed. For given currents in the external<br />
conductors a static plasma equilibrium configuration is uniquely determined, if<br />
profiles of pressure p(V) <strong>and</strong> of the total toroidal current inside a given flux surface<br />
l(V) are prescribed as functions of the volume V enclosed by it. The toroidal current<br />
density can then be described in an unambiguous form as<br />
1 =2TH?{<br />
t *•<br />
1 / R 2 < 1 / R 2 T 1 + B (1 - H R 2 < 1 / R 2 r 1 )] —<br />
1 P J d V (2)<br />
where Bp is a local beta poloidal value given by Gp=dp/d4' • dV/dl, ¥ is the poloidal<br />
magnetic flux <strong>and</strong> < > denotes the usual flux surface average. The corresponding<br />
equilibria are then calculated by using the Garching free-boundary flow equilibrium<br />
code NIVA. In order to make the radial data p(r) <strong>and</strong> l(r) suitable for a use in the<br />
two-dimensional equilibrum calculations we relate the normalized small radius r/a<br />
to the volume V enclosed by a magnetic surface by r/a = (V/Va) 1/2 , where Va is the<br />
total plasma volume.<br />
5. Low m mode stability<br />
Our investigations of low m MHD activity are based on results from Mirnov probe<br />
measurements /15/ <strong>and</strong> two-dimensional soft XR tomography /16/ <strong>and</strong> on their
#18041<br />
' = 7.5 cm<br />
<strong>IAEA</strong>-CN-47/A-VI-2 365<br />
1.2 1.3 1.4 Us] 1.5<br />
r = 30cm /Wv<br />
1.1 1.2 1.3 1.4 1.5<br />
1.2 1.3 14 tCsl 1.5<br />
FIG. 4. Time behaviour of diamagnetic poloidal beta, line integrated soft XR radiation at various<br />
tangential radii <strong>and</strong> Mirnov signals at torus outside.<br />
comparison with stability calculations using the 3-D code CART developed at GA,<br />
which is capable of treating the linear <strong>and</strong> nonlinear evolution of ideal <strong>and</strong> resistive<br />
MHD instabilities at finite Gp^RQ/a.<br />
The measurements show that the observed modes always have a toroidal mode<br />
number n = 1. During the L phase of beam-heated ASDEX discharges a "continuous"<br />
mode develops, whose amplitude decreases after the L to H transition to a low level.<br />
Both an m = 1 (detected by soft XR) <strong>and</strong> an m = 3 componenent (from Mirnov<br />
signals) are present at the same frequency in the range of 10 to 20 kHz (see Fig. 4).<br />
During the H phase ELM's occur IV <strong>and</strong> additionally MHD bursts are observed with<br />
a "fishbone-like" character. The fishbone amplitudes are much smaller than those of<br />
the continuous mode <strong>and</strong> exhibit an m = 3 to 4 structure at lower I3p values
366 GRUBER et al.<br />
(13/Rc
1.2 1.4 1.6 1.8 2.0 R[m]<br />
<strong>IAEA</strong>-CN-47/A-VI-2 367<br />
FIG. 5. (a) Perturbed magnetic flux contours for unstable n = 1 mode of discharge with /3//3c = 0.6.<br />
Full line shows magnetic separatrix <strong>and</strong> dotted line circle where Mirnov coils are seated,<br />
(b) Comparison of calculated magnetic fluctuation amplitude (full line inside, dotted line outside computational<br />
box of (a), with measurements (m — 4 mode: •, m = 3 mode: o ). Hatched region shows<br />
poloidal range covered by probes.<br />
contribution of this mode - if present - to the 6 decrease is hard to state. Finally,<br />
the energy losses due to the ELM's are already present in medium beta H mode<br />
discharges showing no beta decrease <strong>and</strong> are therefore not responsible for the<br />
additional losses at the beta limit.<br />
6. Ballooning mode stability<br />
A ballooning mode stability analysis of true ASDEX equilibria has been done by<br />
solving the corresponding Sturm-Liouville problem for magnetic surfaces with<br />
volume values V e (0 , Va). Written in the form<br />
d<br />
l 0 (3)<br />
the ballooning equation can be conceived as having an explicit dependence on the local<br />
Bp, <strong>and</strong> an implicit one via the coefficients S, C-|, <strong>and</strong> C2 depending on the total<br />
equilibrium. In order to obtain information on the presumably attainable marginal<br />
value we have, based on a given equilibrium configuration, modified the explicitly<br />
appearing local Bp until a marginal solution of equation (3) with a Gp value B^ was<br />
obtained. Fig. 6 shows the calculated beta ratio Bp/BM = p 7p 'M (with ' = d/d¥) as<br />
function of r/a for the already described D° -> D + <strong>and</strong> H° -> D + discharges with<br />
B=6C at the time of 3max.
368 GRUBER et al.<br />
0.2 0.4 0.6 r/Q 1.0 0.2 0.4 0.6 r/tt 1.0<br />
FIG. 6. Radial dependence of pressure gradient p' normalized to marginally stable one p'M, due to<br />
ideal ballooning modes (a(S) criterion: 1, large aspect ratio expansion: 2, exact solution: 3), together<br />
with pressure <strong>and</strong> q profiles used (p = pth + 1/2 (p 1 * 1 + p\ eam ) for a D° ~ D + (No. 17005) <strong>and</strong><br />
a H° - D + (No. 18041) discharge at |3 ;.<br />
Besides the general evaluation of equation (3),we have also performed a large<br />
aspect ratio expansion of the coefficients S.C-) <strong>and</strong> C2. Although assuming circular<br />
flux surfaces we have taken here into account the correct differential displacement of<br />
the magnetic surfaces due to toroidal curvature r/R0, B_ = 2 \io( p- p)/B_ 2 <strong>and</strong><br />
inductivity coefficient k<br />
dA r<br />
A'(r)= — =- - (p +1 /2)<br />
dr R p *<br />
o<br />
with the average being defined by p= 0 J v pdV 7V = 2 of pr 'dr 7r 2 . This treatment<br />
is different from that in /7/ (see eq.(1)), where the quantities a <strong>and</strong> s are the only<br />
free parameters of the problem, as well as from that in ref718/, where a special<br />
functional form of the differential displacement was assumed. Except for the<br />
neighbourhood of the magnetic axis we find the results of our large aspect ratio<br />
expansion in good agreement with those of the complete treatment; both these refined<br />
approaches yield however p'/p'^ values about 20 - 30 % lower than given by the<br />
simple the a = f(s) criterion when p' is in the vicinity of the marginal limit (see<br />
Fig.6). Broader current density profiles having higher qo values are more<br />
(4)
<strong>IAEA</strong>-CN-47/A-VI-2 369<br />
1.20 1.23 1.26 1.29 1.32<br />
FIG. 7. Contours of constant pressure gradient p' normalized to marginally stable onep'M, due to ideal<br />
ballooning modes (large aspect ratio expansion) as a Junction of time <strong>and</strong> normalized radius r/afor a<br />
D° - D + discharge (No. 17005).<br />
susceptible to ballooning instabilities,due to their lower shear <strong>and</strong> vice versa. This<br />
manifests itself for the given p profiles more by a p'/p'^ profile variation than by<br />
an increase of its maximum value, which stays always below 0.9 for 0.8 < q0 < 1.2.<br />
(The differences in the p(r) profiles of Figs. 6a <strong>and</strong> 6b are due to the different<br />
penetration of 40 keV D° <strong>and</strong> H° neutrals).<br />
The time development of the ideal ballooning stability according to our large aspect<br />
ratio expansion in the D° -> D + discharge is illustrated in Fig. 7. At the time of<br />
maximum beta (about 1.26s),the discharge reaches a normalized pressure gradient<br />
P'/P'M = 0.8 in the region 0.5 < r/a < 0.9 This is also the region where the enhanced<br />
plasma losses start according to the TRANSP analysis as demonstrated in Fig. 3b.<br />
During the 3 decrease between 1.28 to 1.38 s, the p'/p'^ = 0.8 region shrinks only<br />
slightly, but the maximum value of p'/p'M stays below 0.9. Using the general<br />
evaluation of equation (3) yields for 0.15 < r/a < 0.85 a region with p'/p'jyj values<br />
between 0.7 <strong>and</strong> 0.85 during the beta decrease. The pressure gradient decreases in<br />
fact, but so does p'^j due to the broadening of the current density profile (the latter<br />
being calculated using classical resistivity <strong>and</strong> the increase in the central Zeff<br />
described in Sect. 2). For discharges with flmax < 0.8 3C the p'/p'^ values remain<br />
significantly below unity with maximum values being smaller than the<br />
corresponding global 6/6c ratio.<br />
In the ASDEX discharges close to the B limit the resistivity is very small but finite<br />
so that, strictly speaking, the modes to be studied are resistive ballooning<br />
instabilities. The influence of these modes <strong>and</strong> resistive interchange modes on the 8<br />
limit was investigated near the plasma axis (r
370 GRUBER et al.<br />
S = tpj/ T^ amounts to 10^ .where TR is the resistive time <strong>and</strong> x^ is the poloidal<br />
AhVen time. For r = 0.1 a <strong>and</strong> mode numbers 20 < n < 40 that are not yet stabilized<br />
by the finite ion Larmor radius effects the critical beta due to resistive ballooning<br />
modes is 25 to 40 % below the ideal MHD limit. It is concluded that the discharges<br />
under investigation are ideal ballooning stable but may be marginal with respect to<br />
resistive ballooning modes with high wave numbers. This would also explain the<br />
near-invariance of the p /p ^ profiles during the B decrease.<br />
7. Summary<br />
The good confinement of H mode discharges has allowed the investigation of the<br />
Bc=2.8lp/(aBt) limit derived on the basis of ideal MHD stability calculations. The<br />
maximum betas are only reached transiently - normally without any disruption -<br />
<strong>and</strong> beta decreases thereafter,saturating at a level of 0.7 to 0.8Bc. Nearly no<br />
degradation of confinement is observed when approaching the limiting p: additional<br />
energy losses not following the usual H mode transport scaling set in near pc<br />
leading to a "hard" saturation. These losses persist, leading to a subsequent decrease<br />
in B,surmised to be a consequence of the reduction in the marginally stable p due to a<br />
flattening of the current density profile. Global MHD modes with m = 6 <strong>and</strong> of<br />
pressure-driven tearing-mode type are observed, but no clear correlation between<br />
their appearance <strong>and</strong> the B development has been identified. Though the B limit<br />
discharges seem to be stable against ideal ballooning modes, resistive ones with high<br />
wave numbers m > 20 might be unstable.<br />
REFERENCES<br />
[1] KEILHACKER, M., et al., in Plasma Physics <strong>and</strong> Controlled <strong>Nuclear</strong> Fusion Research 1984<br />
(Proc. 10th Int. Conf. London, 1984), Vol. 1, <strong>IAEA</strong>, Vienna (1985) 71; KEILHACKER, M.,<br />
et al., Plasma Phys. Controll. Fusion 28 (1986) 29.<br />
[2] BECKER, G., et al., Nucl. Fusion 25 (1985) 705.<br />
[3] STRAIT, E.J., et al., in Controlled Fusion <strong>and</strong> Plasma Heating (Proc. 13th Europ. Conf.<br />
Schliersee, 1986), Vol. 10C, Part I, European Physical Society (1986) 204.<br />
[4] McGUIRE, K., et al., in Plasma Physics <strong>and</strong> Controlled <strong>Nuclear</strong> Fusion Research 1984 (Proc.<br />
10th Int. Conf. London, 1984), Vol. 1, <strong>IAEA</strong>, Vienna (1985) 117.<br />
[5] TROYON, F., et al., Plasma Phys. Controll. Fusion 26 (1984) 209.<br />
[6] SYKES, A., et al., in Controlled Fusion <strong>and</strong> Plasma Physics (Proc. 11th Europ. Conf. Aachen,<br />
1983), Vol. 7D, Part II, European Physical Society (1984) 363.
<strong>IAEA</strong>-CN-47/A-V1-2 371<br />
[7] CONNOR, J.W., et al., Phys. Rev. Lett. 40 (1978) 396;<br />
LORTZ, D., NUHRENBERG, J., Phys. Lett. A68 (1978) 49.<br />
[8] HAWRYLUK, R., in Physics of Plasmas Close to Thermonuclear Conditions (Proc. Course<br />
Varenna, 1979), Vol. 1, Rep. EUR-FU-BRU/XII/476/80, CEC, Brussels (1980).<br />
[9] POST, D.E., SINGER, C.E., McKENNEY, A.M., BALDUR: A One-dimensional Plasma<br />
Transport Code, Rep. 33, PPPL Transport Group, TFTR Physics Group, Princeton, NJ (1981).<br />
[10] LEE, J.K., Nucl. Fusion 26 (1986) 955.<br />
[11] VON GIERKE, G., et al., in Controlled Fusion <strong>and</strong> Plasma Heating (Proc. 13th Europ. Conf.<br />
Schliersee, 1986), Vol. IOC, Part I, European Physical Society (1986) 33.<br />
[12] LACKNER, K., SYKES, A., private communication.<br />
[13] HULSE, R.A., et al., J. Phys., B (London). At. Mol. Phys. 13 (1980) 3895.<br />
[14] GRUBER, O., et al., in Controlled Fusion <strong>and</strong> Plasma Heating (Proc. 13th Europ. Conf.<br />
Schliersee, 1986), Vol. IOC, Part I, European Physical Society (1986) 248.<br />
[15] BECKER, G., Nucl. Fusion 24 (1984) 1364.<br />
[16] KLUBER, O., et al., in Controlled Fusion <strong>and</strong> Plasma Heating (Proc. 13th Europ. Conf. Schliersee,<br />
1986), Vol. IOC, Part I, European Physical Society (1986) 136.<br />
[17] KORNHERR, M., et al., ibid., p. 140.<br />
[18] CHOE, W.H., FREIDBERG, J.P., Phys. Fluids 29 (1986) 1766.<br />
[19] CORREA-RESTREPO, D., Plasma Phys. Controll. Fusion 27 (1985) 565.<br />
DISCUSSION<br />
M. OKABAYASHI: You reported that fishbone instabilities were excited<br />
during beta collapse. What is the actual power input if you include the fast ion losses<br />
due to these fishbone instabilities?<br />
O. GRUBER: We do not observe fast ion losses with the passive charge<br />
exchange energy measurements. So I don't believe that the observed fishbone modes<br />
contribute to the energy loss. Moreover, these modes are also present in discharges<br />
with /3 < 0.7 |3C, showing a dependence of constant /3 on time <strong>and</strong>, therefore, no<br />
increased losses.<br />
K. McGUIRE: The edge relaxation phenomena can cause a large energy loss,<br />
as was pointed out by Dr. Okabayashi 1 . What is the effect of the edge relaxation<br />
phenomena <strong>and</strong> of core radiation on the beta saturation in ASDEX?<br />
O. GRUBER: The total radiated power has no influence on the global balance,<br />
despite the increased central radiation power density. Edge localized modes might be<br />
almost absent before /3max, or are present after the H-transition during the whole beta<br />
increase. This does not affect the beta limit observed in ASDEX discharges. We find<br />
edge localized modes also in the case of power beta values. Their contribution to the<br />
power losses is included in our normal H-mode scaling.<br />
D. OVERSKEI: Can you say what the thermal plasma contribution to the<br />
pressure gradient is? And what is the ratio of pt'herma, to Pcritical as a function of radius?<br />
In addition, how does the fast ion contribution to p ~ {(5) vary in time <strong>and</strong> space<br />
during this relaxation?<br />
Paper <strong>IAEA</strong>-CN-47/A-V-2, these Proceedings, Vol. 1.
372 GRUBER et al.<br />
O. GRUBER: For the D° — D+ injection cases, ^ beam is up to 25% of the total<br />
beta before j8max is reached. Afterwards the beam contribution increases owing to<br />
the decay of the thermal energy content until a new saturation level is reached. The<br />
contribution of p^erma, to p^, is about 70% in the D° — D + cases, having a radial<br />
profile similar to the total p'/pj^. For the H° — D + cases, fast particles are<br />
deposited further inwards <strong>and</strong> the thermal contribution to p' near the centre is<br />
reduced.
BETA LIMIT DISRUPTIONS*<br />
Mingsheng CHU, E.J. STRAIT, J.K. LEE, L. LAO,<br />
R.D. STAMBAUGH, K.H. BURRELL, R.J. GROEBNER,<br />
J.M. GREENE, F.J. HELTON, J.Y. HSU, J.S. KIM,<br />
H. St. JOHN, R.T. SNIDER, T.S. TAYLOR<br />
GA Technologies, Inc.,<br />
San Diego, California,<br />
United States of America<br />
Abstract<br />
<strong>IAEA</strong>-CN-47/A-VI-3<br />
BETA LIMIT DISRUPTIONS.<br />
Temporal behavior of disruptions in the maximal |3, discharges in Doublet III is analyzed<br />
systematically by using ideal <strong>and</strong> resistive MHD models. These discharges disrupt at beta values<br />
predicted by the Troyon-Sykes-Wesson limit. The basic disruption mechanism is identified as the overlapping<br />
of the central sawtooth mixing zone with the edge stochastic zone. This overlap is predicted<br />
theoretically to be greater for more square current profiles <strong>and</strong> also to be enhanced at larger values of<br />
beta. This suggests that in order to find a disruption-free path to high beta, the current profile must be<br />
made broader as beta increases. Eventually, even the broadened profile will become unstable to tearing<br />
modes, at an average beta value lower than that of a profile optimized for stability against ballooning<br />
modes alone, resulting in disruptions. This scenario is consistent with the experimental results.<br />
Discharges which successfully approach the beta limit have a lower internal inductance (broader<br />
profiles) than similar discharges at lower beta. For long periods preceding the disruptions, a significant<br />
portion of the profile is calculated to be at or slightly beyond marginal stability for ballooning modes.<br />
This long stable period argues against the ballooning modes as the cause of the disruption. As beta<br />
increases, the window for avoiding the overlap of the sawtooth mixing zone <strong>and</strong> the edge stochastic zone<br />
becomes narrower, until finally no way can be found to avoid the disruption; this defines the<br />
'operational' beta limit.<br />
1. INTRODUCTION<br />
The maximum achievable fit value is the most important parameter<br />
determining the suitability of the tokamak as an energy producing<br />
fusion device. A number of groups have published first stable regime (3t<br />
scaling laws of the form (3t (%) = C/(MA)/a(m) B (T). The constant<br />
* This is a report of work sponsored by the United States Department of Energy, under<br />
Contract No. DE-AC03-84ER53158.<br />
373
374 CHU et al.<br />
C varies from 2.8 for ideal external kink modes with no wall stabilization<br />
[1] to 4.4 for ideal ballooning modes with optimized profiles [2].<br />
The physical basis for the parametric dependence of this limit has been<br />
elucidated by Wesson <strong>and</strong> Sykes [3] who have pointed out that if tearing<br />
mode stability is taken into account, C is reduced to 2.2 without an<br />
external conducting wall.<br />
Experimentally, a value of C = 3.5 ± 0.5 was obtained in Doublet<br />
III [4] covering a range of elongation 1.0 < « < 1.6 <strong>and</strong> triangularity<br />
—0.1 < 8 < 0.9. Concurrently, the parametric dependence of the experimentally<br />
achievable beta value has been analyzed by Bernard, Helton,<br />
Moore <strong>and</strong> Todd [5]. They used the ideal MHD theory <strong>and</strong> assumed<br />
that the plasma should be stable to both the localized ballooning mode<br />
<strong>and</strong> the external kink mode with an external conducting wall located at<br />
1.5 plasma radius. A scaling law was deduced which explained the limit<br />
of the achievable beta in Doublet III. Experimentally, it is invariably<br />
found in the Doublet III experiments that the plasma ends in disruption.<br />
Because of the narrow range of the theoretical predictions about<br />
the experimental value for C, it is not possible to identify the mode<br />
causing the flt limit disruptions on the basis of the value of C alone.<br />
We must therefore examine the details of the /3t limiting process. We<br />
have carried out such a program of detailed examination of the observed<br />
phenomena leading to the disruption, using both linear <strong>and</strong> nonlinear,<br />
<strong>and</strong> ideal <strong>and</strong> resistive MHD stability calculations for the particular<br />
equilibria obtained in the experiment.<br />
A general pattern emerged in which the probable cause of the fit<br />
limit is the unchecked growth of the m=2,n=l tearing mode shortly<br />
after the last sawtooth. This 2/1 mode growth is caused by the finite<br />
(3 effect of shifting the current centroid <strong>and</strong> steepening the edge<br />
current density gradient, <strong>and</strong> is triggered by the drop of the last sawtooth.<br />
Finite (3 also enhanced the field line stochasticity in the sawtooth<br />
mixing region <strong>and</strong> around the 2/1 isl<strong>and</strong>. In low qt ( 3.5, the ballooning mode stability limit<br />
was violated over a large portion of the inner region of the plasma. The<br />
destabilization of the ballooning modes in the central region is consistent<br />
with the experimental observation from the soft x-ray signal that<br />
the sawtooth mixing region was greatly extended in the last sawtooth<br />
before disruption. It is proposed here that the overlapping of this central<br />
stochastic region with the edge stochastic region centered around<br />
the q=2 surface is the direct cause of the (3 limit disruptions.
<strong>IAEA</strong>-CN-47/A-VI-3 375<br />
2. 0 LIMIT DISRUPTIONS IN DOUBLET III<br />
The /? limits in Doublet III were investigated by stepwise increasing<br />
the neutral beam heating power in consecutive discharges or in the<br />
same discharge until the /3t limit disruption was produced [6]. No specific<br />
operational techniques were successful in trying to prevent these<br />
disruptions except copious gas puffing which degraded TE <strong>and</strong> so limited<br />
the energetically achievable /3. A predisruption interval of 10 to<br />
20 ms preceded the disruption. This interval is initiated by the drop of<br />
the last sawtooth. During the interval, the global energy confinement<br />
becomes poorer, the measured high frequency magnetic perturbation<br />
signals on the Mirnov probe are replaced by the signal of a low frequency<br />
2/1 mode, <strong>and</strong> intense interaction with the limiter ensues with<br />
large signals in the Ha limiter light. Prior to the predisruption interval,<br />
the discharges have increasingly large sawteeth <strong>and</strong> constant heating<br />
efficiency (AW/AP) as the NBI power <strong>and</strong> (3t rise. The current profile<br />
steadily broadens, as evidenced by a decreasing £{.<br />
2.1. Current Profile <strong>and</strong> Beta Optimization<br />
In this section we try to elucidate the importance of plasma current<br />
profile <strong>and</strong> finite f3 effects in determining the maximum achievable ft<br />
value.<br />
We explore first the (3 limit for a specific class of current profiles<br />
for a large aspect ratio circular tokamak. The effect of /3 on the current<br />
profile is temporarily ignored. This problem was first studied by Wesson<br />
<strong>and</strong> Sykes [3]. They emphasized the optimization with respect to all<br />
profiles with fixed q0 <strong>and</strong> qt. In this paper, we aim at underst<strong>and</strong>ing<br />
the generic relationship among profiles which are not yet optimized with<br />
respect to ballooning modes. A convenient parameterization is given by<br />
A is a current peakedness parameter, which is higher for a peaked current<br />
profile. At fixed qo <strong>and</strong> qt, TQ increases slightly with increasing A. P
376 CHU et al.<br />
0.10 -<br />
F/G. 7. (a) Maximum |3/e veri«5 ltfor a class of current profiles, low \ for flat current profile, high<br />
\for square current profile. Shown in the inset are the typical current profiles for X = 2 <strong>and</strong> X = 10.<br />
(b) Location of the q = I surface <strong>and</strong> the 2/1 isl<strong>and</strong> size with q0 as a parameter for different current<br />
peakedness. The enlargement of the 111 <strong>and</strong> 2/1 stochastic regions as a function of @/0c is shown<br />
schematically in the inset.<br />
for a particular current profile for infinite n ideal ballooning mode is<br />
given by [3]<br />
-0.30 1\ , ,<br />
6.0
<strong>IAEA</strong>-CN-47/A-VI-3 377<br />
Shown in Fig. 1 (a) is the /3m versus li, with A as a parameter.<br />
Ae has been fixed at 30, with q0 = 1 <strong>and</strong> Pj = 0. It is observed that<br />
a peaked current profile will admit of a larger /3m value, whereas a<br />
flatter current profile will accommodate a smaller (3m value. With P&<br />
nonzero, the ranges of /3m <strong>and</strong> li are somewhat reduced. If we could<br />
achieve optimization only with respect to the ballooning mode without<br />
an effect on tearing modes, we could aim at peaked current profiles with<br />
large li values.<br />
Shown in Fig. 1 (b) is the location of the q=l surface <strong>and</strong> the<br />
quasilinear m=2 isl<strong>and</strong> size for a qi — 3.05 plasma with P q ~ 0.95,<br />
<strong>and</strong> the sawtooth mixing region has a radius ~-\/2 larger than the q=l<br />
surface. After the sawtooth, the central q rises above 1 to a value of<br />
~1.0 to 1.2. Starting with a current profile with A = 4, which is more<br />
square than the experimental profiles, <strong>and</strong> with central q ~ 0.95, after<br />
the sawtooth there will be an overlapping of the 2/1 isl<strong>and</strong> <strong>and</strong> the<br />
sawtooth mixing region. For a less square current profile (A
378 CHU et al.<br />
3<br />
a z<br />
1.2<br />
-<br />
1.0 -<br />
i- z 0.8 -<br />
o<br />
•<br />
I<br />
0aB/K2.O<br />
0aB/l>3.O<br />
O<br />
°o<br />
w<br />
*>•<br />
•<br />
LIMITER DISCHARGES<br />
*<br />
40
<strong>IAEA</strong>-CN-47/A-VI-3 379<br />
2.2. Detailed Comparison Between Theory <strong>and</strong> Experiment<br />
To further ascertain the fit limit disruption process, a detailed<br />
comparison between theory <strong>and</strong> experiment is necessary. Stability<br />
against ballooning modes [9] was investigated using the stability code<br />
MBC [10]. The current <strong>and</strong> pressure profiles were obtained from the<br />
MHD equilibrium analysis using EFIT [11]. An analysis using equilibria<br />
incorporating kinetic data does not result in substantially different<br />
results. EFIT is an ideal MHD equilibrium code for determining arbitrary<br />
noncircular plasma cross-section <strong>and</strong> current profiles separating<br />
fip <strong>and</strong> £; values. In discharges near the fit limit at high qi > 3.5, the<br />
inner portion (r/a < 0.7 to 0.8) was found to be unstable to high n localized<br />
ballooning modes. Crossing this theoretical threshold was found<br />
to permit the achievement of stationary l{ <strong>and</strong> fit values before the disruption.<br />
The edge region of the plasma [where q(r) > 2] remains stable<br />
to ballooning modes throughout the discharge. For low qi < 3, marginal<br />
stability is reached only just before the disruption, with steadily rising<br />
fit <strong>and</strong> decreasing l{. Modes that were consistent with localization at a<br />
resonant surface (m/n=2/l, 4/2, 6/3) were observed near the fit limit.<br />
This difference in the approach to the maximum fi is shown for<br />
the high qt (~5) discharge 36288 in Fig. 3 (a) <strong>and</strong> for the low qt (~2.6)<br />
discharge 43481 in Fig. 3 (b). It is seen that at low qt the trend of the<br />
ti, fit <strong>and</strong> fi* development does not change until the disruption time,<br />
whereas at high qt all these quantities show that a stationary value<br />
was reached. The achievement of the stationary values of the plasma<br />
equilibria quantities correlates with the ballooning stability criterion<br />
development shown in Fig. 4 for high <strong>and</strong> low qt. At high qt the stability<br />
criterion is violated over a large region for a time much longer than the<br />
energy confinement time, whereas at low qt the stability criterion is only<br />
marginally violated.<br />
A last sawtooth drop initiated the predisruption interval. This last<br />
sawtooth is characterized by an increased size of the sawtooth inversion<br />
region as determined from soft x-ray emission signals. A particularly<br />
large inversion radius enhancement is observed to occur at high qt shots<br />
which violated the ballooning stability criterion. Thus an extended<br />
central mixing zone is produced by this last sawtooth. This predisruption<br />
interval was shorter than the normal sawtooth. The central soft<br />
x-ray signal also fails to rise to a comparable level. These findings support<br />
the hypothesis that in this central mixing zone, flux surfaces did<br />
not completely reform.
380<br />
1.0 -<br />
CHU et al.<br />
500.0 600.0 700.0 800.0<br />
TIME (msec)<br />
Fig. 3a. Behaviour of l{ (internal inductance), /3m (maximum theoretically stable 0J, 0, (toroidal fl),<br />
<strong>and</strong> /3* [= @(aB/I)] for a high q discharge, showing saturation behavior of £;. The vertical line<br />
indicates the time at which the localized ballooning mode threshold is first crossed.<br />
In the predisruption interval, high frequency <strong>and</strong>/or high mode<br />
number MHD activity gives way to a low frequency mode with m = 2,<br />
n = 1 in the magnetic probe data <strong>and</strong> m = 1 in the soft x-ray data.<br />
The details of the experimental data traces are shown in Ref. [6]. After<br />
the last sawtooth, MHD equilibrium code fits indicate that the toroidal<br />
current density gradient <strong>and</strong> the pressure gradient have increased near<br />
q—2 surface. Calculations using the ordinary A' analysis or using the reduced<br />
MHD stability code CART [12] predict that a tearing mode with<br />
dominant m=2,n=l character in ip should be unstable. Shown in Fig.<br />
5 are a typical perturbed magnetic flux function <strong>and</strong> perturbed pressure<br />
patterns. The amplitude of the magnetic perturbation measured<br />
at the Mirnov probes indicates that sizable (~20% of minor radius) 2/1<br />
isl<strong>and</strong>s were excited. In resistive MHD simulations, toroidal <strong>and</strong> 0p coupling<br />
(e/?p ~ 0.4) with continued mode growth induces large field line<br />
stochasticity outside of the q=2 surface which would result in a degradation<br />
in confinement over that region. Poorer edge confinement may<br />
be the cause of the observed enhanced limiter interaction, as indicated
2.0 3<br />
1.0 -<br />
0.0<br />
<strong>IAEA</strong>-CN-47/A-VI-3 381<br />
600.0 700.0 800.0<br />
TIME (msec)<br />
0.900<br />
- 0.800<br />
- 0.725<br />
FIG. 3b. Same as Fig. 3a, showing the corresponding behavior for a low q discharge; no apparent<br />
saturation of li: 13, or 0*.<br />
by the increased level of the i^iim light. This is also correlated with<br />
the fact that the frequency of magnetic perturbations is drastically reduced,<br />
indicating loss of charge by the plasma <strong>and</strong> the resultant poor<br />
angular momentum confinement of the predisruption plasma. Material<br />
recycled from the limiter may cause the edge <strong>and</strong> the 2/1 isl<strong>and</strong> center<br />
to cool. Code simulations with enhanced resistivity in the isl<strong>and</strong> center<br />
give enlarged isl<strong>and</strong> sizes <strong>and</strong> enhanced higher order isl<strong>and</strong> overlapping<br />
in the edge region [13]. It is observed that this enlarged edge stochastic<br />
region can overlap the central sawtooth mixing region [14].<br />
We conclude that there is agreement between experiment <strong>and</strong><br />
theory, confirming that an overlapping of the edge stochastic region<br />
<strong>and</strong> the central sawtooth mixing region is the crucial event that leads<br />
to disruption.<br />
900.0
382 CHU et al.<br />
1.50<br />
1.00<br />
0.50 -<br />
0.00<br />
1.50<br />
1.00<br />
0.50<br />
0.00<br />
(a)<br />
t<br />
1<br />
650 "790<br />
625-<br />
600-<br />
1<br />
_a><br />
M<br />
725.^<br />
575^^"<br />
750<br />
^775<br />
1<br />
0.00 0.25 0.50 0.75 1.00<br />
(b)<br />
j i i 3<br />
0.00 0.25 0.50 0.75 1.00<br />
FIG. 4. Temporal development of P'IP'm as a function of the normalized flux function. P' is the<br />
pressure gradient <strong>and</strong> P^ is the maximum pressure gradient stable to the infinite n ballooning modes.<br />
Times in milliseconds are indicated (a) for a high q, (~ 5) discharge, <strong>and</strong> (b) for a low qt (= 2.6)<br />
discharge.<br />
3. CONCLUSION AND SUMMARY<br />
We have performed systematically an analysis of the sequence of<br />
events leading to the high /? disruptions in the neutral beam heated plasmas<br />
in Doublet III. It is found that the path through which the high f3<br />
values were reached was consistent with avoiding disruption throughout<br />
the experiment, except at the very end.<br />
It is found that the disruption interrupts the process of pressure<br />
<strong>and</strong> profile broadening through which the plasma reaches the ballooning<br />
mode limit. At high q (^>3.5), the pressure gradient was able to develop
-0.044<br />
-0.046 t<br />
<strong>IAEA</strong>-CN-47/A-VI-3 383<br />
0 0.2 0.4 0.6 0.8 1.0 0 0.2 0.4 O.S 0.8 1.0<br />
—m- X —~-X<br />
FIG. 5. Perturbed magnetic flux function <strong>and</strong> pressure distribution from the resistive MHD code CART<br />
computed for the low q discharge 43481 for equilibria during the predisruption period.<br />
to the maximum allowed by the ideal ballooning modes over a large<br />
portion of the plasma interior, whereas at low q (
384 CHU et al.<br />
REFERENCES<br />
[1] TROYON, F., GRUBER, R., SAURENMANN, H., SEMENZATO, S., SUCCI,<br />
S., Plasma Phys. <strong>and</strong> C!ontr. Fusion 26 (1984) 209.<br />
[2] SYKES, A., TURNER, M.F., PATEL, S., in Controlled Fusion <strong>and</strong> Plasma<br />
Physics (11th Euro. Conf. Aachen, European Physical Society), Vol. 7D, Part<br />
II (1983) 363.<br />
[3] WESSON, J.A., SYKES, A., Nucl. Fusion 25 (1985) 85.<br />
[4] STAMBAUGH, R.D., MOORE, R.W., BERNARD, L.C., KELLMAN, A.G.,<br />
STRAIT, E.J., et aJ., in Plasma Physics <strong>and</strong> Controlled <strong>Nuclear</strong> Fusion Research<br />
(Proc. 10th Int. Conf. London, 1984) Vol. 1, <strong>IAEA</strong>, Vienna (1985) 217.<br />
[5] BERNARD, L.C., HELTON, F.J., MOORE, R.W., TODD, T.N., Nucl. Fusion<br />
23 (1983) 1475.<br />
[6] STRAIT, E.J., CHU, M.S., JAHNS, G.L., KIM, J.S., KELLMAN, A.G., et<br />
ai., in Controlled Fusion <strong>and</strong> Plasma Heating (Proc. 13th European Conf.,<br />
Schliersee, 1986), Europhysics Conference Abstracts IOC. Part I, 204.<br />
[7] HINTON, F.L., CHU, M.S., DOMINGUEZ, R.R., HARVEY, R.W., LAO, L.,<br />
et al., in Plasma Physics <strong>and</strong> Controlled <strong>Nuclear</strong> Fusion Research (Proc. 10th<br />
Int. Conf. London, 1984) Vol. 2, <strong>IAEA</strong>, Vienna (1985) 3.<br />
[8] GIERKE, G.V., BECKER, G., BOSCH, H.S., BROCKEN, H., BUCHL, K.,<br />
et a]., in Controlled Fusion <strong>and</strong> Plasma Heating (Proc. 13th European Conf.,<br />
Schliersee, 1986), Europhysics Conference Abstracts IOC, Part I, 33.<br />
[9] CHU, M.S., LAO, L.L., MOORE, R.W., ST. JOHN, H., STAMBAUGH, R.D.,<br />
STRAIT, E.J., TAYLOR, T.S., GA Technologies Rep. GA-A18546, submitted<br />
to Nucl. Fusion.<br />
[10] MOORE, R.W., MBC, A Ballooning Stability Code for Finite Toroidal Mode<br />
Number, GA Technologies Rep. GA-A16234 (1981).<br />
[11] LAO, L.L., ST. JOHN, H., STAMBAUGH, R.D., KELLMAN, A.G., PFEIF-<br />
FER, W., Nucl. Fusion 25 (1985) 1611.<br />
[12] LEE, J.K., Phys. Fluids 29 (1986) 1629; Nucl. Fusion 26 (1986) 955.<br />
[13] KIM, J.S., CHU, M.S., GREENE, J.M., GA Technologies Rep. GA-A18586,,<br />
submitted to Nucl. Fusion.<br />
[14] CHU, M.S., GREENE, J.M., KIM, J.S., LAO, L., SNIDER, R.T., STAM-<br />
BAUGH, R.D., STRAIT, E.J., TAYLOR, T.S., GA Technologies Rep. GA-<br />
A18579, submitted to Nucl. Fusion (1986).<br />
DISCUSSION<br />
O. GRUBER: I would like to mention that we do not have sawteeth during the<br />
H-mode phase of ASDEX, so overlapping of m = 1/n = 1 isl<strong>and</strong>s <strong>and</strong> m = 2/n = 1<br />
isl<strong>and</strong>s is not possible in our beta limit shots. My question is as follows. In the paper<br />
you presented at the 13th European Conference in 1986 it was stated that the ideal<br />
ballooning mode limit is violated only near the plasma centre, whereas it is strongly<br />
stable over the major part of the plasma cross-section. Now you have violation of the<br />
ideal ballooning limit in the outer part of the plasma. How are the different pressure<br />
profiles determined?
<strong>IAEA</strong>-CN-47/A-VI-3 385<br />
Mingsheng CHU: If we use the kinetic hot ion pressure determined directly<br />
from the hot ion deposition profile, then the central pressure gradient becomes very<br />
large <strong>and</strong> seriously violates the ballooning criterion at the centre. This is not very<br />
reasonable. Therefore we use the magnetically determined pressure profile. The<br />
ballooning criterion is only moderately violated. This is more satisfactory. A more<br />
self-consistent hot ion pressure deposition profile is definitely called for.<br />
M.A. DUBOIS: For your conclusions to be valid, you need to measure the<br />
q = 2 isl<strong>and</strong> size, for instance by a full Fourier analysis of the m = 2, n = 1 5B<br />
components measured by the Mirnov coils. Are you sure that such a direct measurement<br />
of the q = 2 isl<strong>and</strong> width using Mirnov coils has been made on Doublet III?<br />
Mingsheng CHU: In Doublet III, the magnitude of the magnetic perturbation<br />
is routinely measured by Mirnov probes located close to the plasma boundary. The<br />
signal measured is compared with the computed magnetic perturbation amplitude at<br />
that particular location in order to determine the m = 2, n = 1 isl<strong>and</strong> size. For<br />
instance, shot 46167 is computed to have an isl<strong>and</strong> size greater than 0.31a at the time<br />
of disruption. The q = 2 surface is at 0.83a, <strong>and</strong> the sawtooth mixing region with<br />
radius = 0.52a remains flat in terms of temperature throughout the predisruption<br />
period, as determined from the soft X-ray emissions.
SAWTEETH AND TEMPERATURE PROFILES<br />
IN TOKAMAKS<br />
D.A. BOYD, R.E. DENTON, J.Q; DONG, J.F. DRAKE,<br />
P.N. GUZDAR, A.B. HASSAM, R.G. KLEVA, Y.C. LEE,<br />
C.S. LIU, F.J. STAUFFER<br />
Laboratory for Plasma <strong>and</strong> Fusion Energy Studies,<br />
University of Maryl<strong>and</strong>,<br />
College Park, Maryl<strong>and</strong>,<br />
United States of America<br />
Abstract<br />
<strong>IAEA</strong>-CN-47/A-VI-4<br />
SAWTEETH AND TEMPERATURE PROFILES IN TOKAMAKS.<br />
A detailed theoretical/experimental study of sawteeth, electron confinement, <strong>and</strong> temperature<br />
profiles in tokamaks has been completed.<br />
1. INTRODUCTION<br />
A theoretical/experimental study of sawteeth, electron confinement, <strong>and</strong><br />
temperature profiles in tokamaks has been completed. Temperature profiles in TFTR<br />
discharges are distinctly trapezoidal (flat in the centre with a constant slope in the<br />
outer regions) at low values of the safety factor at the limiter, qL. For a given qL,<br />
the profiles are insensitive to auxiliary injected power as well as other plasma<br />
parameters. Such profiles result from sawtoothing at the plasma centre with<br />
anomalous cross-field thermal conduction in the outer plasma which depends strongly<br />
on the electron temperature gradient, VTe. Such trapezoidal profiles cause skin<br />
currents to form during the sawtooth cycle. The resulting current profiles produce<br />
compound as well as normal sawteeth <strong>and</strong> enable us to simply explain the many<br />
discrepancies between experimental observations of sawteeth <strong>and</strong> the st<strong>and</strong>ard<br />
Kadomtsev model. A theoretical model of anomalous transport resulting from a short<br />
wavelength VTe driven mode produces the observed scaling of central electron<br />
temperature in TFTR <strong>and</strong> produces profiles in agreement with observations.<br />
2. ELECTRON TEMPERATURE PROFILES IN TFTR<br />
An experimental study of electron temperature profiles in TFTR discharges has<br />
been completed. Measured temperature profiles were normalized by the following<br />
prescription: all minor radial co-ordinates were divided by the limiter radius <strong>and</strong> all<br />
387
388<br />
Q) 1.0<br />
/T— /T(0)<br />
08<br />
04<br />
-1.0 00<br />
r /o<br />
BOYD et a).<br />
LO<br />
FIG. 1. (a) T/T(0) versus r/a for six low qL Ohmic discharges. Here qL = 2.65, 2.65, 2.70, 2.79,<br />
3.39, 3.41; \ndl = 4.8, 6.6, 4.0, 2.1, 2.0 x lO 19 m' 2 ; B = 4.66, 4.66, 4.80, 4.70, 5.81, 3.05 T;<br />
R = 2.59, 2.59, 2.56, 2.57, 2.07, 2.79 m; a = 0.80, 0.80, 0.82, 0.82, 0.41, 0.58 m.<br />
(b) T/T(0) versus r/a for four low qL, neutral beam heated discharges. Here qL = 2.65, 2.65, 2.67,<br />
2.65; \ndt = 6.9, 8.7, 9.9, 9.3 x 10 19 m~ 2 ; B = 4.66, 4.66, 4.83, 4.79 T; R = 2.59, 2.59, 2.49,<br />
2.49 m; a = 0.8, 0.8, 0.83, 0.83 m; the injected power PB = 4.20, 4.26, 10.50, 9.56 MW.<br />
temperatures by the temperature at r = 0, so that graphs of T/T(0) versus r/a could<br />
be produced. Thus the shapes of profiles with very different temperatures <strong>and</strong> limiter<br />
radii could be compared. The profiles were measured with a fast scanning Michelson<br />
interferometer utilizing the second harmonic of the electron cyclotron emission<br />
spectrum [1],<br />
Two basic profile shapes have been identified. The parameter that seems to have<br />
the strongest influence in determining the shape is the limiter safety factor, qL.<br />
The plot of T/T(0) versus r/a for six low qL, ohmically heated discharges is<br />
shown in Fig. l(a). These discharges range over a factor of 2.2 in density, 1.9 in<br />
toroidal field strength, 1.35 in major radius, <strong>and</strong> a factor of 2 in minor radius. The<br />
cylindrical qL's vary from 2.65 to 3.41. The average T/T(0) values are plotted with<br />
the error bars showing the full range of T/T(0) at each r/a. The plot reveals a basically<br />
trapezoidal shape: flat within the sawtooth region <strong>and</strong> then a linear decrease in<br />
temperature until the limiter is approached. The solid line is a trapezoid fitted to the<br />
data.<br />
Figure l(b) shows a similar plot for low qL discharges that are heated by<br />
neutral beam injection. In this case a four shot average is shown. The density varies<br />
by over a factor of 1.4 <strong>and</strong> the injected power varies from 4.2 to 10.5 MW. Although<br />
the density increases by a factor up to 1.4 <strong>and</strong> the temperature up to 1.36 under injection,<br />
the profile shape barely changes (the trapezoid from Fig. l(a) is shown for<br />
comparison).<br />
High <strong>and</strong> mid qL discharges have a different shape. A plot for three high qL,<br />
qL > 7, ohmically heated discharges is shown in Fig. 2(a). The shape shows strong<br />
central peaking <strong>and</strong> from 0.1 < r/a < 0.6 the shape can be fitted with an exponen-
a)<br />
i.o<br />
0.8<br />
T/T(0)<br />
0.6<br />
0.4<br />
0.2<br />
-1.0<br />
r/o<br />
<strong>IAEA</strong>-CN-47/A-VI-4 389<br />
b)<br />
i.o<br />
0.8<br />
T/T(O)<br />
0.6<br />
0.4<br />
0.2<br />
+1.0 -1.0<br />
FIG. 2. (a) T/T(O) versus r/a for three high qu Ohmic discharges. Here qL = 7.47, 7.87, 7.88;<br />
\ndt = 1.0, 1.3, 1.4 x 10' 9 m- 2 ; B = 3.90, 4.72, 4.72 T; R = 2.55, 2.56, 2.56m; a = 0.82, 0.82,<br />
0.82 m.<br />
(b) T/T(0) versus r/a for six mid high qL, neutral beam healed discharges. Here qL = 7.91, 7.88,<br />
4.70, 4.73, 4.72, 4.72; \ndt = 2.2, 3.5, 4.8, 4.9, 4.7, 4.9 x 10 19 m' 2 ; B = 4.72, 4.73, 4.8, 4.8,<br />
4.7, 4.8 T; R = 2.56, 2.55, 2.48, 2.48, 2.48, 2.48 m; a = 0.82, 0.82, 0.83, 0.83, 0.83, 0.83 m;<br />
PB = 4.23, 4.91, 11.0, 10.49, 11.31, 10.42 MW.<br />
tial [2] with a characteristic normalized length of Ar/a = 0.36. Mid qL (~4.7)<br />
discharges are often sawtoothing <strong>and</strong> have a flattened central region, but outside this<br />
region the shape is again exponential with the same characteristic length.<br />
When subjected to neutral beam injection, high <strong>and</strong> mid qL discharges develop<br />
broadened electron temperature profiles. The sawtoothing ceased during injection for<br />
the mid qL discharges <strong>and</strong> so their data could be combined with the high qL data. A<br />
six shot average has been plotted in Fig. 2(b). For these discharges the density varies<br />
by a factor 2.2, the central electron temperature by 1.8, <strong>and</strong> the injected power from<br />
4.2 to 11.3 MW. With high power injection the density increases by a factor of 2.3<br />
<strong>and</strong> the temperature by 1.25. The profile can still be fitted with an exponential, but<br />
the characteristic length is now Ar/a = 0.45.<br />
Over a very broad range of operating conditions TFTR electron temperature<br />
profile shapes have two distinct forms: trapezoidal at low limiter q <strong>and</strong> exponential<br />
at mid <strong>and</strong> high qL. Strong neutral beam heating does not modify the profile shape.<br />
Interestingly, at mid qL with high power neutral beam heating, the electron temperature<br />
drops when the beams turn on; the profile broadens <strong>and</strong> becomes trapezoidal.<br />
When the electrons reheat <strong>and</strong> the temperature saturates the profile is once again of<br />
the exponential form.<br />
3. SAWTEETH<br />
The sawtooth cycle [3] results from the thermal runaway of the plasma column<br />
which causes the central current density J to rise. In the Kadomtsev mode [4] the<br />
r/a<br />
-1.0
390 BOYD et al.<br />
crash occurs when q = rB0/RBe < 1: the m = n = 1 tearing mode grows from the<br />
q = 1 radius until it encompasses the entire central plasma <strong>and</strong> expels the hot plasma<br />
to the outside. Significant discrepancies between the Kadomtsev model <strong>and</strong><br />
experimental observations of sawteeth have been noted. The precursor oscillation<br />
measured prior to the crash could be quite small, indicating that the m/n = 1<br />
magnetic isl<strong>and</strong> was very small [5], Moreover, a successor oscillation is often<br />
seen after the crash [5]. Very short crash times, apparently independent of<br />
resistivity [6, 7], <strong>and</strong> compound sawteeth [8] also did not fit the Kadomtsev model.<br />
We show that in discharges with good central confinement, the current profile<br />
develops a distinct skin current which causes q to fall below one at a finite radius rs.<br />
Compound <strong>and</strong> normal sawteeth are produced which are consistent with the<br />
experimental observations.<br />
We integrate the 2-D reduced resistive MHD equations for helical perturbations<br />
with a self-consistent evolution equation for the electron temperature:<br />
dV 2 ±
(a)<br />
T(0)<br />
(b)<br />
T(0)<br />
T(0.5)<br />
T(0)<br />
T(Q3)<br />
1.7<br />
<strong>IAEA</strong>-CN-47/A-VI-4 391<br />
1.5<br />
0 4 8 12 16 20<br />
t(IO 3 )<br />
1.7<br />
1.5<br />
1.6<br />
1.4<br />
0 3 6 9<br />
t(IO<br />
12 15 18<br />
3 )<br />
,.7<br />
8 12<br />
t(IO 3 )<br />
FIG. 3. Temperature versus time for (a) constant K±, (b) reduced K^ft) <strong>and</strong> (c) reduced KX(0) with<br />
lower resistivity.<br />
such a q profile, all the previously mentioned experimental discrepancies with the<br />
Kadomtsev model can be understood easily.<br />
We first focus on the sawtooth crash. For a q profile of the form shown in<br />
Fig. 4(c) with Aq0 = 0, the helical flux is reversed only in a narrow b<strong>and</strong> Ar<br />
around rs (Fig. 5(a)). Resistivity allows the reversed flux to reconnect as shown in<br />
Fig. 5(b). At this point the tension in the helical field drives the plasma toward the<br />
circular bubble configuration (Fig. 5(c)). Since no topological change in the magnetic<br />
configuration is required for this transition to occur, the formation time of the bubble<br />
is the helical Alfve'n time, T = rA/Aqs. Finally, on the same helical MHD time-scale<br />
the bubble moves to the centre of the plasma column, causing the crash of the central<br />
electron temperature observed experimentally. Detailed MHD simulations of the<br />
crash have been completed for several values of Aqs over a range of resistivity from<br />
10" 4 to 6 x 10~ 7 . The crash velocity Vc from these simulations (points) are<br />
compared with the theoretical value, Vc = Aqsrs/7A (solid curve), in Fig. 6. The<br />
error bars represent the scatter of points over the range of resistivities studied. This<br />
figure confirms that the crash time is given by the helical Alfve'n time, independent<br />
of resistivity. Values of Aqs as small as 0.004 can cause the 50 /xs crash time<br />
recently documented on TFTR [7].<br />
When Aq0 7 s 0 but Aq0 -4 Aqs, the formation of the bubble is essentially<br />
unaffected by the central helical flux. The stronger magnetic field in the bubble<br />
simply pushes aside the weak central flux (Fig. 5(d)), producing a large residual<br />
magnetic isl<strong>and</strong> following the crash. Over a longer resistive time-scale the flux in<br />
16
392<br />
BOYD et al.<br />
00
<strong>IAEA</strong>-CN-47/A-VI-4<br />
a)<br />
b)<br />
c)<br />
FIG. 5. Schematic of evolution of helical flux for current profile with skin currents <strong>and</strong> q(0) — 1 [(a),<br />
(b), (c)J <strong>and</strong> q(0) £ 1 (d).<br />
the residual isl<strong>and</strong> reconnects with that in the bubble <strong>and</strong> the column returns to a<br />
symmetric state. This residual magnetic isl<strong>and</strong> produces the successor oscillations<br />
which are often seen experimentally.<br />
When Aq0 > AqsAr/rs, the helical flux in the central plasma of Fig. 5(d)<br />
exceeds that in the bubble <strong>and</strong> the central temperature does not fall during the crash.<br />
Such a 'subordinate' crash occurs during compound sawteeth. An example of this<br />
phenomenon is shown in Fig. 3(c) from a simulation with rj = 10~ 5 , a = 1,<br />
fi = 2, <strong>and</strong> «i = 100. The third <strong>and</strong> fifth sawteeth are compound with subordinate<br />
crashes occurring near t = 7500 <strong>and</strong> 15 000. Compound sawteeth occur at low edge<br />
q when K±0 <strong>and</strong> 77 are small.<br />
We emphasize that the magnetic isl<strong>and</strong> present prior to the crash can be very<br />
small as shown in Fig. 3(b). Since the area within the closed helical flux is conserved<br />
during the formation of the bubble from Fig. 3(b) to (c), an expression relating the<br />
bubble radius rb to the isl<strong>and</strong> width w of the precursor is easily computed:<br />
w = Tb/2rs. In recent observations of sawtooth crashes on JET, the formation of a<br />
bubble much like that shown in Fig. 5 was observed with no obvious precursor [6].<br />
393
394<br />
3.0 -<br />
2.5<br />
2.0<br />
1.5<br />
1.0<br />
0.5<br />
0<br />
BOYD et a).<br />
/ '<br />
/ i i i i i<br />
1 2 3 4 5<br />
Aq(IO" 2 )<br />
/<br />
i ,<br />
6<br />
FIG. 6. Crash velocity versus Aqs for Aq0 = 0.<br />
However, in their experiment rb ~ rs/3 <strong>and</strong> therefore w ~ rs/18 so that the precursor<br />
would be extremely small. It has been suggested that the pressure driven internal<br />
kink is responsible for the sawtooth crashes in the JET experiment [10]. The competition<br />
between reconnection <strong>and</strong> the pressure driving forces in causing the sawtooth<br />
crash is currently under investigation.<br />
4. A THEORETICAL MODEL FOR ENERGY TRANSPORT<br />
The formation of trapezoidal temperature profiles similar to those observed<br />
on TFTR in our sawtooth simulations with a model cross-field conduction<br />
K± oc I v T I 2 provides strong evidence for the role of the electron temperature<br />
gradient in causing anomalous transport. The electron temperature gradient is known<br />
to be an important source of free energy for instabilities causing such transport. The<br />
electron temperature gradient destabilizes the collisional trapped electron modes.<br />
However, the transport coefficient derived for such modes decreases very rapidly<br />
with increasing r contrary to experimentally inferred xe profiles. Recently we have<br />
found [11] that the electron temperature gradient modes can also destabilize modes<br />
with wavelengths between the electron <strong>and</strong> the ion gyroradii. A systematic study of<br />
the mode in a sheared slab magnetic field geometry together with full gyrokinetic <strong>and</strong><br />
finite beta effects yields modes with a threshold rje = d In Te/d In n = 1.0. Here,<br />
Te is the electron temperature <strong>and</strong> n the density. The mode frequency ranges from<br />
0.05 to 0.4 times the electron diamagnetic frequency u^ = kycTe/eB0Ln where Ln is<br />
the density scale length, <strong>and</strong> ky is the azimuthal wavenumber.<br />
Following a quasilinear theory, the anomalous electron energy coefficient is<br />
estimated to be
5r<br />
.4<br />
.2<br />
<strong>IAEA</strong>-CN-47/A-VI-4 395<br />
.1 .2<br />
F/G. 7. 7/^ verms r;/a: O analytic model; © numerical model; <strong>and</strong> ©. experimental points for<br />
TFTR [12].<br />
Xe = 0.1 C 2 sve7je(l + 1?e)/
396<br />
T/T(O)<br />
1.0<br />
0.8<br />
0.6<br />
0.4<br />
0.2<br />
0<br />
BOYD et al.<br />
/ \<br />
/ \<br />
/ \*<br />
• / \<br />
/, ... i ... A<br />
I .8 .6 .4 .2 0<br />
r/a<br />
.2 .4 .6 .8 I<br />
FIG. 8. T/T(0) versus r/a. Solid line is experimental data from TFTR ECE diagnostic for qL = 3.3,<br />
B = 3.04 T, R = 2.79 m, a = 0.55 m.<br />
T/T(O)<br />
-1.0 -0.5 0.0 0.5 1.0<br />
FIG. 9. T/T(O) versus r/a for qL = 3.0, a = 2.5: © Ohmic profile; © profile with auxiliary heating<br />
deposition profile given by ©; ® profile with auxiliary heating deposition profile given by © .<br />
stop sawtoothing. Experimentally, for TFTR <strong>and</strong> Alcator it is found that the transition<br />
to non-sawtoothing discharges occurs around qL = 7.0. Figure 8 shows a<br />
plot of the normalized temperature T/T(0) against r/a for TFTR from the ECE<br />
diagnostics. The dots correspond to the theoretical profile.<br />
Next, we investigate the influence of auxiliary power on the temperature<br />
profiles. The theoretical expression for xe has been incorporated into the sawtooth<br />
code. The profiles halfway up the sawtooth rise are shown in Fig. 9. Curve 1
<strong>IAEA</strong>-CN-47/A-VI-4 397<br />
corresponds to the Ohmic temperature profile. Curve 2 is the auxiliary heated plasma<br />
temperature profile for the same qL as the Ohmic case <strong>and</strong> an auxiliary power<br />
profile given by curve 2a. The amount of auxiliary power is assumed to be four times<br />
the initial Ohmic power. Curve 3 is the auxiliary heated temperature profile for the<br />
auxiliary power deposition profile given by curve 3a. As can be seen, the only<br />
significant changes in the profile occur inside the inversion radius. These changes<br />
become even more significant as one goes to higher limiter safety factors. Thus for<br />
low qL the present model shows that the electron temperature profiles are nearly<br />
invariant with different heat deposition profiles. However, as one goes to higher<br />
values of the limiter safety factor, the profiles can be modified significantly.<br />
In conclusion, we may summarize that we have derived a transport coefficient<br />
for short wavelength temperature gradient driven instabilities which explain many<br />
facets of ohmically <strong>and</strong> auxiliary heated discharges.<br />
ACKNOWLEDGEMENTS<br />
This work was supported in part by the US Department of Energy. It is a<br />
pleasure for us to acknowledge the support of PPPL <strong>and</strong>, particularly, the TFTR<br />
experimental group.<br />
REFERENCES<br />
[1] STAUFFER, F.J., BOYD, D.A., CUTLER, R.C., MCCARTHY, M.P., Rev. Sci. Instrum. 56<br />
(1985) 925.<br />
[2] FREDRICKSON, E., et al., in Controlled Fusion <strong>and</strong> Plasma Physics (Proc. 13th Europ. Conf.<br />
Schliersee, 1986), Vol. 10, Part I, European Physical Society (1986) 41.<br />
[3] VON GOELER, S., STODIEK, W., SAUTHOFF, N.R., Phys. Rev. Lett. 33 (1974) 1201.<br />
[4] KADOMTSEV, B.B., Fiz. Plazmy 1 (1975) 710; Sov. J. Plasma Phys. 1 (1975) 389.<br />
[5] DUBOIS, M.A., MARTY, D.A., POCHELON, A., Nucl. Fusion 20 (1980) 1355.<br />
[6] EDWARDS, A.W., et al., Phys. Rev. Lett. 57 (1986) 210.<br />
[7] McGUIRE, K., private communication.<br />
[8] PFEIFFER, W., Nucl. Fusion 25 (1985) 673; CAMPBELL, D.J., et al., Nucl. Fusion 26 (1986)<br />
1085; YAMADA, H., et al., Rep. PPPL-2213, Princeton Plasma Physics Laboratory (1986);<br />
KIM, S.B., private communication.<br />
[9] DENTON, R.E., DRAKE, J.F., KLEVA, R.G., BOYD, D.A., Phys. Rev. Lett. 56<br />
(1986) 2477.<br />
[10] WESSON, J.A., Plasma Phys. Controll. Fusion 28 (1986) 243.<br />
[11] LEE, Y.C., DONG, J.Q., GUZDAR, P.N., LIU, C.S., Rep. No. 86-023, Maryl<strong>and</strong> Univ.,<br />
Baltimore (1986).<br />
[12] TAYLOR, G., et al., Nucl. Fusion 20 (1986) 339.
398 BOYD et al.<br />
DISCUSSION<br />
L.E. ZAKHAROV: Have you any comment to make regarding the obvious<br />
contradiction between your theory of internal disruption <strong>and</strong> the TEXTOR q(0)<br />
measurements?<br />
J.F. DRAKE: We are in the process of including toroidal effects in our code.<br />
There are two important points about sawteeth which will need to be carefully<br />
studied. The first point is the competition between the ideal <strong>and</strong> resistive modes. Both<br />
of them will produce similar signatures as far as the experiments are concerned.<br />
Which of them is used in the actual machine remains to be seen. The second point<br />
is the TEXTOR results, which require an appropriate explanation.<br />
O. GRUBER: In Ohmic discharges the time behaviour of the electron temperature<br />
rise when the sawtooth drops is linear <strong>and</strong> in beam heated L-mode discharges<br />
it shows a saturation point. The latter behaviour is not present in your calculated Te<br />
traces. Can you comment on this?<br />
J.F. DRAKE: We do not always have a linear temperature rise. If the confinement<br />
is degraded in the centre of the plasma, the sawteeth distinctly rise. In our first<br />
simulations, all the sawteeth rounded out <strong>and</strong> virtually stopped rising during the rise<br />
phase. At least for the Ohmic case we found we had to reduce the condition in the<br />
centre in order to get the linear rise. And if your confinement is being degraded in<br />
beam heating, you also get saturation of the sawteeth.<br />
R.E. WALTZ: The advantages of the ije mode model for transport when<br />
describing profiles have been emphasized. I think, however, I should point out the<br />
disadvantages of this model in explaining the scaling of the confinement time. Firstly,<br />
the model has an Ohmic confinement time scaling roughly equal to TOH « na 2 Rq, in<br />
contrast to experiments (<strong>and</strong> dissipative trapped electron drift mode scaling), where<br />
it is TOH a naR 2 q. Secondly, <strong>and</strong> more seriously, the model has almost no relation<br />
to the scaling of the auxiliary heated confinement time raux. Thirdly, the model has<br />
weak power degradation, p" 03 , as compared with p~ 06 for the ^ drift mode<br />
scaling. Most importantly, the model has no favourable scaling with field strength<br />
B or current I oc B/q, as distinct from the rj; drift mode scaling, which fails to<br />
explain Taux only by a dimensionless factor.
<strong>IAEA</strong>-CN-47/A-Vn-l<br />
FIRST RESULTS FROM THE HL-1 TOKAMAK<br />
HL-l TOKAMAK GROUP<br />
(Presented by Shangjie Qian)<br />
Southwestern Institute of Physics,<br />
Leshan, Sichuan,<br />
China<br />
Abstract<br />
FIRST RESULTS FROM THE HL-1 TOKAMAK.<br />
The medium sized HL-1 tokamak (major radius R = 102 cm, plasma minor radius a = 20 cm),<br />
operating up to a toroidal field of 2.6 T <strong>and</strong> plasma currents of 150 kA, has produced sawtoothing<br />
plasmas of a line averaged electron density of 3.3 x 10 13 cm" 3 , an average electron temperature of<br />
700 eV <strong>and</strong> a global energy confinement time of 13 ms, without gas puffing. Its electromagnetic system,<br />
including a particularly heavy copper stabilizing shell (thickness d = 5 cm, d/a = 1/4, d/R = 1/20)<br />
<strong>and</strong> closely packed, wedge shaped toroidal field coils, with a comparatively uniform toroidal field <strong>and</strong><br />
well compensated stray fields, ensures maintaining stable discharge currents in equilibrium for a<br />
duration of over 1 s.<br />
1. INTRODUCTION<br />
The HL-1 tokamak has been in exploratory plasma operation for two<br />
experimental run seasons, April to August 1985 <strong>and</strong> May to August 1986. Preliminary<br />
experimental results obtained are reported in this paper.<br />
HL-1 is the largest of the nine small <strong>and</strong> medium sized tokamaks currently being<br />
operated in China (Fig. 1). Its principal parameters are:<br />
Parameter<br />
Major radius, R (cm)<br />
Plasma minor radius, a (cm)<br />
Toroidal field, B, (T)<br />
Plasma current, Ip (kA)<br />
Discharge duration (s)<br />
Toroidal field flat-top (s)<br />
Stray fields in plasma (T)<br />
Toroidal field power supply (MW)<br />
Design value [1]<br />
102<br />
20<br />
5<br />
400<br />
2.5 x 10~ 3<br />
160<br />
Used to date<br />
102<br />
up to 20<br />
0.3-2.8<br />
up to 150<br />
up to 1.04<br />
up to 2.8<br />
~10- 4 B,<br />
up to 66<br />
The HL-1 tokamak is an axisymmetric device of circular plasma minor crosssection,<br />
with inductive current drive <strong>and</strong> Ohmic heating using a 1.75 volt-second flux<br />
swing iron core transformer, a 0.7 MJ capacitor bank, a DC flywheel generator <strong>and</strong><br />
399
400 HL-I TOKAMAK GROUP<br />
FIG. 1. HL1 tokamak.<br />
a 4.5 MJ energy storage inductor pulsed for a flat-top of several hundred milliseconds<br />
[2]. The inner vacuum chamber consists of four sections of bellows<br />
mechanically jointed <strong>and</strong> made of 0.5 mm thick Inconel-type alloy GH39 [3].<br />
HL-1 features: (1) a copper stabilizing shell of record thickness d = 5 cm<br />
(d/a = 1/4, d/R = 1/20), used also as the outer vacuum chamber, which, in combination<br />
with the wedge shaped <strong>and</strong> closely packed B, coils (toroidally 82% to 90%<br />
copper covered, with total copper thickness of 13.6 cm), gives a skin eddy field<br />
diffusion time of well over 0.5 s; (2) a comparatively uniform B, with 0.6% ripple<br />
at the magnetic axis; (3) stray fields (with compensation) of ~10" 4 Bt;<br />
(4) capability of long pulse operation.<br />
2. OPERATING RANGE AND PLASMA PARAMETERS<br />
The present exploratory phase of plasma experiments (1985-1986) aims at<br />
bringing out the basic capability <strong>and</strong> operating regimes of HL-1. To date, HL-1 has<br />
operated its toroidal field in the range of 0.3 to 2.8 T with plasma currents of up to<br />
150 kA.
<strong>IAEA</strong>-CN-47/A-VII-l 401<br />
In summary, for stable discharges in hydrogen, we have obtained:<br />
line averaged electron density, ft,. 0.5-3.3 x 10 13 cm" 3<br />
average electron temperature, Te<br />
700 eV<br />
average ion temperature, T;<br />
~ 300 eV<br />
global energy confinement time, TE<br />
13 ms<br />
effective ionic charge, Zeff<br />
2.5-3<br />
safety factor at limiter, q(a) 2.5-8<br />
The diagnostics in use are magnetic <strong>and</strong> electric probes, bolometers, a 4 mm<br />
microwave interferometer, optical <strong>and</strong> VUV spectrometers, hard X-ray detectors <strong>and</strong><br />
gold-silicon barrier soft X-ray detectors, <strong>and</strong> data acquisition with a computer having<br />
a total storage of about one billion bytes.<br />
The average ion temperatures have been estimated by several methods,<br />
including SIMS analysis of the depth profile of hydrogen atoms implanted in movable<br />
silicon probes; the results, up to about 300 eV, are roughly in accord with the<br />
Artsimovich formula.<br />
The global energy confinement time is given by<br />
rE = W/(Pn - dW/dt), W = 37r 2 Ra 2 n, (Te + Tj)<br />
The experimental values, increasing with q(a), ranged from 3 to 13 ms. For medium<br />
Zeff, medium radiation power <strong>and</strong> sawtoothing discharges with which we have been<br />
working, adopting Goldston's values [4] for the exponentials of R <strong>and</strong> a, we find the<br />
following scaling:<br />
xE(ms) = 7.9 x 10~ 6 n^ 8 (10 13 cm" 3 ) R 204 (cm) a io4 (cm) q O8 (a)<br />
The average electron temperatures are found to scale with Ip/nea 2 .<br />
3. DISCHARGE CHARACTERISTICS: TRANSIENT ELECTROMAGNETICS<br />
After a great deal of breakdown experiments, field adjustments <strong>and</strong> vacuum<br />
conditioning [5, 6], some 2400 tokamak discharges have been documented<br />
preliminarily. They fall into two categories:<br />
(1) regular discharges, more than 95% of all shots;<br />
(2) disrupted <strong>and</strong> irregular discharges.<br />
The regular discharges were the well adjusted <strong>and</strong> properly driven discharges.<br />
They are stable, well centred <strong>and</strong> reproducible for each fixed set of operating<br />
conditions. Figure 2 gives a historical sketch of the improvement in plasma currents.
402 HL-1 TOKAMAK GROUP<br />
150 kA (1 Aug. 1986)<br />
0 20 40 60 80 100 120 140 160 180<br />
t (ms)<br />
No. 754<br />
FIG. 2. Improvements in HL-1 plasma current.<br />
, transformer primary current<br />
U, loop voltage<br />
-2<br />
100 200<br />
100<br />
t (ms)<br />
t(ms)<br />
FIG. 3. Typical discharge in HL-1 (No. 754, hydrogen filling pressure = 8.5 x 10 ton,<br />
B, = 2.0 T).<br />
A typical discharge is shown in Fig. 3. Each of these discharges consists of a<br />
fast current rise of 4 to 24 ms, usually with a slight overshoot, a current plateau of<br />
150 to 200 ms, then turning into a stable, long decay of a duration that varies between<br />
300 <strong>and</strong> 800 ms, finally terminated by loss of equilibrium. The whole discharge<br />
lasted for about 500 ms to 1040 ms.<br />
The plasma current rise <strong>and</strong> plateau of these discharges were similar in pulse<br />
shape <strong>and</strong> duration, varying somewhat with the individual operating condition. The<br />
reproducibility <strong>and</strong> the similarity between the discharge currents during the 200 ms<br />
rise <strong>and</strong> plateau indicate that they were determined inherently by the electromagnetic<br />
system of the device.<br />
The HL-1 plasma equilibrium is maintained by a set of quasi-DC (25 s) externally<br />
located vertical field coils, a set of fast pulsing internally located vertical field<br />
coils, <strong>and</strong> the copper shell <strong>and</strong> surrounding conductors. The toroidally directed
0.4<br />
0.3<br />
0.2<br />
0.1<br />
<strong>IAEA</strong>-CN-47/A-VH-l<br />
0.5<br />
ne R/BT(1O13T- 1 -cm" 2 )<br />
FIG. 4. Experimentally determined stable operation regime of HL-1. (A) runaway boundary, not<br />
determined; (B) low q operation boundary; (C) high density operation boundary; (D) low q operation<br />
boundary with gas puffing.<br />
discharge current <strong>and</strong> all its surrounding conductors form a poloidally close coupled<br />
system, the secondary of the Ohmic transformer. The transformer primary power is<br />
fed into <strong>and</strong> drives the plasma current Ip. During the fast current rise, because<br />
of dlp/dt, the main eddy currents in the copper shell, etc., are established<br />
simultaneously. By the end of the plateau, the iron core has exhausted its volt-seconds<br />
<strong>and</strong> begins working as an air core. The transformer primary circuit keeps on<br />
inputting, but much less effectively, some power into the discharge current up to over<br />
a second.<br />
After the plateau, the discharge current, essentially, decays freely, its detailed<br />
shape being modified by the specific electron velocity distribution <strong>and</strong> current<br />
profile. Experimental indications are that there is a strong component of runaway<br />
electrons in many of the regular discharges.<br />
4. STABILITY<br />
The MHD behaviour in HL-1 has been surveyed by using multi-location<br />
magnetic probes with Fourier analysers, <strong>and</strong> hard <strong>and</strong> soft X-ray detectors.<br />
Figure 4 shows the experimentally determined stable operation regime<br />
for HL-1.<br />
Figure 5(a) shows a sawtooth oscillation with a period of 0.9 ms. The relations<br />
rs(cm) = 0.5 a(cm)/q' /i (a) <strong>and</strong> rs(ms) = n^ (10 13 cm" 3 ) r^(cm) R(cm)<br />
1.0<br />
2.5<br />
3<br />
4<br />
5<br />
q<br />
403
404 HL-1 TOKAMAK GROUP<br />
r=8.2 cm<br />
r=-2.7 cm<br />
No. 1569<br />
U, loop voltage<br />
Sx, X-ray (arb. units)<br />
FIG. 5. Sawtooth oscillations from soft X-ray data: (a) steady sawtooth oscillation (No. 1569,<br />
hydrogen filling pressure = 8 x 10~ 4 ton, B, = 2.0 T); (b) changeover of sawtooth oscillations<br />
with internal disruption, accompanied by m — 1 disturbance (No. 1871, hydrogen filling<br />
pressure = 6 x 10~ 4 torr, B, = 2.5 T). Negative value of minor radius refers to inboard position.<br />
give 0.74 ms. Figure 5(b) shows the changeover of a sawtooth oscillation into<br />
another one, with larger amplitude <strong>and</strong> about twice the period. The event was marked<br />
by the occurrence of an internal disruption, accompanied by a growing m = 1<br />
disturbance.<br />
Weak instabilities developed in a number of discharges. These usually occurred<br />
near the end of or after the plasma current plateau. Some of them were observed to<br />
be associated with m = 2 or m = 2 <strong>and</strong> m = 3 precursors, appearing during the<br />
current rise. There were only rarely m = 3 precursors alone.<br />
In general, we may state that the MHD activities were observed to be impurity<br />
related. However, for operating densities of up to 3.3 X 10 13 cm~\ very few<br />
discharges terminated in major (hard) disruptions. These occurred when a new<br />
movable limiter was put in without careful precleaning or when the horizontal fields<br />
were accidentally or intentionally off adjustment.<br />
140<br />
t (ms)<br />
160
5. CONCLUSIONS<br />
<strong>IAEA</strong>-CN-47/A-VH-l 405<br />
We arrive at the following conclusions concerning HL-1:<br />
(1) Engineering performance, fabrication <strong>and</strong> assembly of the device prove to<br />
be gratifying, meeting <strong>and</strong>, in some respects, even surpassing the design<br />
requirements.<br />
(2) Exploratory plasma operation has demonstrated the basic capability of<br />
HL-1 as designed <strong>and</strong> has provided a range of good plasmas for subsequent physics<br />
investigation.<br />
(3) HL-1 could be a suitable device for studies of current drive by combining<br />
its inductive drive <strong>and</strong> long pulse capability with non-inductive drives, e.g. to study<br />
the production <strong>and</strong> evolution of suprathermal electron populations <strong>and</strong> profile effects.<br />
(4) Heavy conducting surroundings over a tokamak plasma, in conjunction with<br />
fine plasma profile control <strong>and</strong> adjustment, might offer some interesting possibilities<br />
for confinement experiments.<br />
ACKNOWLEDGEMENTS<br />
The authors gratefully acknowledge the design <strong>and</strong> construction of HL-1 in the<br />
former HL-1 Division headed by He Chengxun; the diagnostics from the former<br />
Experiments Division led by Sun Xiang; early conceptual framework as established<br />
by Gu Yongnian's group. Numerous workers both inside <strong>and</strong> outside SWIP have<br />
contributed to this project.<br />
REFERENCES<br />
[1] LI, Zhengwu, in Controlled Fusion <strong>and</strong> Plasma Physics (Proc. 9th Europ. Conf. Oxford, 1979),<br />
Inv. Papers, UKAEA, Culham Laboratory, Abingdon (1979) 485.<br />
[2] ZE, M.R., CHENG, J.S., in Fusion Engineering (Proc. 11th Symp. Austin, TX, 1985), IEEE,<br />
New York (1986) 707.<br />
[3] ZHU, Y.K., et al., J. Nucl. Mater. 128&129 (1984) 784.<br />
[4] GOLDSTON, R.J., Plasma Phys. Controll. Fusion 26 (1984) 87.<br />
[5] LI, G.D., et al., Nucl. Fusion Plasma Phys. 6 (1986) 23 (in Chinese).<br />
[6] YANG, H.R., et al., in Plasma-Surface Interactions in Controlled Fusion Devices (Proc. 7th Int.<br />
Conf. Princeton, 1986), Paper 8.6.
TOKAMAK CURRENT DRIVE<br />
VIA AC MAGNETIC HELICITY INJECTION<br />
P.M. BELLAN, P.C. LIEWER<br />
California Institute of Technology,<br />
Pasadena, California<br />
J.M. FINN, T.M. ANTONSEN, Jr.<br />
Laboratory for Plasma <strong>and</strong> Fusion Energy Studies,<br />
University of Maryl<strong>and</strong>,<br />
College Park, Maryl<strong>and</strong><br />
United States of America<br />
Abstract<br />
<strong>IAEA</strong>-CN-47/A-VII-2<br />
TOKAMAK CURRENT DRIVE VIA AC MAGNETIC HELICITY INJECTION.<br />
With AC helicity injection, low frequency modulations of toroidal <strong>and</strong>/or poloidal magnetic fields<br />
produce an effective steady DC toroidal electromotive force which can sustain a DC toroidal current.<br />
Both toroidal-poloidal <strong>and</strong> poloidal-only modulation schemes are discussed. For the toroidal-poloidal<br />
scheme, analysis (in both one-dimensional <strong>and</strong> axisymmetric toroidal geometry) of the effect of the<br />
motion of the plasma-vacuum boundary shows that this motion may largely cancel the DC electromotive<br />
force. Thus, if toroidal-poloidal helicity injection is to work, there must be (i) no moving boundary or<br />
(ii) a less symmetric geometry. A low power toroidal-poloidal experiment (Caltech Encore tokamak)<br />
shows a change AI in plasma current that is dependent on toroidal-poloidal phasing, but, because of<br />
an offset, AI is always negative. The poloidal-only scheme is based upon the experimentally observed<br />
anomalous skin penetration during the startup phase of tokamaks. Analytic <strong>and</strong> numerical results indicate<br />
feasibility, <strong>and</strong> scaling of steady state current <strong>and</strong> power dissipated with frequency <strong>and</strong> plasma<br />
resistivity is presented. This scheme is potentially more efficient in terms of current generated per unit<br />
power dissipated than other current drive schemes. It is shown that the resistive MHD activity responsible<br />
for anomalous current penetration (<strong>and</strong> therefore required for the success of this current drive<br />
scheme) must be fully three-dimensional. A comparison of the effectiveness of this scheme with that<br />
of F-G pumping in reversed field pinches is presented.<br />
1. INTRODUCTION<br />
AC magnetic helicity injection has been recently proposed [l]-[3] as a<br />
method for obtaining steady state toroidal current drive. This method utilizes<br />
AC modulations of the poloidal <strong>and</strong>/or toroidal magnetic fields at very low frequencies<br />
(G)«a>c;). Modulations of a few percent at frequencies of 10 1 -10 2 Hz<br />
could drive the current in a fusion reactor provided there is anomalous current<br />
penetration. In this paper we discuss both toroidal-poloidal modulation<br />
schemes (Caltech authors, Sections 2-3) <strong>and</strong> poloidal-only schemes (U. Maryl<strong>and</strong><br />
authors, Section 4).<br />
407
408 BELLAN et al.<br />
2. EFFECT OF A MOVING BOUNDARY ON HELICITY INJECTION<br />
Bellan [4] interpreted toroidal-poloidal AC helicity injection as resulting<br />
from the beating of two normal modes of the tokamak plasma: (1) modulation<br />
of the plasma minor radius driven by toroidal field modulation <strong>and</strong> (2)<br />
classical resistive diffusion (having skin depth penetration) driven by poloidal<br />
field modulation. This beating would produce a DC toroidal emf which could<br />
drive a DC toroidal current. The process was strictly one-dimensional (radial<br />
dependence only) <strong>and</strong> the resulting DC toroidal current was predicted to be a<br />
skin current; reconnection (a three-dimensional process) would be necessary<br />
to make the skin current penetrate.<br />
References [l]-[3] implicitly assumed that plasma continuously filled<br />
the vacuum chamber right up to the wall. Yet, Ref. [4] showed that toroidal<br />
modulation should compress the plasma minor radius, so that plasma should<br />
detach from the wall, leaving behind a vacuum region. We have studied [5] the<br />
effect of the motion of the plasma-vacuum boundary using a one-dimensional<br />
slab model <strong>and</strong> found that this motion makes the current drive significantly<br />
less than predicted by Refs [l]-[4].<br />
To obtain the one-dimensional slab model, zero-pressure resistive<br />
MHD equations in rectangular coordinates were used with x (radial) dependence<br />
only. The radial velocity Ux of the plasma was the £*xB* velocity associated<br />
with the time-varying, but spatially uniform, toroidal field (long<br />
wavelength limit of the compressional Alfven wave). The evolution of the<br />
total (DC plus AC) poloidal magnetic field By(x,t) was described by<br />
This equation is valid only in the plasma, but not in the adjoining vacuum<br />
region. By including oscillation of the plasma boundary, this model conserves<br />
total plasma throughout the cycle. To complete the model, equations for By in<br />
the vacuum region between the plasma <strong>and</strong> the wall <strong>and</strong> in a region<br />
corresponding to the central hole of a tokamak are also included. By cannot be<br />
specified at the wall because it contains an unknown DC component. Instead,<br />
the current in the external poloidal field coil is specified, which then gives a<br />
jump in By(x,i) at the coil.<br />
The solution of this system of equations <strong>and</strong> boundary conditions<br />
shows that the driven DC poloidal magnetic field scales as ByBj Bo <strong>and</strong> thus,<br />
the driven DC poloidal field is always much smaller than By. This is in contrast<br />
to the expectations of Ref. [4] which suggested that the driven DC<br />
poloidal field could be comparable to or larger than By. When Eq. (1) was
<strong>IAEA</strong>-CN-47/A-Vn-2 409<br />
solved with the effect of the moving boundary neglected (e.g. assuming<br />
plasma filled the region up to the wall throughout the oscillation cycle), then a<br />
significantly larger DC poloidal field was obtained. Note that plasma is not<br />
conserved when the moving boundary is neglected. In a real plasma experiment<br />
there is never a true vacuum region between the plasma <strong>and</strong> the wall<br />
because of ionization <strong>and</strong> cross-field diffusion. However, this plasma is likely<br />
to be highly resistive <strong>and</strong> thus the vacuum treatment may be more realistic.<br />
The importance of a moving boundary is also manifested [6] by an<br />
apparent discrepancy between the helicity conservation equations of Jensen<br />
<strong>and</strong> Chu [3]<br />
<strong>and</strong>ofMoffatt[7]<br />
— + U$'(0 + E?xX) = - 2\t\T'•&d i r (2)<br />
at<br />
— + \dS •£*( - X-&) = r\\d 3 r (if- V 2 ^ + X- V 2 B*) (3)<br />
dt<br />
which turn out to differ by a Lagrangian (i.e. moving boundary) term. Using<br />
Moffatt's equation (which incorporates a moving boundary) it is possible to<br />
show [6] that no DC current can be driven in an axisymmetric plasma having<br />
circular flux surfaces. It is still possible to inject net helicity in this situation,<br />
but the injected helicity does not drive DC currents because it is exactly consumed<br />
by the increase in helicity dissipation associated with the oscillating<br />
fields producing the injected helicity.<br />
It is crucial to find whether (i) non-conservation of plasma makes it<br />
possible for the plasma to be compressed without producing a moving<br />
plasma-vacuum boundary, or (ii) non-axisymmetric mode structures would<br />
allow helicity injection in excess of the increased helicity consumption associated<br />
with the modes, because then the optimistic predictions of Refs [l]-[4]<br />
would hold.<br />
3. EXPERIMENTS<br />
Experimental studies of helicity injection are underway on the Caltech<br />
Encore high repetition rate research tokamak. Typical parameters are: H<br />
plasma, n-IO 12 cm" 3 , Tj-l-lO eV, re-5-15 eV, B-100-300G, 7-1-3 kA, shot<br />
duration 1-3 msec, repetition rate 10-30 shots/sec, R =38 cm, a=10 cm,<br />
poloidal <strong>and</strong> toroidal modulations 1-10% at 24 kHz, gap long way around in<br />
one torus quadrant.<br />
Preliminary results, obtained at low power using signal averaging techniques,<br />
indicate a change in plasma current A/ dependent on the relative phas-
410 BELLAN et al.<br />
ing of the toroidal <strong>and</strong> poloidal modulations. However, A/ always has a negative<br />
offset so that only phase-dependent reductions in plasma current are<br />
observed. In agreement with theoretical prediction, the phase dependence flips<br />
sign when the DC toroidal field is reversed. However, for certain values of<br />
plasma current or toroidal field, the flipping of sign fails to occur (this is associated<br />
with a resonance in A/).<br />
4. CURRENT DRIVE USING POLOIDAL FIELD MODULATION ONLY<br />
Motivated by the phenomenon of anomalous current penetration during<br />
tokamak startup, we investigate theoretically whether steady state current can<br />
be driven by oscillating the poloidal (Ohmic heating) coils only. If double<br />
tearing modes indeed cause anomalous penetration, the induced skin current<br />
parallel to the bulk current may penetrate anomalously, whereas the skin<br />
current induced in the other half of the cycle should be stable to tearing modes,<br />
<strong>and</strong> so penetrate only classically. This scheme is related to helicity injection<br />
by toroidal-poloidal modulation [l]-[3] (also called F-9 pumping), but has the<br />
advantage that only one field (poloidal) is modulated. In the present scenario,<br />
the injected helicity is provided by the relaxations that are assumed to occur<br />
preferentially in one part of the cycle. This scheme is inherently low frequency<br />
because full nonlinear resistive MHD activity must occur within one<br />
cycle.<br />
In our model the plasma is treated classically throughout the quiescent<br />
part of the cycle, in ID (cylindrical) geometry. The double tearing<br />
activity is idealized by flattening the j, profile (q profile) while conserving the<br />
magnetic helicity <strong>and</strong> the poloidal flux at the plasma edge, i.e. the flux linking<br />
the torus. The toroidal flux is assumed to remain constant throughout the process.<br />
Using this model it can be shown, by analytic <strong>and</strong> numerical means, that<br />
steady state current can indeed be driven, i.e. that no oscillation of the toroidal<br />
field is required. From the point of view of helicity injection, current can be<br />
driven against resistive decay, even though no helicity is injected by external<br />
circuits, forthe following reason: when the skin current induced by the oscillating<br />
OH is negative, i.e. opposite to the main current, the rate of change of<br />
helicity dKldt = -l\i?'&dV is positive. On the other half of the cycle, the skin<br />
current penetrates, conserving helicity, so that the net change due to resistive<br />
decay of skin currents is positive.<br />
The scaling of this scheme with frequency <strong>and</strong> resistivity can be<br />
estimated as follows. Balancing the resistive decay of helicity with the injection<br />
of helicity due to the decay of skin current, we find
<strong>IAEA</strong>-CN-47/A-Vn-2 411<br />
_ p<br />
Thus, for a given flux swing y the mean current Tp increases as the square root<br />
of frequency. The mean current is also enhanced if the edge resistivity r\c<br />
greatly exceeds the average resistivity . Here, a is the minor radius. If the<br />
flux swing v is the limiting factor, the optimum frequency is the highest frequency<br />
for which the double tearing modes can completely reconnect in one<br />
cycle. The ratio of the mean current to the magnitude of the oscillating skin<br />
current can also be estimated to be Tpl l/~ I ~T|e/ , which is independent of<br />
frequency <strong>and</strong> can be made large if the edge resistivity is considerably higher<br />
than the average. The scaling for Tpl P, the ratio of steady state current driven<br />
to the power deposited, can be obtained by similar arguments. The power<br />
deposited in the plasma is P =\i?>d?-ridS ~®fp\fL, where L is the plasma length<br />
L=2idt. Therefore, we find<br />
P %L<br />
Tp<br />
where A, =V-qe/ w is the skin depth. Recalling that PII for Ohmic heating is<br />
IpRI Ip~IpLl na 1 , we see that the power dissipated in oscillating current<br />
drive, compared to pure inductive (OH) current drive producing the same<br />
current, scales as O/ (A,ne). This dissipation is not much larger than pure<br />
Ohmic dissipation.<br />
We have also investigated whether anomalous skin penetration <strong>and</strong> any<br />
oscillating current drive scheme based upon it can be due to single helicity mln<br />
modes, behaving as exp(/m 8- in ij»), where 6,4> are poloidal <strong>and</strong> toroidal angles,<br />
respectively, or whether multiple helicity (3D) effects are required. We conclude<br />
that single helicity activity with mS2 cannot explain the results <strong>and</strong> such<br />
activity with m = 1 modes is unlikely to do so. This conclusion is based upon<br />
the observation that the £7xB* term for modes with m>2 cannot change the flux<br />
at the magnetic axis (the Cowling theorem). Modes with m=\ can experience a<br />
change in flux at the magnetic axis, by Kadomtsev reconnections, but double<br />
Kadomtsev reconnections reduce the flux at the axis. That is, if anomalous<br />
current penetration is due to resistive MHD modes, fully three-dimensional<br />
behavior is required. Thus, magnetic surfaces may not exist in some areas in<br />
the plasma. This may lead to a natural flattening of the current profile, but may<br />
also allow transport of heat along ergodic magnetic field lines. It is an open<br />
question whether this latter phenomenon may lead to very poor energy<br />
confinement or whether the region of destroyed magnetic surfaces may be<br />
confined to a part of the plasma volume.
412 BELLANetal.<br />
It is interesting to compare this oscillating current drive proposal for<br />
tokamaks to F-0 pumping for RFP's. As we have discussed, the former<br />
scheme depends upon preferential MHD relaxation activity in one part of the<br />
cycle, whereas the latter scheme depends upon external injection of<br />
helicity. The helicity absorbed by the plasma in a cycle in F-9 pumping is<br />
&Kdp =47t 2 z.ev*, where \j/ <strong>and</strong> o are the amplitudes of the oscillating poloidal<br />
<strong>and</strong> toroidal fluxes, respectively. Also, e is an efficiency factor that is typically<br />
somewhat less than unity <strong>and</strong> depends critically upon the edge resistivity <strong>and</strong><br />
the number of relaxations per cycle [8]. This efficiency is related to the loss of<br />
helicity in F-0 pumping due to decay of skin currents. On the other h<strong>and</strong>,<br />
for this tokamak scheme, the helicity injected is of order<br />
A^tok =4n 2 LflJa\jWCn(a)/
STUDY OF ENHANCED CONFINEMENT<br />
AND q = 2 DISRUPTIVE MODES<br />
WITH FAST RISING CURRENT<br />
IN THE STOR-1M TOKAMAK<br />
H. KUWAHARA, 0. MITARAI 1 , E.J.M. VAN HEESCH,<br />
M. EMAAMI, A.H. SARKISSIAN, S.W. WOLFE,<br />
A. HIROSE, H.M. SKARSGARD<br />
Plasma Physics Laboratory,<br />
University of Saskatchewan,<br />
Saskatoon, Saskatchewan,<br />
Canada<br />
Abstract<br />
<strong>IAEA</strong>-CN-47/A-VII-3<br />
STUDY OF ENHANCED CONFINEMENT AND q = 2 DISRUPTIVE MODES WITH FAST<br />
RISING CURRENT IN THE STOR-1M TOKAMAK.<br />
The STOR-1M tokamak can operate in three different modes — as a normal tokamak, as a<br />
tokamak with a fast current pulse superimposed on the normal plasma current, <strong>and</strong> as an AC tokamak.<br />
Magnetohydrodynamic activity is observed during the fast pulse which gives access to q(a) as low as<br />
1.5. The fast pulse also produces delayed increases in density <strong>and</strong> temperature, possibly as a result of<br />
improved containment properties due to current profile modification. Recent results on AC operation<br />
with gas puffing are also presented.<br />
I. INTRODUCTION<br />
STOR-1M is a small tokamak in which a fast current pulse<br />
(~20 ysec duration) can be superimposed on the normal plasma<br />
current. The current pulse provides turbulent heating of the<br />
plasma. In addition it can provide a rapid variation of q(a)<br />
over a wide range, passing quickly through q-values that would<br />
normally lead to termination of the discharge. MHD activity<br />
can thus be observed on this fast time-scale, particularly in<br />
the important q=2 range. In addition, the fast pulse can provide,<br />
on a longer time-scale governed by the magnetic diffusion<br />
time, a modification of the current density profile which can<br />
influence the plasma properties. Finally, the ST0R-1M tokamak<br />
has also been operated in an AC mode; recent results on the<br />
beneficial effects of gas puffing on the AC operation are<br />
included in this report.<br />
1 Department of Electrical Engineering, Kumamoto Institute of Technology,<br />
4-22-1, Ikeda, Kumamoto 860, Japan.<br />
413
414<br />
MAGNETIC<br />
COILS<br />
PHOTO TUBE<br />
<strong>and</strong> 4mm<br />
MICROWAVE<br />
INTERFEROMETER<br />
KUWAHARA et al.<br />
o<br />
«m HARD X-RAY<br />
VISIBLE LOOP SOFT X.RAY 0ETECT0R (|)<br />
0 E T K T O R<br />
SPECTROMETER \ DETECTORS<br />
VIEWING W / / <<br />
DUMP<br />
POSITION GAS SUPPLY"<br />
SENSING COILS ^vni<br />
GAUGE<br />
TMP<br />
LIMITER<br />
HARO X-RAY<br />
DETECTOR (2)<br />
FIG. 1. Schematic diagram of the STOR-1M tokamak including diagnostics.<br />
ST0R-1M has major <strong>and</strong> minor radii of 22 cm <strong>and</strong> 3.5 cm<br />
respectively. The duration of the fast pulse is typically<br />
20 ysec <strong>and</strong> its maximum ramp rate exceeds 10 9 A/sec. The<br />
radial plasma position is controlled by a position feedback<br />
system,except during the turbulent heating pulse when the<br />
vacuum chamber acts as a conducting shell (field penetration<br />
time - 130 ysec). The duration of the ohmic discharge is about<br />
5 msec. Typical plasma parameters are: initial filling pressure<br />
cm"<br />
LOT. "Diagnostic instruments include a 4 mm microwave interferometer,<br />
hard <strong>and</strong> soft x-ray detectors, a charge exchange<br />
analyzer <strong>and</strong> an optical spectrometer in addition to various<br />
st<strong>and</strong>ard magnetic coils as shown in Fig. 1.<br />
3 , T<br />
9 x 10"" Torr of hydrogen, I = 4 to 7 kA, ne < 3 x 10 13<br />
< 100 eV, Zeff = 2 to 3, qXa) > 3.5 <strong>and</strong> Bt = 0.5 -<br />
2. MHD ACTIVITY DURING THE FAST PULSE<br />
Previous studies of tokamak operation at low q-values show<br />
that some tokamaks can operate [1,2] below q=2 while others<br />
exhibit major disruption [3,4] for q ~ 2 to 2.5. The range of<br />
unstable q-values <strong>and</strong> the growth rate of the disruptive mode<br />
are still not well understood.<br />
The turbulent heating pulse in STOR-1M is superimposed on<br />
the flat top portion of the ohmic discharge current where q(a)<br />
= 5.6 at Bt = 1.0 T, or q(a) = 4.5 at Bt = 0.8 T are chosen for
(kA)<br />
<strong>IAEA</strong>-CN-47/A-V1I-3 415<br />
-With<br />
Without<br />
Fast Pulse<br />
0 1 2 3 4<br />
Time [m sec]<br />
FIG. 2. Typical discharges with <strong>and</strong> without the fast turbulent heating pulse.<br />
P<br />
(kA)<br />
t (10 >jsec/div)<br />
FIG. 3. Current <strong>and</strong> voltage traces during the fast pulse; large voltage spikes are observed for<br />
1.85 £ q{a) •& 2.1.
416 KUWAHARA et al.<br />
the initial conditions. Typical discharges with <strong>and</strong> without<br />
turbulent heating are shown in Fig. 2. By varying the charging<br />
voltage of the turbulent heating capacitor bank, the current<br />
ramp rate can be changed up to a maximum of 1.8 x 10 9 A/sec.<br />
As shown in Fig. 3, when q(a) is above 2.1, there are no<br />
large voltage spikes <strong>and</strong> the discharge is stable. Voltage<br />
spikes appear below q(a) = 2.1 <strong>and</strong> disruptions begin to be<br />
noticeable on the plasma current trace. When the plasma remains<br />
below q(a) = 2.1 for a longer time, higher voltage spikes are<br />
observed <strong>and</strong> complete termination of the plasma current occasionally<br />
takes place. The plasma becomes stable, with no voltage<br />
spikes, below q(a) = 1.85 if the ramp rate exceeds 4 x 10 8<br />
A/sec at q(a) = 2.1; stable discharges at q(a) as low as 1.5<br />
have been achieved. After the peak current, voltage spikes are<br />
apparent as the plasma current decrease takes q through the unstable<br />
region (1.85 < q(a) < 2.1).<br />
In the unstable region, MHD activity is monitored with magnetic<br />
coils. Plasma disruption is preceded by rapid growth of a<br />
magnetic perturbation whose growth time (~500 nsec) is still 100<br />
times longer than the Alfve'n time. The largest magnetic perturbation<br />
observed is BQ/BQ ~ 0.03% at the coil (r = 5 cm). The<br />
magnetic isl<strong>and</strong> width (m=2/n=l) estimated from this amplitude<br />
[5] is < 5% of the minor radius, insufficient to cause disruption.<br />
In the LT-4 tokamak an n=l mode was detected, whose amplitude<br />
was also not large enough to cause the observed disruption<br />
[4]. (Although its m-number was not determined, the central<br />
portion of the hot plasma core showed an asymmetric profile<br />
before a major disruption.) Thus the growth of magnetic perturbations<br />
prior to disruption may not play an important role in<br />
causing the disruption.<br />
3. PLASMA HEATING<br />
So far, noise problems have prevented us from measuring the<br />
electron <strong>and</strong> ion temperature increase during the heating pulse<br />
itself. An indication of effective heating is found from measurements<br />
of the resistivity at peak current (Fig. 4). The<br />
resistivity increase with applied voltage demonstrates the<br />
enhanced power input (P. a Al n ; n > 2) due to current-driven<br />
turbulence.<br />
Electron temperature measurements are available after 0.15<br />
msec from the heating pulse. For moderate applied voltage the<br />
temperature reproducibly decays within ~ 0.3 msec, from ~ 200 eV<br />
down to the value (~ 100 eV) measured without the fast pulse.
in<br />
<strong>IAEA</strong>-CN-47/A-VII-3 417<br />
\ ' I ^ I ' I<br />
J I I I 1 I L i 1 ,<br />
0 20 40 60 80 100 120 140<br />
Ep(V/m)<br />
FIG. 4. Plasma resistivity during the fast pulse as a function of the applied voltage<br />
( O — in the ohmic discharge).<br />
When the applied voltage is increased to > 60 V/m the electron<br />
temperature, instead of decaying with time, shows a double-hump<br />
behaviour, the second peak coinciding approximately with the<br />
observed peak in ne(t) (see Fig. 2). It is as though the containment<br />
is improving, leading to an increase in the energy density<br />
nT. The implied improvement in containment is generally<br />
greater, the larger the applied voltage, although reproducibility<br />
deteriorates at the highest voltages. (q(a) > 2.1 for the range<br />
of voltages employed.)<br />
A possible explanation for enhanced global confinement is<br />
the change in the current density profile produced by the fast<br />
current pulse. Until the magnetic diffusion (T ~ 0.15 - 0.6<br />
msec) can redistribute the current perturbation, the current<br />
density profile is flattened somewhat.<br />
A similar observation of delayed "heating" following the<br />
turbulent heating pulse has been observed in the TORTUR tokamak<br />
[6]. In that case it has been attributed to a conversion of<br />
magnetic energy into thermal energy, supposing that the current<br />
channel exp<strong>and</strong>s again from a contracted state which is assumed<br />
to be formed just after the application of the fast pulse.<br />
Accurate measurements of the time variation of the current density<br />
profile may be required in order to choose between the two<br />
proposed explanations.<br />
The case of a turbulent heating current pulse applied in<br />
the opposite direction to the ohmic heating current was also<br />
studied in ST0R-1M. Although there is a small density increase
418<br />
KUWAHARA et al.<br />
1 2 3 4 5<br />
TIME (msec)<br />
FIG. 5. AC tokamak discharge with gas puffing.<br />
I. (2.64 kA/div), V, (10 V/div), ne (2 x 10 n cm'''/step), B, = 1 T.<br />
after the pulse, no plasma heating is observed with this<br />
arrangement. Apparently the current density profile produced<br />
by the negative fast pulse is not favourable either for heating<br />
or confinement.<br />
4. AC OPERATION WITH GAS PUFFING<br />
Since 1984, AC operation has been studied in STOR-1M as a<br />
possible approach to quasi-continuous tokamak operation. Stable<br />
reproducible AC discharges have been obtained without disruptive<br />
behaviour or plasma extinction during current reversal<br />
[7], even with reversal times ZlpoCdlp/dt)" 1 an order of magnitude<br />
longer than the energy containment time. Synchronization<br />
of the zero crossing time for the vertical magnetic field <strong>and</strong><br />
the plasma current is the most important single factor in<br />
achieving AC operation.<br />
The original experiments, with no gas puffing, exhibited a<br />
12<br />
density decay to ~ 2 x 10<br />
slight increase (to ~ 4 x<br />
-3<br />
cm at reversal,followed by a<br />
cm ) in the reverse half-cycle.<br />
Gas puffing has now been employed in an attempt to improve the<br />
density behaviour. Typical results are shown in Fig. 5. With<br />
appropriate activation of the piezoelectric valve the electron<br />
density now reaches approximately the same value in the first<br />
<strong>and</strong> second half-cycles of AC operation. It is also possible to
<strong>IAEA</strong>-CN-47/A-VII-3 419<br />
achieve current reversal at higher plasma currents (Ip0 < 8 kA<br />
instead of 6 kA). The density at current reversal, however is<br />
still about the same as without gas puffing.<br />
This work was supported by the Natural <strong>Sciences</strong> <strong>and</strong> Engineering<br />
Research Council of Canada.<br />
REFERENCES<br />
[1] MIRNOV, S.V., SEMENOV, I.B., Sov. Phys. — JETP 33 (1971) 1134.<br />
[2] DIVA Group, Nucl. Fusion 20 (1980) 271.<br />
[3] TOI, K., et al., Nucl. Fusion 22 (1982) 465.<br />
[4] KUWAHARA, H., et al., private communication, 1986.<br />
[5] TFR Group, Rep. EUR-CEA-FC-1151, Groupe de recherches sur la fusion controls, Association<br />
Euratom-CEA, Centre d'6tudes nucteaires de Fontenay-aux-Roses (1982).<br />
[6] DE KLUIVER, H., et al., "Plasma heating in the TORTUR tokamak by low-frequency toroidal<br />
current pulses", Controlled Fusion <strong>and</strong> Plasma Physics (Proc. 12th Europ. Conf. Budapest,<br />
1985), Vol. 2, European Physical Society (1985) 272.<br />
[7] MITARAI, O., et al., Bull. Am. Phys. Soc. 29 8 (1984) 1337; Rep. PPL-75, Plasma Physics<br />
Laboratory, University of Saskatchewan (1984).
<strong>IAEA</strong>-CN-47/A-VH-4<br />
COHERENT AND TURBULENT FLUCTUATIONS<br />
IN TFTR<br />
K. McGUIRE, V. ARUNASALAM, M.G. BELL, M. BITTER,<br />
W.R. BLANCHARD, N.L. BRETZ, R. BUDNY, C.E. BUSH 1 , J.D. CALLEN 2 ,<br />
M. CHANCE, S.A. COHEN, S.K. COMBS 1 , S.L. DAVIS, D.L. DIMOCK,<br />
H.F. DYLLA, P.C. EFTHIMION, L.C. EMERSON 1 , A.C. ENGLAND 1 ,<br />
H.P. EUBANK, R.J. FONCK, E. FREDRICKSON, H.P. FURTH,<br />
G. GAMMEL, R.J. GOLDSTON, B. GREK, L.R. GRISHAM, G. HAMMETT,<br />
R.J. HAWRYLUK, W.W. HEIDBRINK 3 , H.W. HENDEL 4 , K.W. HILL,<br />
E. HINNOV, S. HIROE 1 , H. HSUAN, R.A. HULSE, K.P. JAEHNIG,<br />
D. JASSBY, F.C. JOBES, D.W. JOHNSON, L.C. JOHNSON, R. KAITA,<br />
R. KAMPERSCHROER, S.M. KAYE, S.J. KILPATRICK, R.J. KNIZE,<br />
H. KUGEL, P.H. LaMARCHE, B. LeBLANC, R. LITTLE, C.H. MA 1 ,<br />
J. MANICKAM, D.M. MANOS, D.K. MANSFIELD, R.T. McCANN,<br />
M.P. MCCARTHY, D.C. McCUNE, D.H. MCNEILL, D.M. MEADE,<br />
S.S. MEDLEY, D.R. MIKKELSEN, S.L. MILORA 1 , D. MONTICELLO,<br />
A.W. MORRIS 5 , D. MUELLER, E.B. NIESCHMIDT 6 , J. O'ROURKE 7 ,<br />
D.K. OWENS, H. PARK, W. PARK, N. POMPHREY, B. PRICHARD,<br />
A.T. RAMSEY, M.H. REDI, A.L. ROQUEMORE, P.H. RUTHERFORD,<br />
N.R. SAUTHOFF, G. SCHILLING, J. SCHIVELL, G.L. SCHMIDT,<br />
S.D. SCOTT, S. SESNIC, J.C. SINNIS, F.J. STAUFFER 8 , B.C. STRATTON,<br />
G.D. TAIT, G. TAYLOR, J.R. TIMBERLAKE, H.H. TOWNER,<br />
M. ULRICKSON, S. VON GOELER, F. WAGNER 9 , R. WIELAND,<br />
J.B. WILGEN 1 , M. WILLIAMS, K.L. WONG, S. YOSHIKAWA,<br />
K.M. YOUNG, M.C. ZARNSTORFF, S.J. ZWEBEN<br />
Princeton Plasma Physics Laboratory,<br />
Princeton University,<br />
Princeton, New Jersey,<br />
United States of America<br />
1 Oak Ridge National Laboratory, Oak Ridge, TN, USA.<br />
2 University of Wisconsin, Madison, WI, USA.<br />
3 GA Technologies Inc., San Diego, CA, USA.<br />
4 RCA David Sarnoff Research Center, Princeton, NJ, USA.<br />
5 Balliol College, University of Oxford, Oxford, UK.<br />
6 EG&G Idaho, Inc., Idaho Falls, ID, USA.<br />
7 JET Joint Undertaking, Abingdon, Oxfordshire, UK.<br />
8 University of Maryl<strong>and</strong>, College Park, MD, USA.<br />
9 Max-Planck-Institut fur Plasmaphysik, Garching, Fed. Rep. Germany.<br />
421
422 McGUIRE et al.<br />
Abstract<br />
COHERENT AND TURBULENT FLUCTUATIONS IN TFTR.<br />
Classification of the sawteeth observed in the TFTR tokamak has been carried out to highlight<br />
the differences between the many types observed. Three types of sawteeth are discussed: "simple",<br />
"small", <strong>and</strong> "compound". During the enhanced confinement discharges on TFTR, sawteeth related<br />
to q = 1 are usually not present, but a sawtooth-like event is sometimes observed. Beta approaches the<br />
Troyon limit only at low q^, with a clear reduction of achievable /3n at high q^,. This suggests that<br />
a /3 limit, rather than the Troyon-Gruber limit, applies at high qc , in the enhanced confinement discharges.<br />
These discharges also reach the stability boundary for n — oo ideal MHD ballooning modes.<br />
Turbulence measurements in the scrape-off region with Langmuir <strong>and</strong> magnetic probes show strong<br />
edge density turbulence, fi/n = 0.3 - 0.5, with weak magnetic turbulence, Bs/Bs > 5 x 10~ 6 ,<br />
measured at the wall, but these measurements are very sensitive to local edge conditions.<br />
1 . Introduction<br />
Near-term achievement of ignition in tokamaks depends on<br />
overcoming anomalous heat conduction <strong>and</strong>/or control of the<br />
central energy transport due to sawteeth. Sawteeth in TFTR have<br />
been studied (Section 2) in an attempt to underst<strong>and</strong> the mechanism<br />
that causes the sawtooth crash <strong>and</strong> gives rise to enhanced heat<br />
pulse propagation. The MHD activity observed in enhanced<br />
confinement discharges (locally known as supershots) <strong>and</strong> the<br />
constraints imposed by the Troyon <strong>and</strong> the B limit are discussed<br />
in Sections 3 <strong>and</strong> 4. In Section 5, a summary of turbulence<br />
measurements carried out on TFTR is presented, <strong>and</strong> the correlation<br />
between edge turbulence <strong>and</strong> gross confinement is examined.<br />
Finally in Section 6, we summarize the results of the coherent <strong>and</strong><br />
turbulent fluctuations measured in TFTR.<br />
2. Sawtooth Activity<br />
Three types of sawtooth activity have been identified in<br />
TFTR: (1) simple or normal sawteeth, (2) small sawteeth, <strong>and</strong> (3)<br />
compound sawteeth. Simple sawtooth oscillations, as observed in<br />
most tokamaks, are a series of m/n = 0/0 relaxations, each with an<br />
m/n = 1/1 precursor mode, where m <strong>and</strong> n are poloidal <strong>and</strong> toroidal<br />
mode numbers, respectively. Figure 1a shows a simple sawtooth<br />
which is observed in TFTR plasmas with a small q = 1 radius <strong>and</strong><br />
high q . Small sawteeth (Fig. 1b) are similar to simple sawteeth<br />
in period, but the m/n = 1/1 mode is different. While the<br />
precursor oscillations before the m/n = 0/0 crash are usually not<br />
present or have very small amplitude, the successor oscillations<br />
have a large amplitude. Compound (sometimes called "double")<br />
sawtooth activity (Fig. 1c) has been observed recently in many<br />
tokamaks [1-3], Each compound sawtooth consists of a subordinate<br />
relaxation followed by a large (up to 20% in central T&) main<br />
relaxation with a smaller inversion radius. Compound sawteeth<br />
appear frequently in ohmically heated plasmas with high plasma
<strong>IAEA</strong>-CN-47/A-VII-4 423<br />
(a) Simple Sawtooth (b) Small Sawtooth<br />
3400 , 3420, 3440<br />
3410<br />
2525<br />
34I5<br />
2530<br />
3420<br />
t<br />
Complete<br />
Relaxation<br />
! J r»0cm<br />
3460 3480 3400 3420<br />
TIME (msec)<br />
3425<br />
TIME(msec)<br />
rmOcm<br />
20<br />
30<br />
3430<br />
(c) Compound Sawtooth<br />
3435<br />
I Complete<br />
Relaxation<br />
2500 2520 2540 2560 2580<br />
2535<br />
Subordinate<br />
Relaxation<br />
2540 2555 2560 2565<br />
Main<br />
Relaxation<br />
3440 3445<br />
TIME (msec)<br />
FIG. 1. Soft x-ray emissivity signals, indicating the three main types of sawteeth observed in TFTR.<br />
(a) Simple or normal sawtooth, (b) small sawtooth, <strong>and</strong> (c) compound sawtooth.<br />
2570
424<br />
o<br />
O<br />
6-<br />
5-<br />
3-<br />
1<br />
1 1 1<br />
~ 2<br />
E I -<br />
McGUIRE et al.<br />
1 1 1 1 1<br />
• •/^ • -<br />
1 I 1<br />
1 2 3 4<br />
(rcr) DECAY TIME (IO" 4 sec)<br />
F/G. 2. Comparison between the growth time of the m = I mode at the crash of the sawtooth<br />
<strong>and</strong> the crash time of the sawtooth, as measured by the central soft x-ray signal.<br />
current (I > 1.0 MA) <strong>and</strong>/or high density (iie > 2.0 x 10 m" ).<br />
Sawteeth may switch from compound to small during the steady phase<br />
of a discharge, although global parameters such as averaged<br />
temperature, density, Ze-f, <strong>and</strong> even the inversion radius of the<br />
sawtooth do not change [2j. This suggests that small or localized<br />
changes of plasma parameters affect the characteristics of<br />
sawteeth significantly. The subordinate relaxation <strong>and</strong> the small<br />
amplitude of the m = 1 precursor indicate that compound sawteeth<br />
<strong>and</strong> small sawteeth cannot be explained by the Kadomtsev model<br />
[4], It has been found that the duration of the crash (Tcr) is<br />
proportional to the final growth time (T ) of an m = 1 mode during<br />
the crash phase itself (Fig. 2). Note that T cr appears to be<br />
completely determined by T . Possible explanations include fast<br />
transport or reconnection due to; a) small perturbations at the q<br />
= 1 surface, b) two g = 1 surfaces [5] or c) a flat q profile with<br />
qQ close to 1 [1,6],<br />
3. MHD Activity in Enhanced Confinement Discharges<br />
Recent experiments on TFTR at low I <strong>and</strong> high-power balanced<br />
neutral beam injection (NBI) have achieved enhanced confinement<br />
relative to the predictions of L-mode scaling [7,8]. These<br />
discharges are remarkable from the MHD viewpoint, the most obvious<br />
feature being the lack of sawteeth during NBI for qcyl > 5. This<br />
may be due to the removal of the g=1 surface from the plasma (some<br />
data show r* +0), but qcv-i < 5 enhanced confinement discharges<br />
with sawteeth have r^nv unchanged. During enhanced confinement<br />
plasmas with q -^ > 5, there are occasional sawtooth-like events<br />
which are similar to the subordinate relaxations described in
-30-<br />
<strong>IAEA</strong>-CN-47/A-VU-4 425<br />
-0.5 -0.4 -0.3 -0.2 -0.1 0 0.1 0.2 0.3 0.4 0.5<br />
RADIUS (m)<br />
FIG. 3. Plot ofAA/A of the sawtooth crash versus radius, for an m/n = 1/1 sawtooth in an L-mode,<br />
Ip = 900 kA discharge with 3.4 MW of counter NBI, <strong>and</strong> an m/n = 2/1 sawtooth in an Ip = 800 kA<br />
enhanced confinement discharge with 10 MW of balanced NBI. The m = 2 sawtooth-like event has an<br />
inversion at 0.2 m which is close to the calculated q = 2 radius.<br />
Section 2. They have only a small perturbation on axis <strong>and</strong> an<br />
inversion close to the calculated location of the g = 3/2 or 2/1<br />
surfaces. Figure 3 shows an m = 2 sawtooth-like event which was<br />
observed in : an enhanced confinement discharge with I = 0.8MA,<br />
q j = 7.6 <strong>and</strong> 10MW of balanced NBI; the calculated q = 2 radius<br />
for this discharge was about 0.25m. In Pig. 3 the line-averaged<br />
soft x-ray inversion radius was about 0.20m for the m = 2<br />
sawtooth, which was larger than the m = 1 inversion radius<br />
observed at an m/n = 1/1 sawtooth in an I = 0.9MA, cr ^ = 7.3,<br />
<strong>and</strong> P^ni = 3.6MW counter-injection L-mode discharge. The mode<br />
amplitude <strong>and</strong> the phase on the x-ray diodes clearly show an m = 2<br />
mode structure, also a small amplitude odd m-mode was present<br />
near the center. The magnetic signals at the wall show a clear<br />
m/n = 2/1 mode with no coupled mode structure. These m = 2<br />
sawteeth are infrequent, with an irregular period, <strong>and</strong> they do not<br />
appear to affect the confinement of the discharge. The off-axis<br />
sawtooth events can occur during a period of continuous m/n = 3/2<br />
or 2/1 activity (detected by magnetic measurements at the wall)<br />
with no interruption of the oscillation. Similar type sawteeth<br />
have also been observed in pellet injection discharges during a<br />
period of continuous m = 1 mode activity.<br />
For identical operating conditions, enhanced confinement<br />
discharges can vary substantially, depending on the MHD activity.<br />
Figure 4 shows two such discharges, one with m/n = 2/1 activity,<br />
the other without MHD activity. The correlation of the MHD<br />
activity with the drop in total stored energy <strong>and</strong> neutron emission<br />
is very clear. This can occur with m/n = 2/1 alone, or m/n = 3/2<br />
alone. Figure 5 shows the coherent MHD activity versus the rate
426<br />
1<br />
s •-<br />
(J) 00<br />
O" *<br />
ii u<br />
Q. >~<br />
•—< 00<br />
1<br />
1 1<br />
II<br />
QT<br />
1 1<br />
7<br />
• \<br />
1<br />
A1ISN3Q 39VM3AV<br />
1<br />
1<br />
j ml<br />
McGUIRE et al.<br />
OJ — O<br />
(SlINfl "8aV) AIIAI13V AONdlW<br />
§<br />
1<br />
g
<strong>IAEA</strong>-CN-47/A-VII-4 427<br />
dwi IA /dt (MW)<br />
FIG. 5. MHD activity between 5 <strong>and</strong> 55 kHz versus dW°^ A /dt, 50 ms before the end of the beam pulse.<br />
These data include only enhanced confinement discharges. No similar correlation of MHD activity <strong>and</strong><br />
confinement is seen for L-mode-type discharges.<br />
of change of stored energy (calculated from the diamagnetic<br />
signal) 50ms before the end of the beam pulse. It is clear that a<br />
large amplitude of MHD activity is correlated with negative<br />
dWj^ /dt. Prom delta-prime calculations on the j(r) profiles<br />
calculated by the TRANSP code [9] it is found that the profiles<br />
are sometimes unstable to the m/n = 2/1 <strong>and</strong>/or m/n = 3/2 modes.<br />
This implies that the j(r) profile may play an important role in<br />
the energy balance inside the q = 2 surface for the enhanced<br />
confinement discharges on TFTR [10],<br />
At lower qcy^ bursts of m = 1 activity are seen in<br />
the center of the plasma on the soft x-ray detectors. This mode<br />
couples out as m/n " 6/1 on the Mirnov coils, similar to the<br />
fishbone oscillations observed on PDX. This is in contrast with<br />
the 2/1 <strong>and</strong> 3/2 modes which appear as m/n = 2/1 <strong>and</strong> 3/2,<br />
respectively, on the Mirnov coils, even though the mode amplitude<br />
peaks at a similar radius (0.1 - 0.3 m). There is no measurable<br />
effect on the neutron emission, due to m = 1 activity at the levels<br />
observed to date, although we have observed coherent (5 kHz)<br />
oscillations in the charge-exchange neutral signals.<br />
Enhanced confinement discharges which disrupt can lose most<br />
of the plasma energy in as little as 20 - 100 us, with only a low<br />
amplitude or no detectable MHD activity preceding them. The<br />
temperature on the inner wall, as measured by 1.0 ym radiation,<br />
can rise to over 1200°C in 20 us after a high 6 disruption. In a
428 McGUIRE et al.<br />
0.5<br />
FIG. 6, The present enhanced confinement regime ofTFTR on a plot of&n versus q t The square symbols<br />
show discharges that disrupted during the neutral beam pulse. Also shown is a curve representing<br />
the high q t data better than the optimized Troyon limit.<br />
few disruptive discharges, a 40 kHz mode growing on a 50 us time'<br />
scale, with an m = 1 structure in the center <strong>and</strong> m > 4, n = 1 on<br />
the magnetic signals, has been observed. Although the bulk of the<br />
plasma energy is lost rapidly, the current disruption occurs up to<br />
0.5 s later, after a narrowing of the Te <strong>and</strong> X-ray emission<br />
profiles. It is also observed that few major disruptions take<br />
place for q^,r1 < 5; here the continuous 3/2 <strong>and</strong>/or 2/1 modes are<br />
r»d Cy detected anc the energy is lost slowly, as in Fig. 4.<br />
4. BETA Limits<br />
Enhanced confinement discharges with qcyi < 5 have values of<br />
normalized toroidal beta, 3 = $A/$C W„ = uQI /aBo,), which approach<br />
the limit found from optimized ideal MHD kink stability theory<br />
[11,12], This limit has previously been confirmed on other<br />
devices with NBI (Dili, PDX, ASDEX, ISX-B, for example). The<br />
experimental limit from these devices is 3n = 2.2 - 2.5,<br />
approximately independent of plasma shape, but only for a small<br />
range of aspect ratio <strong>and</strong> qcy^« Figure 6 shows Bn for the<br />
enhanced confinement regime of TFTR versus qcvl. Diamagnetic<br />
3i DIA (assuming a circular cross-sectional plasma* is used in Fig.<br />
6 <strong>and</strong>, since the NBI is tangential, this underestimates the total 3<br />
(< 10% at high 3 ). It is seen that there is a clear fall of the<br />
achievable 3. wfth q cyl-<br />
Icy I<br />
There is little published data from<br />
other auxiliary heated tokamaks in the high-6n high-q region<br />
[13], At high qcyl, the limit appears to be disruptive, but at<br />
q 1 < 5 the 6 n limit is associated with coherent MHD activity.<br />
Attempts to reach higher 3n by reducing (I , B± ) at constant q<br />
have not been successful. For a current ramp-down experiment wi<br />
10
0.5<br />
<strong>IAEA</strong>-CN-47/A-VII-4 429<br />
FIG. 7. Data from TFTR profiles on an S-a diagram forvarious types ofdischarge. The pressure profile<br />
used is the total pressure, (Pt + PJ/2, calculated by the TRANSP code [9].<br />
NBI, 3 reached 2.65 before the discharge disrupted; this 6 was<br />
not maintained in equilibrium. There appears to be a hard 6<br />
limit at 2 - 2.2 or an eB » 0.7 limit, as illustrated in Fig.<br />
6. However, the range of the inverse aspect ratio e for the TFTR<br />
data is from 0.28 to 0.33 <strong>and</strong> it is not clear from this data<br />
whether e is an important parameter in the 3 limit.<br />
The profiles of enhanced confinement discharges have been<br />
examined for violation of the high-n ballooning mode stability<br />
criterion. Figure 7 shows points on the profile in the S-a<br />
diagram [14] (where S = r(dq/dr)/q, a = -2 yog 2 R(dPT/dr)/B^ 2 ) for<br />
various types of discharges. The pressure profile, (P||+p^)/2 from<br />
the TRANSP code [9] , which includes calculated beam <strong>and</strong> thermal<br />
ion pressure profiles <strong>and</strong> anisotropy, is used for dP^/dr ( a t,eam <<br />
0.7 a total^*
430 McGUIRE et al.<br />
5. Turbulence in TFTR<br />
Langmuir probes in the scrape-off region outside the last<br />
closed flux surface have revealed broadb<strong>and</strong> turbulent fluctuations<br />
in the frequency range 10 - 200kHz, with fluctuation levels<br />
typically n/n = 0.3 - 0.5 <strong>and</strong> 9/T = 0.1, Imaging of D-alpha<br />
light at the inner wall also shows large amplitude fluctuations<br />
[17] in this frequency range, with typical poloidal wavelengths<br />
X - = 0.03 - 0.07m, but with X > 1.0m, Measurements of the<br />
magnetic fluctuations 0.11m outside the plasma edge show that the<br />
amplitude at 100kHz increases by a factor of 4 to Eg /E^ = 5 x 10<br />
during neutral beam injection for both L-mode <strong>and</strong> enhanced<br />
confinement discharges. Since the distance of the coils from the<br />
plasma boundary varies for different coils, a radial e-folding<br />
distance can be measured; for most conditions this distance is<br />
about 0.05m. A strong dependence of the turbulent fluctuations on<br />
local edge conditions is found. For example, a gas puff of<br />
5 Torr* 1/s or a burst of low frequency m/n = 5/1 or 4/1 mode<br />
activity in an ohmically heated discharge can decrease the<br />
turbulent fluctuations by a factor of 10. From this result it is<br />
clear that turbulent fluctuations measured outside the plasma are<br />
not generally appropriate for direct correlation with global<br />
energy confinement.<br />
The broadb<strong>and</strong> spectra of "n, ? <strong>and</strong> 1^ in the frequency range<br />
10 - 250kHz have an approximate power-law dependence P(f) « f\<br />
where -1 > Y > -2. Short radial decay lengths are found for n <strong>and</strong><br />
Eg in the range corresponding to "mode numbers" m > 15, i.e.,<br />
small-scale compared with the plasma size. The amplitude of the<br />
broadb<strong>and</strong> fluctuations of n <strong>and</strong> Eg increased with NBI both in the<br />
L-mode <strong>and</strong> enhanced confinement mode.<br />
6. Conclusions<br />
On TFTR, three different types of sawteeth have been<br />
identified. The main differences are in the precursor <strong>and</strong><br />
successor oscillation amplitudes. Possible explanations include<br />
extensions of the Kadomtsev model with two q = 1 surfaces <strong>and</strong><br />
partial reconnection. Turbulence measured in the scrape-off<br />
region shows large amplitude fluctuations in the frequency range<br />
10-250kHz, with fluctuation levels typically "n/n = 0.3-0.5<br />
<strong>and</strong>?/Te = 0.1. It is also found that the measured edge<br />
fluctuations of 'n <strong>and</strong> "Eg can be extremely sensitive to local edge<br />
conditions.<br />
The enhanced confinement discharges on TFTR have values of<br />
3n at low q j which approach the limit found from ideal kink<br />
stability theory. At higher q 1 it appears that the beta limit<br />
is better described by e6 DIA - 0.7. In addition, dPT/dr in these<br />
discharges is close to the n + » large aspect ratio ideal<br />
ballooning stability limit. High frequency modes at > 60kHz with<br />
m > 3, n > 3 have been observed in the core of discharges with
<strong>IAEA</strong>-CN-47/A-VII-4 431<br />
high B <strong>and</strong> high neutral beam power. Deterioration of confinement<br />
in the enhanced confinement discharges appears to be associated<br />
more with coherent modes (m/n = 2/1 <strong>and</strong> 3/2). Major disruptions<br />
at high S can have fast thermal energy decay (< 100 usec); n = 1<br />
modes (with many coupled m-modes) are sometimes observed, but<br />
high-n modes are not detected by the magnetic coils or soft x-ray<br />
diodes during these disruptions.<br />
ACKNOWLEDGEMENTS<br />
The authors are grateful to D.J. Grove <strong>and</strong> J.R. Thompson for their advice <strong>and</strong><br />
support, <strong>and</strong> to J. Strachan for his many contributions.<br />
This work was supported by the United States Department of Energy, under<br />
Contract No. DE-AC02-76-CHO3073. The ORNL participants were also supported<br />
by the United States Department of Energy, under Contract<br />
No. DE-AC05-840R21400 with Martin Marietta Energy Systems, Inc.<br />
REFERENCES<br />
[1] PFEIFFER, W., Nucl. Fusion 25 (1985) 673.<br />
[2] McGUIRE, K., et al., in Controlled Fusion <strong>and</strong> Plasma Physics (Proc. 12th Europ. Conf.<br />
Budapest, 1985), Part 1, European Physical Society (1985) 134.<br />
[3] CAMPBELL, D., et al., Nucl. Fusion 26 (1986) 1085.<br />
[4] KADOMTSEV, B., Fiz. Plazmy 1 (1975) 710.<br />
[5] DENTON, R., et al., Phys. Rev. Lett. 56 (1986) 2477.<br />
[6] PARAIL, V., PEREVERZEV, G., Fiz. Plazmy 6 (1980) 27.<br />
[7] HAWRYLUK, R.J., et al., Paper <strong>IAEA</strong>-CN-47/A-I-3, these Proceedings, Vol. 1.<br />
[8] GOLDSTON, R.J., et al., Paper <strong>IAEA</strong>-CN-47/A-II-l, these proceedings, Vol. 1.<br />
[9] HAWRYLUK, R.J., in Physics of Plasmas Close to Thermonuclear Conditions (Proc. Course<br />
Varenna, 1979), Rep. EUR/FU/BRU/XD7476/80, CEC, Brussels (1980) 503.<br />
GOLDSTON, R.J., et al., J. Comput. Phys. 43 (1981) 61.<br />
[10] FURTH, H., Plasma Phys. Controll. Fusion 28 (1986) 1305.<br />
[11] TROYON, F., et al., Plasma Phys. Controll. Fusion 26 (1984) 209.<br />
[12] MANICKAM, J., et al., Nucl. Fusion 24 (1984) 595.<br />
[13] ROBINSON, D.C., et al., in Plasma Physics <strong>and</strong> Controlled <strong>Nuclear</strong> Fusion Research 1984<br />
(Proc. 10th Int. Conf. London, 1984), Vol. 1, <strong>IAEA</strong>, Vienna (1985) 205.<br />
[14] LORTZ, D., et al., Phys. Lett., A 68 (1978) 49.<br />
CHOE, W., et al., Phys. Fluids 29 (1986) 1766.<br />
[15] SYKES, A., et al., in Controlled Fusion <strong>and</strong> Plasma Heating (Proc. 1 lth Europ. Conf. Aachen,<br />
1983), Pt. 11, European Physical Society (1984) 363.<br />
[16] BISHOP, C, et al., Nucl. Fusion 24 (1984) 643.<br />
TANG, W., et al., Nucl. Fusion 21 (1981) 891.<br />
[17] ZWEBEN, S., et al., J. Nucl. Mater. 145-147 (1987).
SAWTEETH AND DISRUPTIONS IN JET<br />
D.J. CAMPBELL, P.A. DUPERREX 1 , A.W. EDWARDS,<br />
R.D. GILL, C.W. GOWERS, R. GRANETZ, M. HUGON,<br />
P.J. LOMAS, N. LOPES-CARDOZO 2 , M. MALACARNE,<br />
M.F. NAVE, D.C. ROBINSON 3 , F.C. SCHULLER,<br />
P. SMEULDERS, J.A. SNIPES 3 , P.E. STOTT, G. TONETTI 1 ,<br />
B.J. TUBBING 2 , A. WELLER 4 , J.A. WESSON<br />
JET Joint Undertaking,<br />
Abingdon, Oxfordshire,<br />
United Kingdom<br />
Abstract<br />
<strong>IAEA</strong>-CN-47/A-VII-5<br />
SAWTEETH AND DISRUPTIONS IN JET.<br />
The behaviour of magnetohydrodynamic phenomena associated with sawteeth <strong>and</strong> major disruptions<br />
has been studied for a wide range of discharge conditions with Ohmic, neutral beam <strong>and</strong> ion cyclotron<br />
heating. The sawtooth collapse has been investigated in detail <strong>and</strong> found to be inconsistent with<br />
models based on resistive reconnection. Disruptions set limits to JET operation at low q <strong>and</strong> high density,<br />
<strong>and</strong> the detailed evolution of disruptions at these limits has been studied. A hard operational limit<br />
is found at q^ = 2.0 ±0.1. The highest value of the Murakami parameter achieved in Ohmic plasmas<br />
is nR/BT = 7.2 x 10 19 m^T" 1 , but neutral beam heating leads to a substantial increase (-50%) in<br />
the density limit. Finally, during high power neutral beam heating combined with ion cyclotron heating,<br />
'monster' sawteeth are observed in which MHD activity of modes with low m <strong>and</strong> n becomes quiescent<br />
for periods ~ 1 s.<br />
INTRODUCTION<br />
Sawteeth <strong>and</strong> disruptions are well known phenomena in all<br />
tokamaks <strong>and</strong> define the limits on the mhd stability of the<br />
discharge. They have been studied extensively in JET <strong>and</strong> there<br />
are some important new features in the results which will be<br />
reported here.<br />
Our studies of these phenomena have used all of the JET<br />
diagnostics, but in particular we have made detailed<br />
measurements of the mode structures using: magnetic pick-
434 CAMPBELL et al.<br />
(O<br />
2 §
<strong>IAEA</strong>-CN-47/A-VH-5 435<br />
coils <strong>and</strong> loops outside the plasma boundary; electron cyclotron<br />
emission to measure local electron temperatures; <strong>and</strong> orthogonal<br />
arrays of X-ray diodes combined with tomographic analysis to<br />
measure the soft X-ray emissivity.<br />
SAWTEETH<br />
Sawteeth are observed in almost all JET discharges. Their<br />
general features which have been discussed in earlier papers<br />
[1,2] will only be summarised here. In _phmically heated<br />
plasmas the modulation of the central electron temperature is<br />
up to 20S& <strong>and</strong> the period is between 30 <strong>and</strong> 250ms. In<br />
discharges with ion cyclotron heating (Fig. 1) or co-injected<br />
neutral beams the modulation is increased up to 50$ <strong>and</strong> the<br />
period extended up to 600ms, whereas with counter injected<br />
beams both the modulation <strong>and</strong> the period are reduced. With<br />
combined ion cyclotron <strong>and</strong> neutral beam heating we have<br />
sometimes seen "monster" sawteeth lasting for more than 1s. We<br />
have attempted to determine the scaling of the period with<br />
various tokamak parameters, but the only clear trend is that in<br />
ohmic discharges the period increases with plasma density.<br />
Most JET sawteeth show a compound structure with one or more<br />
partial collapses occuring between the main collapses.<br />
As we have reported elsewhere [1] the main collapse of<br />
sawteeth in JET occurs on a much shorter time scale (typically<br />
- 100ys) than would be consistent with resistive reconnection<br />
models. In ohmic discharges the collapse usually occurs<br />
spontaneously without any precursor oscillations but often we<br />
see successor oscillations. The behaviour is very similar in<br />
ion cyclotron heated discharges, but with neutral beam heating<br />
we usually see a precursor either as a growing oscillation or<br />
sometimes as a saturated mode. When there are precursors, the<br />
main collapse appears to be a continuation of the precursor.<br />
This suggests that the precursor <strong>and</strong> main collapse are the same<br />
instability, but this has not been proved conclusively.<br />
The collapse mechanism appears to be the same in all JET<br />
discharges despite these differences in precursor activity.<br />
Detailed studies [3] with the X-ray <strong>and</strong> ECE diagnostics show<br />
that the collapse has an m=n=1 structure <strong>and</strong> involves the<br />
displacement in minor radius of the hot central core of plasma<br />
(Fig. 2a). The displaced core spreads poloidally around the<br />
magnetic axis into a crescent shaped region (Fig. 3) <strong>and</strong> at the<br />
same time there is a rapid outflow of plasma energy. The<br />
successor oscillations are seen to be the rotation of a<br />
residual asymmetry in the collapsed state. The soft X-ray<br />
emission profiles after the collapse are sometimes slightly<br />
hollow. The time scale of the collapse <strong>and</strong> the detailed
436 CAMPBELL et al.
m<br />
<strong>IAEA</strong>-CN-47/A-VH-5 437<br />
-I
438 CAMPBELL et al.<br />
displacement <strong>and</strong> spreading of the hot core are in agreement<br />
with the predictions of the model by Wesson [H] where the<br />
sawtooth collapse is an ideal mhd instability. A magnetic<br />
signal with n=1 is detected simultaneously with the collapse<br />
[5].<br />
Partial collapses show a wider range of behaviour in<br />
precursor <strong>and</strong> successor oscillations <strong>and</strong> are more difficult to<br />
classify, but there appear to be at least two general types.<br />
One is similar to the main collapse, with a sudden (-lOOps) but<br />
smaller displacement of the hot core (Fig. 2b), <strong>and</strong> the<br />
subsequent propagation of a heat pulse outside the central<br />
region. The second type is a much softer relaxation on a<br />
longer timescale - 10ms with an m = 1 oscillation which shifts<br />
inwards but does not lead to a central collapse. Both types of<br />
partial collapse have very little overall effect on the central<br />
temperature.<br />
Pnf=5MW<br />
8.2 6.6<br />
Time (s)<br />
FIG. 4. Evolution of central electron temperature Te(0), line integral of electron density \nedt, total<br />
plasma energy from diamagnetic measurements Wdia, <strong>and</strong> amplitude of total MHD activity during 5 MA<br />
discharge with a monster sawtooth lasting 1.2 s.
T.(0)<br />
A(n=1)<br />
<strong>IAEA</strong>-CN-47/A-VII-5 439<br />
Jl^tJiWlUV}^^ ,<br />
FIG. 5. After monster sawtooth collapses at time A, large amplitude n = 2 mode persists until end of<br />
neutral beam heating pulse at time B.<br />
MONSTER SAWTEETH<br />
In discharges with combined ion cyclotron <strong>and</strong> neutral beam<br />
heating some sawteeth have very long duration (up to 1.26s).<br />
These were first seen in relatively low current discharges (I_<br />
- 2MA), but similar long duration ("monster") sawteeth have now<br />
been seen in discharges with an internal separatrix (I =• 2MA)<br />
<strong>and</strong> at high currents (I = 5MA) as shown in figure 1. These<br />
are not simply sawteeth with particularly long periods, as they<br />
are characterised by low levels of coherent mhd activity<br />
suggesting that the m=1 mode has been stabilised. However<br />
after the sawtooth collapse the plasma remains in an unstable<br />
state characterised by a large m = 3, n°2 mode which oscillates<br />
for several seconds <strong>and</strong> often persists until the end of the<br />
neutral beam pulse (Fig. 5). This seems to prevent the growth
440 CAMPBELL et al.<br />
-<br />
0.6 -<br />
0.4 -<br />
0.2 -<br />
(BT=2.8T , Zetl=2, a=1.2,<br />
Ohmic anc<br />
RF Data —<br />
//<br />
Model Prediction<br />
+<br />
^ ®<br />
s<br />
s<br />
\<br />
n R/BT(x10 1 "m- 2 .T- 1 )<br />
x "<br />
Neutral Beam<br />
Heating<br />
Low-q<br />
Ohmic<br />
•^Pellet<br />
Ohmic<br />
Helium<br />
FIG. 6. Hugill diagram summarizing the limits of stable operation in JET. Preliminary results of single<br />
pellet injection into Ohmic discharges which did not disrupt are also shown. Low q limit is more consistently<br />
plotted in terms of q^ as shown in upper figure.<br />
of a second monster sawtooth In the same pulse, although there<br />
may be several normal sawteeth. The conditions for monster<br />
sawteeth have not yet been fully explored, but simultaneous ion<br />
cyclotron <strong>and</strong> neutral beam heating appear to be required. The<br />
ratio of ion cyclotron to neutral beam power does not appear to<br />
be critical but there does appear to be a threshold of total<br />
additional power which increases with plasma current. A<br />
possible explanation is that the current profile is modified by<br />
the beam driven current which may be enhanced by the ion<br />
cyclotron heating.<br />
LOW q DISCHARGES AND DISRUPTIONS<br />
Reproducible, stable ohmic discharges with I = 3.5MA,<br />
BT = 1 .7T, R = 2.97m, a = 1 .2m, b/a = 1 .35, q^, = 2.2 <strong>and</strong><br />
qc=(5Xi0 6 abBT/RI )-1.59 have been studied to simulate the<br />
-
<strong>IAEA</strong>-CN-47/A-VII-5 441<br />
planned operation of JET at I = 7MA <strong>and</strong> BT = 3.4T. The<br />
sawtooth inversion radius is u.55a. The global energy<br />
confinement time of O.^s is consistent with normal JET<br />
scaling. These discharges reach the highest value of the<br />
Murakami parameter n R/BT = 7.2X10 19 m~ 2 -T l obtained for JET<br />
ohmic plasmas (Fig. 6).<br />
When q. is lowered either by raising I , lowering BT, or<br />
by reducing a or b/a, a lower limit to stable operation is<br />
always found at q. = 2.0 + 0.1. These low q disruptions are<br />
initiated by a sawtooth collapse <strong>and</strong> have precursors only on a<br />
time scale shorter than the sawtooth period. The total<br />
radiated power remains less than the ohmic power input <strong>and</strong><br />
there is no contraction of the current profile.<br />
DISRUPTIONS AT THE DENSITY LIMIT<br />
Disruptions at the density limit in discharges with q. > 3<br />
are preceeded by signs of deterioration for up to 1s before the<br />
final energy quench. The radiated power rises to equal the<br />
total power [6], <strong>and</strong> although the ohmic power increases due to<br />
increased plasma resistance, it fails to keep pace with the<br />
radiation. The discharge contracts until just before the<br />
quench there is virtually no current flowing outside the q=2<br />
surface. Combining these observations with the assumption that<br />
all the energy loss outside q=2 is due to low Z impurity<br />
radiation gives an expression for the density limit in JET. An<br />
earlier calculation [7] has now been extended to include the<br />
effect of additional heating <strong>and</strong> a more accurate model [8] of<br />
the impurity radiation. The predicted high density limit for<br />
low Z dominated discharges with gas refuelling is<br />
"crit " 3.5X10-<br />
(Zeff-1) Rab(qc- 2a/b) )<br />
where P is the total power input (watts). This model clearly<br />
breaks down when Zeff is close to 1 <strong>and</strong> other cooling<br />
mechanisms become important. There is good agreement between<br />
this expression <strong>and</strong> observed density limits for disruptions<br />
during the current flat top [6], but disruptions during the<br />
current rise <strong>and</strong> decay phases generally occur at lower <strong>and</strong><br />
higher densities respectively than the predicted values. The<br />
model also indicates that the weakness of the increase in the<br />
density limit with ion cyclotron heating is due to the observed<br />
increase in Zeffwith increasing power, whereas the substantial<br />
increase in the density limit with beam heating is slightly<br />
assisted by the reduction of Zeff by the beam particles.
442 CAMPBELL et al.<br />
3.6-<br />
3.7-<br />
1 3.8'<br />
5<br />
5<br />
3.9"<br />
4.0"<br />
¥ ¥ V V<br />
^M-V^^-^V-^^.I^V^ f?*~ ) ' .<br />
10ms<br />
FIG. 7. Contours of electron temperature (at 100 eV intervals) versus time during magnetic activity<br />
which precedes disruption. Lower traces show (a) electron temperature at R = 3.95 m (r/a = ~0.8),<br />
<strong>and</strong> amplitudes (b)ofm = 2, n = 1 oscillation (c) of locked mode.<br />
DETAILED STUDIES OF DISRUPTIONS<br />
Detailed studies are being made of the sequence of events<br />
which precede a density limit disruption [9]. In a typical<br />
case (I = 3MA, BT= 3-^T, q^=5.7) the significant magnetic<br />
activity, shown in Figure 7, starts about 700ms before the<br />
energy quench with a mode which is predominantly m=2, n=1.<br />
This activity grows for about 30ms. The mode then stops<br />
rotating <strong>and</strong> locks in a fixed toroidal position when Bg at the<br />
wall is 10~ 3 T. During the locked phase the mode continues to<br />
grow in amplitude. ECE measurements show that the temperature<br />
profile shrinks before the start of the mhd activity. After the<br />
mode locks the temperature profile flattens slightly at a minor<br />
-0.5<br />
-0.6<br />
0.7<br />
-0.8
<strong>IAEA</strong>-CN-47/A-VII-5 443<br />
radius of 0.95 m which is close to the calculated position of<br />
the q=2 surface. This is consistent with the growth of a<br />
non-rotating magnetic isl<strong>and</strong> (the ECE diagnostic views close to<br />
the calculated position of the '0' point) <strong>and</strong> there may be<br />
similar evidence from the soft X-ray emission, but the analysis<br />
is at a preliminary stage <strong>and</strong> there could be other<br />
interpretations. The spatial resolution of the ECE diagnostic<br />
(at present *)0mm in the radial direction) is not quite<br />
sufficient to determine whether the '0' point is colder than<br />
the surrounding plasma as predicted by the thermal instability<br />
model of disruptions [10].<br />
The locked mode persists for several hundred ms until the<br />
final energy quench. This has been studied in detail for the<br />
last few ms before the energy quench using the soft X-ray diode<br />
arrays. A contour plot (Fig. 8) of the X-ray emission from the<br />
vertical camera shows that 2ms before the quench the central<br />
core of the discharge is eroded. The emission following the<br />
final termination is probably due to contact of the plasma with<br />
the walls <strong>and</strong> limiter. Tomographic analysis of the X-ray<br />
emission shows the growth of a large m=1 asymmetry in the<br />
plasma centre. This structure appears to be locked in a<br />
specific toroidal phase for most disruptions which suggests<br />
that it is n=1 <strong>and</strong> coupled to the locked m=2 mode observed<br />
magnetically.<br />
MAGNETIC FLUCTUATIONS<br />
The magnetic pick-up coils detect incoherent fluctuations<br />
as well as coherent mhd activity. These incoherent fluctuations<br />
have a broadb<strong>and</strong> spectrum over the whole measured<br />
frequency range from 5 to 60kHz.<br />
During typical conditions the frequency dependence of the<br />
spectrum is f~' • 6 ±0 . 2 <strong>and</strong> the total normalised fluctuation<br />
amplitude is BQ /BQ -10~ 5 . The magnetic fluctuations have a<br />
short growth <strong>and</strong> decay time. A strong correlation is observed<br />
in the direction parallel to B. The normalised amplitude is<br />
seen to increase with additional heating power which may<br />
indicate a possible link with reduced confinement [11].<br />
CONCLUSIONS<br />
Detailed studies of sawteeth, disruptions <strong>and</strong> magnetic<br />
fluctuations are being made in JET with the aim of improving<br />
our underst<strong>and</strong>ing of these phenomena. The detailed mechanisms<br />
involved in the collapse of sawteeth have been investigated <strong>and</strong><br />
found to be in agreement with an ideal mhd model of the
444<br />
7<br />
o II<br />
# jojoejea<br />
CAMPBELL et al.<br />
8<br />
o<br />
v eji<br />
(ui))M6|3H<br />
-o
<strong>IAEA</strong>-CN-47/A-VII-5 445<br />
collapse. A new regime which appears to be stable to low m <strong>and</strong><br />
n modes for more than 1s has been observed with combined ion<br />
cyclotron <strong>and</strong> neutral beam heating. The operational limits to<br />
stable operation at low q <strong>and</strong> high density have been explored<br />
<strong>and</strong> the detailed mechanisms leading to disruptions have been<br />
studied. This work is proceeding with the objective of fully<br />
underst<strong>and</strong>ing the nature of disruptions <strong>and</strong> attempting to<br />
stabilise them by various means.<br />
ACKNOWLEDGEMENTS<br />
It is a pleasure to acknowledge contributions to this work<br />
<strong>and</strong> many helpful discussions with our colleagues in the JET<br />
project.<br />
REFERENCES<br />
[1] CAMPBELL, D.J., et al., Nucl. Fusion 26 (1986) 1085.<br />
[2] GILL, R.D., et al., in Controlled Fusion <strong>and</strong> Plasma Heating (Proc. 13th Europ. Conf.<br />
Schliersee, 1986), Vol. 1, European Physical Society (1986) 21.<br />
[3] EDWARDS, A.W., et al., Phys. Rev. Lett. 57 (1986) 210.<br />
[4] WESSON, L, Plasma Phys. Controll. Fusion 28 (1986) 243.<br />
[5] DUPERREX, P.A., et al., in Controlled Fusion <strong>and</strong> Plasma Physics (Proc. 12th Europ. Conf.<br />
Budapest, 1985), Vol. 1, European Physical Society (1985) 126.<br />
[6] WESSON, J., et al., ibid., p. 147.<br />
[7] SCHULLER, F.C., et al., ibid., p. 151.<br />
[8] BEHRINGER, K., et al., Paper <strong>IAEA</strong>-CN-47/A-IV-1, these Proceedings, Vol. 1.<br />
[9] HENDER, T.C., ROBINSON, D.c, SNIPES, J.A., paper <strong>IAEA</strong>-CN-47/A-V-3, these<br />
Proceedings, Vol. 1.<br />
[10] REBUT, P.H., HUGON, M., in Plasma Physics <strong>and</strong> Controlled <strong>Nuclear</strong> Fusion Research 1984<br />
(Proc. 10th Int. Conf. London, 1984), Vol. 2, <strong>IAEA</strong>, Vienna (1985) 197.<br />
[11] MALACARNE, M., DUPERREX, P.A., JET Preprint-P(86)31, JET Joint Undertaking,<br />
Abingdon (1986).
Session F<br />
PLASMA HEATING AND CURRENT DRIVE<br />
Session F-I<br />
Session F-II<br />
Session F-III<br />
Session F-IV (Posters)<br />
Chairmen of Sessions<br />
O.S. PAVLICHENKO<br />
R.R.<br />
PARKER<br />
F.G. PREVOT<br />
USSR<br />
USA<br />
France
RADIOFREQUENCY HEATING ON JET<br />
JET TEAM 1<br />
(Presented by J. Jacquinot)<br />
<strong>IAEA</strong>-CN-47/F-M<br />
H. Altmann, R.J. Anderson, J. Arbez, W. Bailey, D.V. Bartlett, B. Beaumont',<br />
G. Beaumont, K. Behringer, P. Bertoldi, E. Bertolini, C.H. Best, V. Bhatnagar 2 ,<br />
R.J. Bickerton, A. Boileau 3 , F. Bombarda 4 , T. Bonicelli, S. Booth, A. Boschi,<br />
G. Bosia, M. Botman, H. Brelen, H. Brinkschulte, M.L. Browne, M. Brusati,<br />
T. Budd, M. Bures, P. Butcher, H. Buttgereit, D. Cacaut, C. Caldwell-Nichols,<br />
J.D. Callen 5 , D.J. Campbell, J. Carwardine, G. Celentano, CD. Challis,<br />
A. Cheetham, J.P. Christiansen, C. Christodoulopoulos, P. Chuilon, R. Claesen,<br />
J.P. Coad, S.A. Cohen 6 , M. Cooke, J.G. Cordey, W. Core, S. Corti,<br />
A.E. Costley, G.A. Cottrell, M. Cox 7 , C. David, J. Dean, L. de Kock,<br />
E. Deksnis, G.B. Denne, G. Deschamps, K.J. Dietz, J. Dobbing, S.E. Dorling,<br />
D.F. Diichs, G. Duesing, P.A. Duperrex 8 , H. Duquenoy, A.W. Edwards,<br />
J. Ehrenberg 9 , W. Engelhardt, S.K. Erents 7 , F. Erhorn, B.T. Eriksson,<br />
M. Evrard 2 , H. Falter, N. Foden, M.J. Forrest 7 , C. Froger, K. Fullard,<br />
G. Fussmann 9 , M. Gadeberg 10 , A. Galetsas, A. Gallacher, D. Gambier 1 ,<br />
R. Giannella 4 , A. Giannelli 4 , A. Gibson, R.D. Gill, A. Goede, A. Gondhalekar,<br />
C. Gordon, C. Gormezano, N.A. Gottardi, C.W. Gowers, R. Granetz, B. Green,<br />
S. Gregoli, F.S. Griph, R. Haange, J.H. Hamnen", C.J. Hancock, P.J. Harbour,<br />
N.C. Hawkes 7 , P. Haynes 7 , T. Hellsten, J.L. Hemmerich, R. Hemsworth,<br />
F. Hendriks, R.F. Herzog, L. Horton 12 , J. How, M. Huart, A. Hubbard 13 ,<br />
J. Hugill 7 , M. Hugon, M. Huguet, B. Ingram, H. Jackel 9 , J. Jacquinot,<br />
Z. Jankowicz 14 , O.N. Jarvis, E.M. Jones, P. Jones, T.T.C. Jones, C. Jupeii 15 ,<br />
E. Kallne, J. Kallne, O. Kaneko 16 , A. Kaye, B.E. Keen, M. Keilhacker,<br />
G. Kinahan, S. Kissel, A. Konstantellos, M. Kovanen", U. Kiiphnapfel 9 ,<br />
P. Kupschus, P. Lallia, J.R. Last, L. Lauro-Taroni, K.D. Lawson 7 , E. Lazzaro,<br />
R.C. Lobel, P.J. Lomas, N. Lopes-Cardozo 18 , M. Lorenz-Gottardi, C. Jj>wry 13 ,<br />
G. Magyar, D. Maisonnier, M. Malacarne, V. Marchese, P. Massmann,<br />
G.M. McCracken 7 , P. McCullen, M.J. Mead, P. Meriguet, V. Merlo,<br />
V. Mertens 9 , S. Mills, P. Millward, A. Moissonnier, P.L. Mondino, D. Moreau',<br />
P.D. Morgan, E.R. Muller 9 , D. Murmann 9 , G. Murphy, M.F. Nave,<br />
L. Nickesson, P. Nielsen, P. Noll, S. Nowak, W. Obert, M. Olsson, J. O'Rourke,<br />
M.G. Pacco, J. Paillere, S. Papastergiou, J. Partridge 7 , D. Pasini 12 , N.J. Peacock 7 ,<br />
M. Pescatore, J. Plancoulaine, J.-P. Poffe\ R. Prentice, T. Raimondi, J. Ramette 1 ,<br />
C. Raymond, P.H. Rebut, J. Removille, W. Riediker, R. Roberts,<br />
D.C. Robinson 7 , A. Rolfe, R.T. Ross, G. Rupprecht 9 , R. Rushton, H.C. Sack,<br />
G. Sadler, J. Saffert, N. Salmon 13 , F. S<strong>and</strong>, A. Santagiustina, R. Saunders,<br />
M. Schmid, F.C. Schiiller, K. Selin, R. Shaw, A. Sibley, D. Sigournay,<br />
R. Sillen 18 , F. Simonet 1 , R. Simonini, P. Smeulders, J.A. Snipes 7 , K. Sonnenberg,<br />
L. Sonnerup, M.F. Stamp, C.A. Steed, D. Stork, P.E. Stott, T.E. Stringer,<br />
D.R. Summers, H.P. Summers 19 , A.J. Tagle, G. Tallents 20 , A. Tanga, A. Taroni,<br />
A. Terrington, A. Tesini, P.R. Thomas, E. Thompson, K. Thomsen 10 , F. Tibone,<br />
R. Tivey, T.N. Todd 7 , P. Trevalion, M. Tschudin, B.J. Tubbing 18 , P. Twynam,<br />
E. Usselmann, H. Van der Beken, J.E. Van Montfoort, M. von Hellermann,<br />
J. von Seggern 21 , T. Wade, C. Walker, B.A. Wall<strong>and</strong>er, M. Walravens,<br />
449
450 JET TEAM<br />
K. Walter, M.L. Watkins, M. Watson, D. Webberley, A. Welter', J.A. Wesson,<br />
J. Wilks, T. Winkel, C. Woodward, M. Wykes, D. Young, L. Zannelli,<br />
J.W. Zwart<br />
JET Joint Undertaking,<br />
Abingdon, Oxfordshire,<br />
United Kingdom<br />
Abstract<br />
RADIOFREQUENCY HEATING ON JET.<br />
High power ICRF, P < 7.2 MW, has been coupled to the JET plasma in a variety of conditions:<br />
outboard limiters, inner wall, combined operation with neutral beams <strong>and</strong> pellet injection. Long pulse<br />
modulation experiments (10 s) yield a precise deposition which is extremely localized, in agreement with<br />
expectations. The best heating efficiency is obtained when the minority resonance crosses the magnetic<br />
axis. With off-axis heating, the ion temperature profile broadens more than the electron temperature<br />
profile. A new operating regime called 'monster sawtooth' has been found during combined RF <strong>and</strong><br />
NBI heating. The MHD quiet regime can last 1.26 s <strong>and</strong> the central electron temperature rises to<br />
7.4 keV with a D-D reaction rate of 4 x 10 15 s" 1 . The temperature profile steepens over the entire profile<br />
<strong>and</strong> rE is enhanced by a factor of 2.5 for a combined power of 10 MW. RF heating of plasma<br />
fuelled with a single mildly penetrating pellet exhibits the normal L-mode behaviour. In combination<br />
with NBI, the input power reaches 16 MW <strong>and</strong> the plasma stored energy reaches 5.8 MJ at the highest<br />
plasma current of 5 MA. Recent experiments in single-null X-point configuration with combined heating<br />
have shown the transition to an enhanced confinement regime (H-mode).<br />
1<br />
CEA, Centre d'&udes nucle'aires de Fontenay-aux-Roses, France.<br />
2<br />
Plasma Physics Laboratory, Association "Euratom-Belgian State" ERM/KMS, Brussels, Belgium.<br />
3<br />
Institut national de la recherche scientifique, Ste-Foy, Quebec, Canada.<br />
4<br />
ENEA, Centro Ricerche Energia, Frascati, Italy.<br />
5<br />
Department of Physics, University of Wisconsin, Madison, WI, USA.<br />
6<br />
Princeton Plasma Physics Laboratory, Princeton University, NJ, USA.<br />
7<br />
UKAEA, Culham Laboratory, Abingdon, Oxfordshire, UK.<br />
8<br />
Centre de recherches en physique des plasmas, Ecole poly technique f&le'rale de Lausanne,<br />
Switzerl<strong>and</strong>.<br />
9<br />
Max-Planck-Institut fur Plasmaphysik, Garching, Fed. Rep. Germany.<br />
10<br />
Ris0 National Laboratory, Roskilde, Denmark.<br />
11<br />
Swedish Energy Research Commission, Stockholm, Sweden.<br />
12<br />
Natural <strong>Sciences</strong> <strong>and</strong> Engineering Research Council, Ottawa, Ontario, Canada.<br />
13<br />
Imperial College of Science <strong>and</strong> Technology, University of London, UK.<br />
14<br />
RCC CYFRONET IAE, Otwock-Swierk, Pol<strong>and</strong>.<br />
15<br />
University of Lund, Sweden.<br />
16<br />
Department of Physics, University of Nagoya, Japan.<br />
17<br />
Department of Physics, Lappeenranta University of Technology, Lappeenranta, Finl<strong>and</strong>.<br />
18<br />
FOM Instituut voor Plasmafysica, Rijnhuizen, Nieuwegein, Netherl<strong>and</strong>s.<br />
19<br />
University of Strathclyde, Glasgow, UK.<br />
20<br />
Research School of Physical <strong>Sciences</strong>, Australian National University, Canberra, Australia.<br />
21 Kernforschungsanlage Julich GmbH, Fed. Rep. Germany.
<strong>IAEA</strong>-CN-47/F-I-1 451<br />
1. INTRODUCTION<br />
Initial ICRF heating experiments on JET have recently been reported [1,2]. Performed at a<br />
maximum power level of 5MW, these experiments revealed a degradation in energy confinement<br />
with increased power, following a behaviour previously observed in Tokamaks with a<br />
cold plasma edge. It appeared difficult to raise the electron temperature outside the q = 1 surface<br />
above the ohmic heating value.<br />
The heating sources have now been increased up to 7.2 MW using three ICRF antennagenerator<br />
units [3] <strong>and</strong> to 10 MW with NBI [4]. Combined ICRF <strong>and</strong> NBI heating to a maximum<br />
power of 16 MW has successfully been achieved, <strong>and</strong> a wider variety of operating regimes<br />
have been investigated. These results are summarised below. Experiments performed<br />
with ICRF alone are addressed in the first three sections, in which emphasis is placed on power<br />
modulation to deduce the deposition profile, on off-axis heating <strong>and</strong> on the effect of antenna<br />
phasing. The last sections described specific aspects of combined ICRF, NBI <strong>and</strong> Pellet<br />
operation. In particular, injected beam ions appear to be accelerated when the RF is applied<br />
<strong>and</strong>, in some conditions, the internal sawteeth are stabilized <strong>and</strong> a high central electron temperature<br />
is achieved ('Monster' mode).<br />
2. MODULATION EXPERIMENT AND POWER DEPOSITION PROFILE<br />
The power deposition profile can be inferred from the change of slope of the temperature evolution<br />
during the sharp rise of the applied heating source. A variant is to observe the slope<br />
of internal sawteeth [5]. The signal-to-noise ratio is generally mediocre <strong>and</strong> the method could<br />
only be applied to heating on axis at high power density. Experiments with long <strong>and</strong> amplitude<br />
modulated heating pulses offer the opportunity to use noise rejection techniques, such<br />
as the box-car or the fast Fourier transform. The frequency of modulation VM can be scanned<br />
across the characteristic energy exchange <strong>and</strong> transport frequencies to reveal the dominant<br />
energy channels. In these experiments, VM was between 5-62Hz, the heating pulse lasted during<br />
10s <strong>and</strong> the peak-to-peak modulation was about 1MW. The local perturbation of the electron<br />
temperature was measured with a 12-channeI polychromator.<br />
When the modulation frequency is high enough, the response of the electron species is adiabatic<br />
<strong>and</strong> it is possible to deduce directly the power density Pe transferred to the electrons,<br />
as shown in Fig. la,b. In both cases, the peak response is close to the location of the cyclotron<br />
resonance <strong>and</strong> the width of the deposition (FWHM) is ~ 60cm for on-axis heating <strong>and</strong> - 20cm<br />
for off-axis heating.<br />
The experimental result is compared with theoretical descriptions using either the ray tracing<br />
technique [6] or full wave solutions [7] .Both models take into account the D-shape crosssection<br />
<strong>and</strong> the actual plasma parameters. These both predict that most of the coupled power<br />
is first transferred to the minority species, as observed, <strong>and</strong> is subsequently redistributed by<br />
collisions according to Table I. In the ray tracing model, part of the power (~ 20%) is not absorbed<br />
<strong>and</strong> is assumed lost in the wall or the edge. A very small part ( = 5%) goes directly to<br />
the electrons <strong>and</strong> ions. In the full wave model, the pressure anisotropy of the minority is taken<br />
into account. A significant fraction of the power is directly coupled to the deuterons (10 to 20%).<br />
Note that electron heating prevails with heating on-axis, but, as the power density decreases<br />
with off-axis heatingjon heating increases. At high power, electron heating tends to dominate<br />
in all cases. Both models give a good representation of the observed deposition profile (Fig.la.b).<br />
The agreement is excellent for off-axis heating. Central heating is somewhat broader than<br />
predicted.<br />
The observed temperature modulation decreases rapidly with vu(Te
452 JET TEAM<br />
e<br />
[kW/m 3 ]<br />
Pe/3M 50<br />
40<br />
30<br />
20<br />
(a)<br />
10 -<br />
"kW/m 3 ]<br />
10<br />
5<br />
n<br />
b)<br />
-<br />
A<br />
A<br />
A<br />
C<br />
*<br />
¥<br />
•<br />
«<br />
s<br />
X<br />
+<br />
0<br />
»<br />
r<br />
4<br />
#9255 "<br />
Modulation<br />
sxperiment<br />
lay tracing<br />
-ull wave<br />
n f<br />
3.1 Z.2 3.3 3.4<br />
O<br />
i<br />
D '<br />
D<br />
a<br />
o<br />
D<br />
R(m)<br />
100<br />
80<br />
- 60<br />
40<br />
20<br />
[kW/m 3 ]<br />
[kW/m<br />
-{-Modulation -<br />
experiment<br />
3 ]<br />
-30<br />
- J l~'<br />
i • ' ' ""<br />
8 1 I<br />
o Ray tracing<br />
A Full wave<br />
- 15<br />
3.6 3.7 3.8 3.9<br />
R(m)<br />
FIG. 1. Net power density Pe transferred to electrons, deduced from the adiabatic modulation of Te<br />
during long pulse ICRF modulation experiments: 1.3 MW peak modulation, 12.5 Hi, H minority.<br />
Comparison with theory: (a) on-axis heating B^ = 3.4 T, v = 47.7 MHz. (b) off-axis heating<br />
B^ = 2.9 T, v = 37 MHz. Heating via the minority is demonstrated by comparison with theory.<br />
of fe- KVM) has been used to determine the power coupled to the minority. Results are given<br />
in Table I.<br />
3. OFF-AXIS HEATING<br />
The importance of power localisation has been studied in two series of experiments. In the<br />
first [2,8], the minority resonance position is scanned by ramping down the toroidal magnetic<br />
field during the RF pulse. In the second, the same effect is obtained by varying the wave<br />
frequency in the same plasma conditions. Moreover, the experiment was carried out after a
TABLE I. TRANSFER OF POWER<br />
Comparison of two models with experiment<br />
Power input (Pc)<br />
1.3MW<br />
On-axis<br />
Ray tracing<br />
Off-axis<br />
On-axis<br />
Full wave<br />
Off-axis<br />
On-axis<br />
Observed<br />
Off-axis<br />
Directly to<br />
Minority H<br />
(Pm/Pe)<br />
0.75<br />
0.71<br />
0.80<br />
0.90<br />
0.6 ± 0.12<br />
0.7 ± 0.15<br />
<strong>IAEA</strong>-CN-47/F-M 453<br />
To electrons<br />
(Pe/Pc)<br />
0.42<br />
0.15<br />
0.34<br />
0.25<br />
>0.31 ± 0.06<br />
>0.15 ± 0.03<br />
To deuterons<br />
(Prf/Pc)<br />
0.39<br />
0.60<br />
0.66<br />
0.75<br />
not<br />
measured<br />
heavy carbonisation to avoid the radiated power increase when the resonance is far off-axis<br />
<strong>and</strong> with long pulses (~ 8s) to avoid transient effects. Both series give similar results, for example:<br />
• Large amplitude sawteeth on both Te <strong>and</strong> 7] were observed only when the ion-ion hybrid<br />
resonance was inside the inversion radius [2, 8]. The sawteeth do not disappear with far<br />
off-axis heating, but become small <strong>and</strong> short.<br />
• The largest increase of central temperature <strong>and</strong> stored energy was achieved with central<br />
heating (Fig. 2). The increase of Te was only weakly dependent on the resonance location<br />
[2].<br />
The deuteron temperature profile (from NPA) appears to broaden with heating off-axis (Fig.<br />
3b). On the contrary, the electron temperature profile is only slightly broadened (Fig.3a) outside<br />
the q = 1 volume.<br />
Transport code simulations of off-axis heating cases indicate that the energy transport coefficient,<br />
xe, re-adjusts itself to try to conserve a similar Te profile, by lowering \e inside the heating<br />
region <strong>and</strong> by further increasing it outside the heating zone.<br />
4. ANTENNA PHASING AND EDGE EFFECTS<br />
Among the three antennas, two are of the dipole-quadrupole type [1] <strong>and</strong> internal phasing<br />
of the two coupling elements allows the launching of a kn spectrum which is peaked either<br />
for ArM =0 or for kn =7m"'. In addition, these two antennas, located on either side of a large<br />
horizontal port, can be phased relative to each other. When the dipoles are out of phase, two<br />
peaks at kn =2m -1 <strong>and</strong> 7 m" 1 are emitted; 90° phase difference produces a small portion of<br />
travelling wave (directivity « 5%). All these phasing conditions have been compared, using<br />
a target plasma which maximizes the impurity effects with ICRF (low density = =<br />
1.1 x 10 19 m~ 3 , no carbonisation for several months). The following observations were made:<br />
• Phasing between the two adjacent antennas, each being in the dipole mode (kn =0) did<br />
not produce any measurable difference on wave coupling, edge plasma or plasma heating.
454 JET TEAM<br />
AW<br />
APTOT<br />
Is)<br />
0.3<br />
Q2<br />
0.1<br />
D (H)<br />
B,= 2.3 & 2.5T<br />
Ip = 2.5 MA<br />
' after heavy<br />
carbonisation<br />
2.0 25 3.0 | 35 40<br />
Rres (m) Plasma centre Plasma edge<br />
FIG. 2. Incremental confinement time versus position of the H resonance. The frequency was varied<br />
between 25 <strong>and</strong> 48 MHz. Data points following a heavy carbonisation are identified.<br />
• Phasing internally in the quadrupole mode produced not only reduced coupling resistance<br />
[1 ] but also a marked reduction of specific ICRF effect on the edge plasma. In particular,<br />
the flattening of scrape-off-layer density <strong>and</strong> temperature profiles observed with dipoles<br />
disappears with the quadrupole, <strong>and</strong> the increase of metallic ions originating from the<br />
activated screen (Cr for one antenna, Ni for the other [9]) is about halved. The density<br />
evolution was also different in the two cases: the average density increased more with the<br />
quadrupole. Despite this higher density, the radiated power Pmd was significantly lower<br />
<strong>and</strong> the carbon released from the wall was typically x 2-3 smaller. The heating efficiency<br />
defined by the incremental confinement time rinc = (AW/AP) was higher in the quadrupole<br />
phasing by typically 25 % for similar plasma conditions. Table II summarizes this<br />
comparison between the two phasing conditions, in which lNi, Io are the intensities of<br />
Ni XXVI <strong>and</strong> Cr XXII lines <strong>and</strong> is total neutral flux.<br />
It is clear from these experiments that the edge modification induced with dipole phasing<br />
is considerably reduced with the quadrupole. The metallic impurity emitted by the activated<br />
screen <strong>and</strong> the insensitiveness of phasing between adjacent antennas suggest that the RF field<br />
pattern immediately in front of each antenna screen plays a key role.<br />
5. HIGH POWER EXPERIMENTS : OPERATING REGIMES<br />
With ICRF alone, it is difficult to couple large amounts of power when the plasma current<br />
is low (e.g. at Jp=1 MA). The plasma disrupts at only 1MW, as the density rise during ICRF<br />
approaches the density limit. At Ip> 2MA, no power limit was found. Combined ICRF <strong>and</strong><br />
NBI operation removed the power limitations at 1 MA.<br />
Experiments with long pulses (5MW, 8s) have shown that quasi-stationary conditions are<br />
reached after about 2s. No serious accumulation of high-Z impurity was observed <strong>and</strong> the<br />
plasma central temperatures remained constant after the initial rise.<br />
Neutral beam injection increased the antenna coupling resistance. This increase can be highly<br />
beneficial; for instance, when the plasma is in contact with the inner wall <strong>and</strong> 5cm away from<br />
the antenna, the coupling resistance more than doubled. The technical difficulty of coping<br />
with large changes of coupling resistance meant that it can be difficult to maintain constant
<strong>IAEA</strong>-CN-47/F-I1 455<br />
TABLE II. COMPARISON OF DIPOLE AND QUADRUPOLE PHASING<br />
1 MW coupled power <strong>and</strong> identical starting plasma conditions<br />
Dipole<br />
Quadrupole<br />
A/M<br />
<br />
(a.u)<br />
1.8<br />
1.2<br />
[klv] 3.0<br />
Me,<br />
<br />
(a.u)<br />
3.1<br />
1.5<br />
APnd<br />
(MW)<br />
0.74<br />
0.57<br />
AZ
456<br />
f(E)<br />
\<br />
10"<br />
10<br />
io 16<br />
10 15<br />
• \<br />
\<br />
JET TEAM<br />
' '<br />
Deuterium<br />
Hydrogen<br />
, .1<br />
1<br />
#8909<br />
NBI (D) (o)<br />
ICRF* NBI (D) (•)<br />
ICRF* NBI (D)M<br />
\<br />
\ / \<br />
\0<br />
\<br />
\<br />
F \<br />
1<br />
s \<br />
\<br />
\<br />
1<br />
20 40 60 80 100 120<br />
Energy [keV]<br />
FIG. 4. Deuterium <strong>and</strong> hydrogen energy spectra before <strong>and</strong> during a 'monster sawtooth'<br />
(PNBl = 2.5 MW, 65 keV; P^ = 7MW). Ip = 2 MA, B^ = 2.13 T, v = 31.8 MHz. Acceleration of<br />
beam injected ions up to 120 keV is observed.<br />
RF power when the beams are switched on during a RF pulse. Injecting RF power during a<br />
NBI pulse is normally straightforward. The variation of coupling resistance with the crash<br />
of the large sawteeth is often a factor limiting the power during the pulse.<br />
6. COMBINED RF AND PELLET INJECTION<br />
Combining ICRF with pellet injection did not raise any special technical problems. 6MW RF<br />
could be applied at the time of injection of a mildly penetrating pellet (3.6 mm, lkm-s" 1 ). The<br />
power was ramped up over 0.5s. The change of coupling resistance due to the pellet was hardly<br />
noticeable. The ratio of radiated power to input power increased only slightly by 10-20%<br />
despite a doubling of the average density. The pellet increased the density from<br />
=1.9xlO 19 m~ 3 to 3.7xlO 19 m" 3 . Without RF, the density decayed typically on a Is<br />
time scale. With RF, the density was sustained at its maximum level <strong>and</strong> even slightly increased<br />
for the duration of the RF pulse (2s). The increase of 7X0) <strong>and</strong> 7;(0) with PRF/ was<br />
comparable with the largest increments obtained in the similar discharges without the pellet.<br />
The energy confinement during RF was not modified by pellet injection. The incremental confinement<br />
time with the pellet becomes Tmc = 0.2 s. Large sawteeth appear early in the reheat<br />
phase. The pellet penetration was not changed by the presence of ICRF.<br />
7. COMBINED HEATING AND BEAM ACCELERATION<br />
Generally, ICRF plasma heating on the outboard limiters behaves according to the L-mode<br />
scaling law [1,2]. Recent combined NBI <strong>and</strong> ICRF heating up to 16MW has been performed.<br />
The energy confinement scaling is reported in [10]. Again L-mode behaviour is found, although<br />
inner wall operation <strong>and</strong> high -q operation perform somewhat better than the 'Goldston Lmode<br />
scaling'. Both H <strong>and</strong> He 3 minority scenarios have been tested, but the stored energy<br />
increase is not appreciably different in the two cases.<br />
In combined RF <strong>and</strong> NBI heating, the H minority scenario has a distinctive feature: power<br />
can be coupled to the energetic D beam ions at the harmonic cyclotron resonance. It is calculated<br />
[11] that the NBI current drive will be enhanced by ICRF. The beam acceleration also<br />
enhances the fusion reactivity.
04<br />
•TOT<br />
[io 9 s'w" 1 ;<br />
Q2<br />
0.1<br />
<strong>IAEA</strong>-CN-47/F-M 457<br />
02<br />
x D( 3 He) IP = 3MA<br />
- D (H) Ip = 3MA<br />
•D(H) JI.P'2,3MA<br />
I inner wall _<br />
XD (H) 'M'discharges<br />
0.4 0.6 0.8 1.0<br />
FIG. 5. Fusion D-D reaction rate normalized to the total input power versus the ratio of RF to total<br />
additional power. The beam plasma reaction is maintained proportional to the additional power,<br />
independently of its origin, provided P^iP^j + P^) ^ 0.5. Monster sawteeth give a larger<br />
fusion yield.<br />
Figure 4 demonstrates beam acceleration by ICRF. The slope of the energy distribution function<br />
above the injection energy increases from 5keV to 16keV. Simulation by a Fokker-Planck<br />
calculation [12] requires that a substantial fraction of the incident RF power is coupled to the<br />
beam ions. However, note that the high energy tail of the proton still exceeds the D tail (Fig.<br />
4)<strong>and</strong>mostof coupled power is still transferred to the protons. The fraction of power directly<br />
transferred to the beam ions is estimated [13] to be about 10%. It is expected to increase nonlinearly<br />
with RF power.<br />
The fusion reactivity in these D ->D injection experiments is dominated by beam-plasma<br />
reactions. RF heating increases the reactivity roughly in proportion to the total heating power<br />
(cf. Fig. 5) provided the RF power does not exceed the NBI power. Comparison between<br />
the He 3 <strong>and</strong> H minority shows that a higher reactivity is obtained in the H minority experiments<br />
{nH/nD~2x\0~ 2 ).<br />
8. MONSTER SAWTOOTH<br />
Unusually long sawteeth <strong>and</strong> high fusion reactivity have been observed in the so-called 'Monster<br />
sawtooth' regime in the following conditions:<br />
— IP=2 - 2.2MA, 5^=2.1 - 2.2T, Plasmas lying on the inner wall. H minority, RF alone<br />
or combined with beams<br />
— IP=5MA, 5*=3.4T, He 3 minority, combined heating<br />
— 5MW
458<br />
[keV]<br />
70<br />
6.0<br />
5.0<br />
4.0<br />
3.0<br />
2.0<br />
1.0 -<br />
#8909 /<br />
/<br />
/<br />
/<br />
/<br />
/<br />
-/<br />
i<br />
t<br />
I 7<br />
i . i<br />
IS 3.0<br />
f<br />
3<br />
JET TEAM<br />
y:<br />
Ohmic^<br />
3.2<br />
\<br />
\<br />
Te<br />
\<br />
\<br />
\\<br />
5 ^"~<br />
<<br />
X 5 t<br />
^ ^ N B I •RF<br />
7 .<br />
N<br />
1 . 1<br />
3.4 3.6<br />
1<br />
3B<br />
4.0 4.2<br />
R[m]<br />
FIG. 6. Te profile before heating (ohmic) during PNBI (2.5 MW) <strong>and</strong> during a 'monster sawtooth'<br />
(NBI = 2.5 MW, PRF = 7 MW). In each case, the curves represent the top <strong>and</strong> bottom of a sawtooth.<br />
Note the increase of the inversion radius.<br />
Time[s]<br />
FIG. 7. Evolution of the stored energy during the longest 'monster sawtooth' (1.26 s). Although Te<br />
saturates, the density <strong>and</strong> the stored energy keep increasing. PNBl = 2.6 MW (80 keV), Pgp = 5.5 MW,<br />
Ip = 2.2 MA, B^ = 2.18 T.<br />
after 1.26s (Fig. 7). The incremental confinement time T,nc = AW/AP^Fis somewhat improved<br />
over the usual conditions. Typically, T,nc=250ms at the end of the 'Monster' instead of 200ms<br />
in normally sawteething discharges. The pressure anisotropy is mild: f}pi = 1.13 Ppn =0.5. The<br />
crash of the monster releases 30% of the stored energy. Thereafter, the MHD activity is high<br />
(mostly n=2 modes) <strong>and</strong> the confinement appears degraded. In these experiments, the poloidal<br />
beta reached 0.5 <strong>and</strong> the ion temperature was between 5 <strong>and</strong> 7keV.
<strong>IAEA</strong>-CN-47/F-I-1 459<br />
9. TRANSITION TO AN 'H-MODE 1<br />
Preliminary experiments with combined heating in a single null X-point configuration exhibited<br />
the change of edge <strong>and</strong> bulk plasma parameters in the Asdex H-mode behaviour. The transition<br />
occurred wiht 7MW of combined heating in the Hydrogen minority regime. After the<br />
transition, the density rose, the temperature remaining constant, <strong>and</strong> the confinement time<br />
increased from 0.35s to 0.6s.<br />
10. CONCLUSIONS<br />
After a year of operation on JET, ICRF heating has reached record levels of RF power <strong>and</strong><br />
electron temperatures in a Tokamak. Eight water cooled antennas will be installed in 1987 <strong>and</strong><br />
connected to a 32MW power source. Recent results give confidence that JET will demonstrate<br />
a fusion output comparable to the heating power input.<br />
REFERENCES<br />
[1] JACQUINOT, J., et al., Plasma Phys. Contrail. Fusion 28 (1986) 1.<br />
[2] LALLIA, P.P., et al., Plasma Phys. Controll. Fusion 28 (1986) 1211.<br />
[3] KAYE, A.S., in Fusion Engineering (Proc. 11th Symp. Austin, TX, 1985), Vol. 2, IEEE, New<br />
York (1986) 1204.<br />
[4] DUESING, G., et al., Plasma Phys. Controll. Fusion 28 (1986) 1429.<br />
[5] GAMBIER, D., et al., in Controlled Fusion <strong>and</strong> Plasma Physics (Proc. 12th Europ. Conf.<br />
Budapest, 1985), Vol. 9F, Part n, European Physical Society. (1985) 152.<br />
[6] BHATNAGAR, V.P., KOCH, R., GEILFUS, P., KIRKPATRICK, R., WEYNANTS, R.R.,<br />
Nucl. Fusion 24 (1984) 955.<br />
[7] HELLSTEN, T., APPERT, K., in Controlled Fusion <strong>and</strong> Plasma Heating (Proc. 13th Europ.<br />
Conf. Schliersee, 1986), Vol. IOC, Part II, European Physical Society (1986) 129.<br />
[8] SAND, F., et al., ibid., p. 197.<br />
[9] BEHRINGER, K., et al., Paper <strong>IAEA</strong>-CN-47/A-IV-l, these Proceedings, Vol. 1.<br />
[10] CORDEY, J.G., et al., Paper <strong>IAEA</strong>-CN-47/A-1I-3, these Proceedings, Vol. 1.<br />
[11] HAMNEN, H., et al., in Controlled Fusion <strong>and</strong> Plasma Heating (Proc. 13th Europ. Conf.<br />
Schliersee, 1986), Vol. 10C, Part II, European Physical Society (1986) 425.<br />
[12] CORE, W., et al., ibid., p. 73.<br />
[13] COTTRELL, G., private communication, 1986.<br />
DISCUSSION<br />
R.J. GOLDSTON: Do you have any idea why the duration of the 'monster sawtooth'<br />
before the crash is so long?<br />
J. JACQUINOT: We first thought this might be due to NBI current drive<br />
enhanced by the local increase in Te produced by ICRF. The recent observation that<br />
good 'monster sawteeth' with similar input powers are also obtained with RF alone<br />
weakens this model very much <strong>and</strong> leaves us without a clear physical picture to offer<br />
as an explanation.
460 JET TEAM<br />
K. ITOH: During the 'monster sawtooth', the time behaviour of the electron<br />
temperature indicates that the electron energy confinement is not improved, while the<br />
total stored energy increases continuously. Do you observe any increase in ion energy<br />
which is due to the appearance of the 'monster sawtooth'? And do you conclude that<br />
ion energy confinement is improved by 'monster sawteeth'?<br />
J. JACQUINOT: The improvement of confinement during a 'monster sawtooth'<br />
seems to be related with the continuous increase in electron density <strong>and</strong> in the<br />
size of the q = 1 surface. The additional stored energy is mainly in the electrons.
ION CYCLOTRON HEATING<br />
AND LOWER HYBRID EXPERIMENTS<br />
ON ASDEX<br />
<strong>IAEA</strong>-CN-47/F-I-2<br />
K. STEINMETZ, F.X. SOLDNER, D. ECKHARTT, G. JANESCHITZ,<br />
F. LEUTERER, F. MAST, K. McCORMICK, J.-M. NOTERDAEME,<br />
C. SETZENSACK, F. WAGNER, F. WESNER, I. BAUMLER, G. BECKER,<br />
H.S. BOSCH, M. BRAMBILLA, F. BRAUN, H. BROCKEN, H. DERFLER,<br />
A. EBERHAGEN, H.-U. FAHRBACH, G. FUSSMANN, R. FRITSCH,<br />
O. GEHRE, J. GERNHARDT, G. von GIERKE, E. GLOCK, O. GRUBER,<br />
G. HAAS, J. HOFMANN, F. HOFMEISTER, K. HUBNER 1 ,<br />
A. IZVOZCHIKOV 2 , F. KARGER, M. KEILHACKER 3 , O. KLUBER,<br />
M. KORNHERR, K. LACKNER, M. LENOCI, G. LISITANO,<br />
E. VAN MARK, H.M. MAYER, D. MEISEL, V. MERTENS, E.R. MULLER,<br />
E. MUNICH, H. MURMANN, H. NIEDERMEYER, Z.A. PIETRZYK 4 ,<br />
W. POSCHENRIEDER, S. PURI, H. RAPP, H. RIEDLER, H. ROHR, J. ROTH,<br />
F. RYTER 5 , K.H. SCHMITTER, F. SCHNEIDER, G. SILLER,<br />
P. SMEULDERS 3 , E. SPETH, K.-H. STEUER, T. VIEN, O. VOLLMER,<br />
H. WEDLER, D. ZASCHE, M. ZOUHAR<br />
Euratom-IPP Association,<br />
Max-Planck-Institut fur Plasmaphysik,<br />
Garching, Federal Republic of Germany<br />
Abstract<br />
ION CYCLOTRON RESONANCE HEATING AND LOWER HYBRID EXPERIMENTS ON<br />
ASDEX.<br />
A summary is given of recent experimental investigations with ICRH <strong>and</strong> LH on the divertor<br />
tokamak ASDEX. Hydrogen second harmonic heating (20CH at 67 MHz), hydrogen minority heating<br />
(D(H) at 33.5 MHz), <strong>and</strong> ICRH in combination with neutral beam injection (NI) are compared in detail<br />
at different parameters (PIC < 2.6 MW, PNI < 4.4 MW, IP = 250 to 450 kA, ne = 2 to 9 x 10 13<br />
cm" 3 ). Heating <strong>and</strong> current drive with waves have been studied in Ohmic target plasmas <strong>and</strong> in combination<br />
with NI heating up to a total heating power of 4 MW (PNI < 3 MW plus PLH < 1 MW).<br />
' University of Heidelberg, Heidelberg, Fed. Rep. Germany.<br />
1 Academy of <strong>Sciences</strong>, Leningrad, USSR.<br />
3 JET Joint Undertaking, Abingdon, Oxfordshire, UK.<br />
4 University of Washington, Seattle, WA, USA.<br />
5 CEA, Centre d'etudes nucl6aires de Grenoble, France. Present address: Centre de recherches<br />
en physique des plasmas, Ecole polytechnique fddeYale de Lausanne, Lausanne, Switzerl<strong>and</strong>.<br />
461
462 STEINMETZ et al.<br />
ION CYCLOTRON RESONANCE HEATING<br />
Various heating schemes have been investigated on ASDEX:<br />
Hydrogen second harmonic heating (2n , 67 MHz, in pure<br />
hydrogen or D/H mixtures), hydrogen minority heating (D(H),<br />
33.5 MHz, nu/n = 5%), neutral beam injection (H •»• H ,<br />
H° + D + , D° •»• H + , D° -> D ) <strong>and</strong> the combination of NI with<br />
ICRH. Thus, a thorough comparison with respect to heating,<br />
confinement, <strong>and</strong> plasma performance in a wide range of<br />
parameters can be provided.<br />
H-mode with pure ICRF heating<br />
The H-mode has been realized - for the first time - with ICRH<br />
alone in the D(H)-minority scheme at an absorbed RF power of<br />
about 1.1 MW /1, 2/. Thus, it appears that the dominant con-<br />
finement regimes of auxiliary heated plasmas are found to be<br />
independent of the heating method. At that power level the H-<br />
mode is achieved just marginally as shown in Fig. 1 where a<br />
typical example of an ICRF heated discharge is displayed in<br />
comparison to an L-type plasma. The H-mode, developing out of<br />
an L-phase with sawteeth, shows all characteristic features<br />
like a distinct drop in the H -signal in the divertor chamber<br />
(which is mostly a measure of the reduced power flux into the<br />
divertor), rising electron density (indicating an improved par-<br />
ticle confinement), enhanced plasma energy content (owing to<br />
improved energy confinement), a significantly enhanced edge<br />
electron temperature (rising from about 50 eV to 250 eV at<br />
r/a = 0.98; not shown in Fig. 1), <strong>and</strong> the existence of the<br />
typical MHD-phenomenon, called ELMs (edge localized modes) /3/.<br />
The sudden occurrence of ELM-free phases (marked by H*) changed<br />
the antenna coupling to such an extent that always one of the<br />
generators terminated operation by voltage breakdown. Unfortu-<br />
nately, this technical difficulty could not be avoided so far.
<strong>IAEA</strong>-CN-47/F-I-2 463<br />
nH/ne-97.<br />
FIG. 1. Plasma energy, line averaged electron density, <strong>and</strong> Ha signal of 1CRF heated discharges<br />
with/without H-mode transition.<br />
Hydrogen minority <strong>and</strong> second harmonic heating<br />
Wall carbonisation prevented disruptions otherwise caused by<br />
excessive impurity radiation <strong>and</strong> allowed the ICRH to work up to<br />
maximal power (PTr, = 15 PJLU) without NI assistance. Thus, con-<br />
1U Un<br />
finement conditions of purely ICRF heated plasmas could be<br />
studied. At high power in st<strong>and</strong>ard (double-null) configuration<br />
both RF scenarios follow essentially an L-type scaling where<br />
the D(H)-scheme appears to be slightly better. Figure 2<br />
summarizes the energy confinement times normalized to the<br />
values of the Ohmic phases (which eliminates isotope effects on<br />
rg) for the D(H)-scheme <strong>and</strong> for 2 n^ in hydrogen <strong>and</strong><br />
hydrogen/deuterium mixture plasmas. The confinement degradation<br />
of both RF schemes seems, however, less severe than with beam<br />
heating. This is supported by the observation that, with ICRH,<br />
the particle confinement does only weakly degrade with respect<br />
to the Ohmic phase which is indicated by the constancy of the<br />
plasma density during the ICRH pulse, <strong>and</strong> is supported by an<br />
increased impurity confinement during ICRH with respect to the<br />
NI L-phase (see also Fig.3).<br />
Figure 3 illustrates the decay (transport) times of TiXX,<br />
injected into the plasma by laser blow-off, indicating similar<br />
1.6
464<br />
_ i.o-j<br />
o<br />
0.5-<br />
STEINMETZ et al.<br />
I = 60....95ms<br />
,D(H|.IN<br />
».A NI<br />
+ 2 ilCH a = 0.6<br />
• on DIH) a = 0.6<br />
TVX 2HCH*NI a = 0.7<br />
* 0IH1-NI a = 0.7<br />
4A» 2nCH*NIIH°-H',H°-D*l<br />
FIG. 2. Energy confinement times (normalized to the value of the Ohmic phase) versus total power.<br />
trends for impurity/particle transport <strong>and</strong> confinement. The<br />
transport analysis suggests an enhancement of the inward drift<br />
rather than a reduction of the diffusion coefficient with<br />
respect to NI. It is not yet clear whether the improved<br />
particle confinement or the absence of plasma rotation during<br />
ICRF heating has an influence on the degree of energy confine-<br />
ment degradation.<br />
Combination of ICRH <strong>and</strong> NI<br />
Both RF heating schemes have been combined with neutral beam<br />
injection up to total heating power of P = 4.5 MW = 50 P' .<br />
tOt Un<br />
The injection of either deuterium or hydrogen together with<br />
2 a -launching clearly indicated bulk heating as the main ICRF<br />
On<br />
absorption scenario. Heating by direct coupling of the wave<br />
with the injected particles was found to be negligible /1, 9/.<br />
When combining ICRH + NI the degradation of confinement at high<br />
power seems to be again less severe than with beam heating<br />
alone (Fig. 2). In particular, ICRH + NI data indicate the<br />
existence of a substantial residual energy confinement at high
<strong>IAEA</strong>-CN-47/F-I-2 465<br />
+ ICRHI2ACHI<br />
TE*(2nCH]/TE*(0H) * NI.ICRH I2UCH]<br />
0 0.5 1.0 1.5 2.0<br />
P,C + PNI (MW)<br />
FIG. 3. Transport times of Ti XX compared to global energy confinement.<br />
power (T*-plateau). The corresponding values T|/T|(OH) =<br />
0.43 - 0.50, where T* + aPIC + 0.85 PNI), are<br />
consistent with a T"-analysis modelling the increase of plasma<br />
energy content following an RF power step by W (t) = W (OH)<br />
TC<br />
+AW • (1-exp(-t/Tp)) which gives - under certain assumptions -<br />
P &<br />
a measure of the ultimate energy confinement time at "infinite-<br />
ly" large auxiliary heating power. In these experiments the<br />
plasma energy content has been increased by a factor of 5, from<br />
26 kJ at P.,, = 0.4 MW to 123 kJ at 4.4 MW total heating power.<br />
The improved confinement of the combined scenario is also<br />
supported by a reduced impurity transport (Fig. 3)-<br />
Hydrogen second harmonic heating of two-species plasmas<br />
Second harmonic heating has also successfully been applied to<br />
H/D mixtures of hydrogen concentrations where conventional<br />
hydrogen minority heating at the fundamental frequency does no<br />
longer work. In H/D mixtures where the resonant species (H ) is<br />
a relatively small fraction of the total particle content the<br />
RF heating efficiency, defined as increase of plasma energy<br />
IC<br />
content per MW launched power (AWD /PTP), is found to be<br />
strongly enhanced beyond that of pure hydrogen operation<br />
(Fig. 4) probably due to the isotope effect on confinement as
466<br />
40- .. 2 flCH* NI(D°—D')<br />
D(H].NI(D*—D*]<br />
PN,= 1.9MW<br />
PIC =1.0 MW<br />
STEINMETZ et al.<br />
2nCH.NI(H'-D'l<br />
2nCH.NI(H'-H'|<br />
0 0.2 0.4 0.6 0.8 1.0<br />
nH/nc<br />
FIG. 4. ICRF heating efficiency at various hydrogen concentrations.<br />
observed also with NI heating. At the lowest hydrogen<br />
concentrations (n /n =0.1) the heating efficiency of the<br />
"2fi,, -minority" scenario /1 / ( = 36 kJ/MW) compares well with<br />
that of the conventional D(H)-hydrogen minority mode (=35<br />
kJ/MW) <strong>and</strong> is well above that of 2n -heating in pure hydrogen<br />
Un<br />
(= 21 kJ/MW). Unsuccessful application of 2finu to helium <strong>and</strong><br />
pure deuterium plasmas clearly ruled out the possibility of 4th<br />
harmonic heating.<br />
On the basis of these results second harmonic heating appears<br />
as an attractive scenario for a reactor-like DT-plasma where<br />
efficient heating is expected to be performed much easier in<br />
the 2flp -scheme than in a three species minority scenario<br />
(e.g. hydrogen minority in a DT-mixture) owing to the probably<br />
difficult control of the minority concentration within a tight<br />
window of n /n .<br />
H 6<br />
Impurity behaviour<br />
The ICRF related reduction of particle <strong>and</strong> impurity transport<br />
with respect to NI (see Fig. 3) leads to an enhanced impurity<br />
level which is dominated by iron released from the torus walls<br />
/4/. The power radiation of about 35 %, mainly originating from<br />
the plasma centre (Fig. 5), limits high power ICRF operation to
<strong>IAEA</strong>-CN-47/F-I-2 467<br />
\ . wait carbonization **r<br />
• 0-15<br />
0 10 20 30 40<br />
r(cm)<br />
F/G. 5. Radiation density profiles for different torus wall conditions.<br />
P < 1.5 MW if no wall carbonisation or NI preheating is<br />
provided. Carbonisation of the torus wall allowed an almost<br />
iron free plasma with a radiation level of about 15 % (Fig. 5)<br />
where the residual peaking sometimes observed in the radiation<br />
profile results mainly from an inperfect carbon coating. In<br />
addition, another mechanism of impurity release has been<br />
determined which is related to wave absorption: Conditions of<br />
poor central wave absorption have always been accompanied by a<br />
particular large central radiation as verified at e.g. 2fl in<br />
helium or pure deuterium discharges. The anti-correlation of<br />
central wave absorption <strong>and</strong> central radiation level indicates<br />
that RF power absorbed in the outer region of the plasma,<br />
leading to strongly enhanced CX fluxes at the plasma edge /9/<br />
<strong>and</strong> thereby increasing the metal impurity release, might play a<br />
deleterious role in terms of ICRH induced impurity generation.<br />
Lower Hybrid Experiments<br />
Heating <strong>and</strong> current drive with Lower Hybrid (LH) waves at f =<br />
1.3 GHz have been studied in Ohmic target plasmas <strong>and</strong> in combi-<br />
nation with Nl-heating (P < 3 MW) for various LH wave
468<br />
Te<br />
(keV)<br />
4.0<br />
3.5-<br />
3.0-<br />
2.5-<br />
2.0-<br />
1.5 •<br />
1.0 •<br />
0.5-<br />
# 18424<br />
O:0H<br />
• :LH<br />
STEINMETZ et al.<br />
ne = 06 x 10 13 crrf 3<br />
PLH=375kW(Aip=90°)<br />
-50 -40 -30 -20 -10 0 10 20 30<br />
r(cm)<br />
FIG. 6. Radial electron temperature profiles during Ohmic <strong>and</strong> complete LH current drive (Uj = 0);<br />
lp = 500 kA.<br />
spectra with transmitted power up to P. „ = 1 MW <strong>and</strong> pulse<br />
duration T & 1.5 s. Efficient modification of the current den-<br />
sity profile can be achieved by appropriate shaping of the LH<br />
wave spectrum.<br />
Lower Hybrid Heating<br />
Strong electron heating is obtained when LH waves are absorbed<br />
by suprathermal electrons below the onset of ion interaction<br />
(n < 3 x 10<br />
^ cm on ASDEX). At low density the electron<br />
temperature profile peaks with the central value strongly in-<br />
creasing. In Fig. 6 the T (r) profiles are shown during the<br />
Ohmic phase <strong>and</strong> during complete steady state LH current drive<br />
(U. = 0) at na = 0.6 x 10 13 cm" 3 (P0H = 240 kW, P^gs = 375 kW).<br />
A. 6<br />
With LH current drive much higher temperatures are observed in<br />
the central region inside r = 10 cm (a = 40 cm) with T (0) :<br />
2 •* 3.5 keV. Qualitatively similar results are obtained in the
<strong>IAEA</strong>-CN-47/F-I-2 469<br />
LH heating mode with stationary wave spectra. The zone of<br />
temperature increase in all these cases seems to be restricted<br />
to the region inside the q = 1 surface. The observed strong<br />
central heating is not due to the suppression of sawteeth which<br />
is only attained in the case of LHCD but not in the heating<br />
mode.<br />
Power balance calculations are carried out for the LH heating<br />
<strong>and</strong> current drive modes (LHH, LHCD). The absorption coefficient,<br />
as determined from the rate of change of the plasma energy con-<br />
tent at the beginning of the RF pulse, decreases from about 0.8<br />
at n = 1 x 10 13 cm" 3 to about 0.3 at ng = 2 x 10 cm" 3 . This<br />
could be explained by a decrease of the RF power accessible to<br />
the plasma centre /5/. The absorption coefficient also de-<br />
creases with increasing RF power, thus indicating saturation<br />
effects. The energy confinement with LHH <strong>and</strong> LHCD is improved<br />
at low density above the Ohmic values (n = 0.6 x 10 cm ,<br />
OH I H<br />
I = 300 kA: li! = 25 ms -> tZ, = 50 ms). With increasing RF<br />
P CJ CM<br />
power the energy confinement time decreases. The region of<br />
improved confinement seems to be limited to the parameter range<br />
where the total power input with application of LH is reduced<br />
below the power input in the Ohmic phase.<br />
LHH <strong>and</strong> LHCD have been combined with NI at high power levels:<br />
P. < 1 MW, P..T < 3.H MW. At low density the same L scaling<br />
l_»ri N X<br />
for the confinement is found for NI <strong>and</strong> for the combination<br />
with LH as shown in Fig. 7. LH heating itself is improved by<br />
preheating from NI, mainly due to an additional direct inter-<br />
action of LH waves with the beam ions in the plasma centre.<br />
These are accelerated up to twice the injection energy as<br />
observed in charge exchange measurements /9/.<br />
Lower Hybrid Current Drive<br />
Efficient saving of voltseconds in the primary OH transformer<br />
can be obtained in the mode of combined RF <strong>and</strong> inductive
470 STEINMETZ et al.<br />
100-<br />
wp<br />
(kJ)<br />
50-<br />
o : OH<br />
A : LH<br />
• : Nl<br />
A : NULH<br />
FIG. 7. Plasma energy content WP versus total injected heating power PM for Nl, LHCD <strong>and</strong> the<br />
combination of both (ne = /./ x W' 3 cm~ 3 , Ip = 300 kA).<br />
current drive. The fraction of OH power replaced by LH power<br />
(-/IP /PAU ) <strong>and</strong> tne corresponding conversion rate<br />
LH<br />
(-APnu /Pru) are shown in Fig. 8 as functions of P.„ for dif-<br />
ferent densities. The total plasma current is kept constant in<br />
all these experiments by a feedback regulation of the OH pri-<br />
mary circuit. High efficiencies for replacement of OH power by<br />
LH power can be achieved at low P where the LH generated<br />
LH<br />
suprathermal electrons increase the electrical conductivity <strong>and</strong><br />
thereby improve the OH current drive efficiency /6/. At low<br />
densities a large reduction in OH power can be obtained with a<br />
LH OH<br />
high conversion rate for the LH power: - APnu /P_u = 1 with<br />
UH 0H<br />
nH _ i o _o<br />
-APj, /PTH * 1 for n < 0.5 x 10 J cm .<br />
un Liti e<br />
In combination with Nl the LH current drive efficiency is<br />
reduced, as shown in Fig. 9 where the drop in OH power upon
-AP<br />
<strong>IAEA</strong>-CN-47/F-I-2 471<br />
200 400<br />
—I 1<br />
600 800 1000<br />
FIG. 8. Drop in OH power input —AP^/P^ during LHCD <strong>and</strong> corresponding conversion rate ofLH<br />
power - versus P^; Ip = 300 kA.<br />
LHCD is plotted versus PNT: It decreases with increasing beam<br />
power, probably due to the direct absorption of LH power by the<br />
beam ions which then reduces the power flow to the electrons.<br />
This is also indicated by the strong drop in hard X-ray<br />
intensity <strong>and</strong> suprathermal ECE emission from fast electrons<br />
during the presence of fast beam ions in the plasma.<br />
Current Profile Modification<br />
The current profile j(r) during LHCD is no longer determined by<br />
Spitzer resistivity. The T (r) <strong>and</strong> the j(r) profiles are de-<br />
6<br />
coupled by LHCD in OH target plasmas <strong>and</strong> in NI heated plasmas.<br />
The current profile broadens while the T (r) profile peaks. The<br />
broadening of j(r) as derived from the drop in internal<br />
inductance 1. normally increases with the amount of the RF-<br />
driven current. A different behaviour is found in experiments<br />
LH<br />
"OH
472<br />
" AP OH<br />
(kW)<br />
200-\<br />
100 -<br />
STEINMETZ et al.<br />
PLH=540kW<br />
NI +LHCD<br />
IT, =1.1«10 13 cm" 3<br />
lp =300KA<br />
B, =2.2T<br />
H'—D'<br />
• \^ PLH=720kW<br />
i<br />
2<br />
PNI(MW]<br />
FIG. 9. Drop in OH power input with LHCD in combination with NI as junction of PNI.<br />
where the form of the LH wave spectrum was changed gradually,<br />
by shifting power from high to low phase velocities, with the<br />
total power kept constant. This leads to a gradual decrease of<br />
the total RF-driven current whereas the drop in 1 increases in<br />
the same way /7/. The LH waves with lower phase velocities<br />
therefore seem to be absorbed closer to the plasma periphery.<br />
The local off-axis LH-current drive then leads to the stronger<br />
broadening of j(r). An external control of the local plasma<br />
current distribution by LH-current drive with an appropriate<br />
wave spectrum <strong>and</strong> the related deposition profile seems<br />
therefore possible.<br />
By broadening j(r) such that the central q-value increased<br />
above 1, sawteeth could be stabilised with LH-current drive in<br />
OH- <strong>and</strong> Nl-heated plasmas /8/. With normal current drive
<strong>IAEA</strong>-CN-47/F-I-2 473<br />
FIG. 10. Waveforms of density ft,, total radiated power Prad <strong>and</strong> diamagnetic @p for a sawtoothing NI<br />
heated discharge (dashed lines) <strong>and</strong> for a sawtooth-free discharge with NI <strong>and</strong> LHCD (solid lines);<br />
Ip = 380 kA, B, = 2.2 T, q(a) = 2.75.<br />
spectra for this about half the power of complete LH-current<br />
drive is necessary when LH is applied to OH plasmas. With NI<br />
the LH power required for sawtooth suppression decreases with<br />
increasing beam power. Stabilisation of the sawteeth results in<br />
higher central electron temperatures <strong>and</strong> in slightly improved<br />
global energy confinement as seen from Fig. 10.<br />
SUMMARY<br />
The application of waves in the frequency range of ICRH or LH on<br />
ASDEX has been proved as a useful tool for either heating or<br />
current drive. ICRH efficiently heats the plasma in various<br />
2n u-<strong>and</strong> D(H)-regimes where the H-mode has also been achieved.<br />
In combination with NI, t* is improved above the usual L-type<br />
scaling where at high power a substantial residual energy con-<br />
finement is observed. Strong electron heating is found with LH in<br />
the suprathermal electron regime with confinement better than
474 STEINMETZ et al.<br />
Ohmic at low density. In combination with NI,acceleration of beam<br />
ions is observed. Decoupling of T (r) <strong>and</strong> j(r) by LHCD allows<br />
independent control of current <strong>and</strong> heat deposition profiles.<br />
REFERENCES<br />
[1] STEINMETZ, K., et al., in Controlled Fusion <strong>and</strong> Plasma Heating (Proc. 13th Europ. Conf.<br />
Schliersee, 1986), Vol. 2, European Physical Society (1986) 21.<br />
[2] WAGNER, F., et al., Plasma Phys. Controll. Fusion 28 (1986) 1225.<br />
[3] KEILHACKER, M., et al., Plasma Phys. Controll. Fusion 26 (1984) 49.<br />
[4] JANESCHITZ, G., et al., in Controlled Fusion <strong>and</strong> Plasma Heating (Proc. 13th Europ. Conf.<br />
Schliersee, 1986), Vol. 1, European Physical Society (1986) 407.<br />
[5] SOLDNER, F., et al., in Controlled Fusion <strong>and</strong> Plasma Physics (Proc. 12th Europ. Conf.<br />
Budapest, 1985), Vol. 2, European Physical Society (1985) 244.<br />
[6] LEUTERER, F., et al., Plasma Phys. Controll. Fusion 27 (1985) 1399.<br />
[7] LEUTERER, F., et al., in Controlled Fusion <strong>and</strong> Plasma Heating (Proc. 13th Europ. Conf.<br />
Schliersee, 1986), Vol. 2, European Physical Society (1986) 409.<br />
[8] SOLDNER, F.( et al., Phys. Rev. Lett. 57 (1986) 1137.<br />
[9] RYTER, F., et al., in Controlled Fusion <strong>and</strong> Plasma Heating (Proc. 13th Europ. Conf.<br />
Schliersee, 1986), Vol. 1, European Physical Society (1986) 101.<br />
DISCUSSION<br />
S.-I. ITOH: In your summary you said that the confinement structure was not<br />
dependent on the heating method. On the other h<strong>and</strong>, in the case of the particle confinement<br />
time (obtained by T; line radiation), there is a discrepancy between neutral<br />
injection <strong>and</strong> ICRF heating. What kind of confinement is it that is not dependent on<br />
the heating method?<br />
Secondly, with respect to LH heating you stated that the heating was restricted<br />
inside the q = 1 surface. Did you see any MHD instabilities due to the sudden rise<br />
in Te <strong>and</strong>/or v Te inside the q = 1 surface.<br />
K. STEINMETZ: Non-dependence of the confinement structure on the auxiliary<br />
heating method means the general existence of an L-type <strong>and</strong> H-mode<br />
behaviour with NI as well as with ICRH. With respect to TE or TP, both heating<br />
schemes exhibit the same type of scaling, as shown in Fig. 3 of the paper, although<br />
the confinement for ICRH is slightly improved compared to that for NI. So there is<br />
no discrepancy in terms of the global confinement structure.<br />
No MHD stabilities due to the central electron heating by LH waves were seen.<br />
For application of LH alone, the heating efficiency is similar in the current drive<br />
mode without sawteeth <strong>and</strong> in the heating mode in the presence of sawteeth.
<strong>IAEA</strong>-CN-47/F-I-2 475<br />
H. MATSUMOTO: In your conclusions you said that you have observed an<br />
improvement in confinement during ICRF second harmonic heating <strong>and</strong> during NBI<br />
heating through an increase in the heating power. However, this may simply be due<br />
to an improvement in absorption of the wave at the second harmonic resonance when<br />
the plasma beta was increased. What is your opinion?<br />
My second question is, did you use the constant power absorption coefficient a<br />
when evaluating the RF heating power input to calculate the global confinement time<br />
in Fig. 3? And further, how did you determine a?<br />
K. STEINMETZ: When the plasma beta was increased by neutral beam injection,<br />
the experimentally derived effective ICRH power absorption was found to<br />
increase from aIC = 0.6 to aiC = 0.7. Since the experimental values of a are used<br />
to calculate TJ!, the observed improvement in confinement of ICRH plus NI, with<br />
respect to NI only, cannot be attributed to the measured change of a.<br />
For pure ICRH heating, a = 0.6 is taken, while for the combined ICRH plus<br />
NI scheme, a = 0.7, as shown in Fig. 2 of the paper. The effective power absorption<br />
is derived via the rate of change in the plasma beta, d/3/dt, when the RF is<br />
switched on or off, <strong>and</strong> by modelling the increase in the plasma energy content following<br />
an RF power step (see the paper presented by our group at the 13th European<br />
Conference in 1986).<br />
R.R. WEYNANTS: Does the effectively absorbed power, a, change significantly<br />
when going from one ICRH heating scenario to the other?<br />
K. STEINMETZ: No. The ICRH absorption coefficient aIC = 0.6 is about<br />
equal in the 2QCH <strong>and</strong> the D(H) minority regimes. When ICRH is combined with<br />
neutral beam injection, the effective ICRH absorption increases to aIC = 0.7. I<br />
should note that we have cross-checked our procedures used to determine a by applying<br />
them to purely Nl-heated plasmas <strong>and</strong> found good agreement between the numerically<br />
computed values using a beam deposition code <strong>and</strong> the experimentally derived<br />
values of aNI = 0.9-1.
ION BERNSTEIN WAVE<br />
HEATING EXPERIMENTS ON PLT<br />
M. ONO, P. BEIERSDORFER, R. BELL, S. BERNABEI,<br />
A. CAVALLO, A. CHMYGA 1 , S.A. COHEN, P. COLESTOCK,<br />
G. GAMMEL G. GREENE, J. HOSEA, R. KAITA,<br />
I. LEHRMAN, G. MAZZITELLI 2 , E. MAZZUCATO,<br />
D.H. McNEILL, M. MORI 3 , K. SATO 4 , J. STEVENS,<br />
S. SUCKEWER, J.R. TIMBERLAKE, V. VERSHKOV 1 ,<br />
J.R. WILSON, A. WOUTERS<br />
Princeton Plasma Physics Laboratory,<br />
Princeton University,<br />
Princeton, New Jersey,<br />
United States of America<br />
Abstract<br />
<strong>IAEA</strong>-CN-47/F-I-3<br />
ION BERNSTEIN WAVE HEATING EXPERIMENTS ON PLT.<br />
Ion Bernstein wave heating (IBWH) has been investigated on PLT, with up to 800 kW of<br />
RF power applied to the antenna. A plasma antenna loading of 2-4 J) has been observed, resulting<br />
in 80-90% of the RF power being coupled to the plasma. An ion heating efficiency of<br />
ATi(O) ^/PRP = 6 eV X 10 13 cm" 3 /kW, without high energy tail ions, has been observed, up to the<br />
maximum coupled RF power of 650 kW (P0H = 550 kW). The particle confinement during high<br />
power IBWH increases significantly (as much as 300%). Associated with this increase are a longer<br />
confinement time of the injected impurity, a reduced drift wave turbulence activity, frequency shifts of<br />
drift wave turbulence <strong>and</strong> the development of a large negative edge potential. The energy confinement<br />
time, however, shows some degradation from the Ohmic value, which can be attributed to the enhanced<br />
radiation loss observed during IBWH. The ion heating <strong>and</strong> energy confinement time are relatively<br />
independent of plasma current.<br />
1. INTRODUCTION<br />
Plasma heating by externally launched ion Bernstein waves (IBWH) has been<br />
investigated as an alternative to conventional ICRF heating. Because of their<br />
relatively short wavelength, ion Bernstein waves can heat the bulk ions even at<br />
relatively high harmonic frequencies [1].<br />
' Kharkov Physico-Technical Institute, Ukrainian SSR.<br />
2<br />
Associazione Euratom-ENEA sulla Fusione, Centro Ricerche Energia Frascati,<br />
Frascati, Rome, Italy.<br />
Japan Atomic Energy Research Institute, Tokai-mura, Naka-gun, Ibaraki-ken, Ja<br />
Institute of Plasma Physics, Nagoya University, Nagoya, Japan.<br />
477
478 ONO et al.<br />
To preferentially excite ion Bernstein waves (as opposed to fast waves), a<br />
B-Ez type loop antenna [2] was used to simulate lower-hybrid-like waveguide<br />
fields. The RF current for this antenna flows in the toroidal direction, whereas the<br />
current for the fast wave antenna flows in the poloidal direction. In 1985, experiments<br />
were performed with such a loop antenna, <strong>and</strong> various efficient heating<br />
regimes were identified, including 5UD, H minority, 3 He minority, <strong>and</strong> 3/2 QD<br />
[3, 4]. The RF power in these experiments was 100-150 kW. The observed ion<br />
heating quality factor ATj(O) n POH) where<br />
plasma confinement issues can be tested during IBWH. It was of particular interest<br />
to study the confinement properties for bulk ion heating in comparison with those for<br />
high energy ion heating such as fast wave ICRF heating or neutral beam heating. Two<br />
high power IBWH antennas were installed on PLT. The new high power antennas<br />
are 60 cm long <strong>and</strong> 5 cm wide. The antenna design is very similar to that of the PLT<br />
high power ICRF antenna. The distance from the current strip to the back plate is<br />
5 cm, providing adequate flux linkage to the plasma. The antenna is covered with<br />
Macor cover plates. Between the Macor plates <strong>and</strong> the plasma there are two layers<br />
of stainless steel Faraday shields. The antenna is protected by graphite plates placed<br />
toroidally on both sides of the antenna. Up to 500 kW of RF power can be applied<br />
to one antenna. The plasma loading for these antennas is 2-4 fi, resulting in 80-90%<br />
of the applied RF power being coupled to the plasma. The overall antenna<br />
performance is similar to that of the PLT high power fast wave antenna.<br />
3. IBWH ION HEATING<br />
IBWH at high power levels was performed on PLT in the 3 He <strong>and</strong> 3/2 fiD<br />
regimes utilizing the existing ICRF 30 MHz transmitter. A typical heating result is<br />
shown in Fig. l(a) where the time evolution of the ion temperature is shown for
2.0 - (a)<br />
1.5 -<br />
1.0 -<br />
0.5 "A A<br />
n<br />
r<br />
Prf A<br />
500 T<br />
(kWV<br />
1<br />
J-A<br />
<strong>IAEA</strong>-CN-47/F-I-3 479<br />
I A<br />
1 1 T<br />
•"• ,<br />
I /I<br />
I A<br />
A<br />
T 1 1<br />
0<br />
A<br />
a A I •<br />
A<br />
A<br />
A A<br />
« 1 1<br />
1<br />
Doppler<br />
Cx<br />
Neutron<br />
-<br />
-<br />
A<br />
A<br />
A .<br />
a A -<br />
300 400 500 600 700 800 900<br />
TIME(ms)<br />
0.3 0.4<br />
Prf (MW)<br />
FIG. 1. (a) Typical time evolution of ion temperature. Pgf = 500 kW, F = 30 MHz, Bo = 29 kG,<br />
3/2 QD, ne = 3.0 x 10 13 cm' 3 . Other parameters are given in Fig. 2(a-c).<br />
(b) Ion heating as a function of RF power for 3 He minority (Bo = 32 kG, 10% 3 He) <strong>and</strong> 3/2 QD<br />
(Bo = 29 kG, 0% 3 He) regimes.<br />
3/2 QD heating at 500 kW. Three Tj diagnostic techniques — Doppler broadening<br />
(Ti XXI), charge exchange (CX), <strong>and</strong> neutron emission — are in good general<br />
agreement within the uncertainties of each diagnostic. The charge exchange velocity<br />
distribution is Maxwellian, without any high energy tail ions up to the highest power<br />
level. The ion temperature profile as measured by the Doppler broadening of various<br />
ion lines is similar to the Ohmic profile. The ion heating efficiency as shown in<br />
Fig. l(b) is nearly linear up to 650 kW, with a heating quality factor of<br />
ATifle/PRp = 6-7 eV X 10 13 cm~ 3 /kW. It is interesting to note that 3 He heating<br />
<strong>and</strong> 3/2 QD heating have similar heating efficiencies. The toroidal magnetic field for<br />
1
480<br />
3<br />
'E
<strong>IAEA</strong>-CN-47/F-I-3 481<br />
4. IMPROVED PARTICLE CONFINEMENT DURING IBWH<br />
During IBWH, the particle confinement is significantly improved [5]. A good<br />
example is shown in Fig. 2(a). The plasma density increases by more than a factor<br />
of three, without active gas puffing <strong>and</strong> without increasing particle recycling, as<br />
indicated by a drop in the Ha emission. The largest drop occurs near the antenna,<br />
limiter <strong>and</strong> gas valve regions. As shown in Fig. 2(b), the Ha emission near the<br />
antenna-limiter region (where much of the recycling takes place) during IBWH (solid<br />
curve) is considerably less than in the simulated OH case (dashed curve). The density<br />
profiles during IBWH are similar to those for the simulated Ohmic case, as shown<br />
in Fig. 2(c). The rapid density drop after IBWH as compared with the Ohmic case<br />
demonstrates the reduced particle recycling ratio resulting from the reduced total<br />
particle inventory in the system. It should be emphasized that the density rise during<br />
IBWH is not correlated with the impurity influx as measured by various spectroscopic<br />
instruments — a bremsstrahlung based 'Z'-meter <strong>and</strong> a scanning bolometer. Also, the<br />
large increase in the neutron level (a factor of 500) shows that the incremental density<br />
is due mainly to deuterium.<br />
In connection with this improvement in particle confinement (or reduced<br />
recycling) a number of interesting phenomena were observed. During IBWH, the low<br />
energy neutral flux levels (at energies less than 1 keV) decrease significantly [6].<br />
This drop may be related to the drop in the Ha emission. For a further underst<strong>and</strong>ing<br />
of the particle transport processes during IBWH, a very small amount of selenium<br />
was injected with a laser blow-off impurity injector. As shown in Fig. 3(a), the decay<br />
time of the Se XXV radiation increases by a factor of two from the Ohmic level (from<br />
50 ms to 100 ms). Since during the observation time the central electron density <strong>and</strong><br />
temperature are similar <strong>and</strong> nearly constant for both cases, the selenium line<br />
behaviour gives an indication of the central selenium confinement. A similar<br />
behaviour was observed with a helium gas puff. When a given amount of helium is<br />
injected with a pre-programmed fast gas valve, the net density rise during IBWH is<br />
at least twice that in the case without RF, which again suggests an improvement in<br />
the particle confinement time. The high ionization states of carbon (C V, C VI) do<br />
not rise during IBWH (they may even drop); this represents an exceptional case [6].<br />
Another striking effect of IBWH is the change of the low frequency turbulence<br />
activity in the plasma. A microwave scattering system was used to investigate the<br />
turbulence in the half-radius region between the q = 1 <strong>and</strong> q = 3 surfaces<br />
(r = 25 + 10 cm). Figure 3(b) shows the time evolution of the scattering signals at<br />
100 kHz for the IBWH case <strong>and</strong> the simulated Ohmic case (the scattered wavenumber<br />
is 6-8 cm" 1 ). One can see a significant drop in the turbulence level during<br />
IBWH as compared with the simulated Ohmic case. In the insert, the frequency<br />
spectrum for each case is shown at the end of RF (t = 700 ms). A frequency shift<br />
as well as an amplitude reduction occur during IBWH. Since the plasma density<br />
profiles are very similar in the two cases, the possibility of a change in the scattering<br />
volume can be ruled out. From the frequency shift, one can infer a net increase of
482 ONO et al.<br />
o<br />
XI 400<br />
(C) 1<br />
500<br />
1<br />
-300-200-100 0 100 200 300<br />
f (kH2)<br />
600 700 800<br />
TIME(ms)<br />
1 1<br />
900<br />
_ -100 -<br />
-<br />
2<br />
g-200<br />
^-300<br />
\<br />
V<br />
300<br />
1 i i 1 1 1<br />
i<br />
400 500 600 700 800 900 1000 MOO<br />
TIME(ms)<br />
FIG. 3. (a) Time evolution of the selenium XXV resonance line intensity for the IBWH case <strong>and</strong> the<br />
simulated Ohmic case. The selenium was injected at t = 550 ms.<br />
(b) Time evolution of the integrated low frequency turbulence level at 100 kHz for the two cases;<br />
k(scatt) = 6-8 cm' 1 at r = 25 ± 10 cm.<br />
Insert: Frequency spectrum at t = 700 ms for the two cases.<br />
(c) Time evolution of the plasma edge floating potential.<br />
the poloidal rotational velocity of approximately 5 x 10 4 cm/s in the electron<br />
diamagnetic drift direction. The net result is a near doubling of the electron diamagnetic<br />
drift velocity. This drift velocity corresponds to an electric field of 15 V/cm<br />
in the radially inward direction. It should be noted that this reduction in the drift wave<br />
activity correlates well with the long impurity particle confinement time. Measurements<br />
with an RF-shielded Langmuir probe in the plasma edge have shown that<br />
1<br />
1000<br />
1<br />
MOO<br />
1
<strong>IAEA</strong>-CN-47/F-I-3 483<br />
during IBWH a large floating potential develops which is negative with respect to the<br />
chamber wall (Fig. 3(c)). This is correlated with the appearance of the frequency<br />
shift in the turbulence spectrum.<br />
5. ENERGY CONFINEMENT TIME DURING IBWH<br />
Plasma confinement during IBWH is of interest because of the bulk ion heating<br />
properties of ion Bernstein waves. To investigate the scaling of energy confinement<br />
with plasma current, the current was varied between 200 kA (q^e = 10) <strong>and</strong><br />
630 kA (q^ = 3), with a constant RF power level of 250 kW. Note that the ratio<br />
of the RF power to the Ohmic power increases with decreasing current, reaching 1<br />
for the 200 kA case. For a given RF power, the ion temperature increase remains<br />
constant down to the lowest current of 200 kA. The normalized energy confinement<br />
time, TEI%, also remains constant. This may be due to the characteristic of IBWH<br />
bulk ion heating that fast ion losses are negligible, even for the low current case. For<br />
a given current, Ip = 500 kA, the power scaling shows a gradual degradation of<br />
confinement time with increasing RF power. At 650 kW, the confinement time is<br />
about 40 ms at 4.5 x 10 13 cm" 3 , which is significantly below the Ohmic value of<br />
50-55 ms but is higher than the L-mode scaling time of about 33 ms. This drop in<br />
the global confinement time can be attributed to an increase in the electron loss<br />
channel. However, in view of increased radiation losses during IBWH, the electron<br />
thermal diffusivity still appears to be Ohmic like.<br />
6. IMPURITY INFLUX DURING IBWH<br />
During IBWH, an increase in the influx of metallic impurities (predominantly<br />
iron) was observed. This high-Z impurity influx, together with the longer particle<br />
confinement time, can result in non-negligible central radiation losses during high<br />
power (high density) IBWH. Thus, for a successful high power IBWH experiment<br />
it is important to reduce the iron influx level as much as possible. To find the source<br />
of the iron impurities, the outer Faraday shields of one of the antennas were coated<br />
with a 20 pm thick carbon film. This antenna was compared with an uncoated<br />
antenna. For the same RF power level, the carbon coated antenna produced half as<br />
much iron influx (<strong>and</strong> half as much central bolometric radiation) as the uncoated<br />
antenna. The ion heating efficiency <strong>and</strong> the density rise, however, remained similar<br />
for the two antennas. This indicates that at least half of the iron influx originated from<br />
the Faraday shields. The other half may have come from the vacuum chamber wall<br />
or the uncoated inner Faraday shield. An antenna with both inner <strong>and</strong> outer carbon<br />
coated Faraday shields is being prepared <strong>and</strong> will be used in an investigation of this<br />
point.
484 ONO et al.<br />
7. CONCLUSIONS<br />
Efficient ion heating by IBWH was observed in the 3 He <strong>and</strong> 3/2 flD regimes,<br />
up to the highest power level (PRF = 650 kW). With the application of IBWH,<br />
significant improvement in the particle confinement time was observed. Associated<br />
with this improvement were a longer confinement time of the injected selenium, a<br />
reduced low frequency turbulence level, frequency shifts of drift wave turbulence <strong>and</strong><br />
the development of a large negative edge potential. The global plasma energy<br />
confinement time at the highest power levels showed some degradation from the<br />
Ohmic level, which is attributed to the increases in the electron loss channel that are<br />
due mainly to the radiative losses. The ion heating <strong>and</strong> the energy confinement<br />
remained relatively constant with plasma current. The ion energy distribution<br />
remained Maxwellian for the entire power range.<br />
REFERENCES<br />
[1] ONO, M., WURDEN, G.A., WONG, K.L., Phys. Rev. Lett. 52 (1984) 40.<br />
[2] ONO, M., WATARI, T., et al., Phys. Rev. Lett. 54 (1985) 2339.<br />
[3] WILSON, J.R., et al., in Radiofrequency Plasma Heating (Proc. 6th Top. Conf. Callaway<br />
Gardens, GA, 1985), American Institute of Physics, New York (1985) 8.<br />
[4] ONO, M., et al., ibid., p. 83.<br />
[5] HOSEA, J.C., et al., Plasma Phys. Controll. Fusion 28 (1986) 1241.<br />
[6] WILSON, J.R., et al., J. Nucl. Mater. 145&146 (1986).<br />
DISCUSSION<br />
R. KOCH: Where does the power limitation come from in your experiment?<br />
M. ONO: At present, the power limitation is due to an arc in one of the two<br />
ion Bernstein wave antennas. With an improved antenna <strong>and</strong> with more operational<br />
experience, the power limit can be raised relatively easily.
CONFINEMENT STUDIES ON TEXTOR<br />
WITH HIGH POWER, LONG PULSE ICRH<br />
<strong>IAEA</strong>-CN-47/F-I-4<br />
P.E. VANDENPLAS, T. DELVIGNE, P. DESCAMPS, F. DURODIE,<br />
M. JADOUL, R. KOCH, D. LEBEAU, A.M. MESSIAEN 1 , D.I.C. PEARSON,<br />
R. VAN NIEUWENHOVE, G. VAN OOST, G. VAN WASSENHOVE,<br />
R.R. WEYNANTS 1<br />
Laboratoire de physique des plasmas — Laboratorium voor Plasmafysica,<br />
Association Euratom-Etat beige — Associatie Euratom-Belgische Staat,<br />
Ecole Royale Militaire — Koninklijke Militaire School,<br />
Brussels, Belgium<br />
H.L. BAY, G. BERTSCHINGER, W. BIEGER 2 , P. BOGEN, W. BRUSSAU,<br />
G.A. CAMPBELL 3 , Y. CAO 4 , R.W. CONN 3 , H. CONRADS, K.H. DIPPEL,<br />
H.G. ESSER, K.H. FINKEN, G. FUCHS, B. GIESEN, D.M. GOEBEL 3 ,<br />
E. GRAFFMANN, H. HARTWIG, E. HINTZ, F. HOENEN, K. HOTHKER,<br />
W.L. HSU 5 , A. KALECK, H. KEVER, L. KONEN, M. KORTEN,<br />
W.K. LEUNG 3 , L. LI 4 , Y.T. LIE, A. POSPIESZCZYK, D. REITER,<br />
A. ROGISTER, G. ROSS 6 , D. RUSBULDT, U. SAMM, J. SCHLUTER,<br />
B. SCHWEER, H. SOLTWISCH, G.J. THOMAS 5 , F. WAELBROECK,<br />
G. WAIDMANN, P. WIENHOLD, J. WINTER, G.H. WOLF<br />
Euratom-KFA Association,<br />
Institut fur Plasmaphysik,<br />
Kernforschungsanlage Jiilich GmbH,<br />
Jiilich, Federal Republic of Germany<br />
Abstract<br />
CONFINEMENT STUDIES ON TEXTOR WITH HIGH POWER, LONG PULSE ICRH.<br />
A detailed analysis of the confinement properties of TEXTOR with ICRH is made by means of<br />
(i) power, density, plasma current <strong>and</strong> toroidal magnetic field scans, for which the other plasma<br />
parameters are chosen to be as constant as possible, <strong>and</strong> (ii) RF amplitude modulation at different<br />
frequencies. The results can be interpreted on the assumption that the total energy can be split into two<br />
parts, each following its own confinement law; the residual OH part E0H, obeying the neo-Alcator type<br />
scaling of TEXTOR, <strong>and</strong> the additional heating contribution EAUX, depending on an auxiliary confinement<br />
time rAUX. The observed time evolution of the total energy during the discharges can be well<br />
accounted for by two uncoupled first order differential equations describing, respectively, E0H <strong>and</strong><br />
EAUX- In this way, a complete power or current scan during a single shot can be simulated accurately.<br />
1<br />
Senior research associate at Fonds national.de la recherche scientifique, Brussels, Belgium.<br />
2<br />
Fachhochschule Julich, Jiilich, Fed. Rep. Germany.<br />
3<br />
University of California, Los Angeles, CA, USA.<br />
4<br />
Institute of Plasma Physics, Academia Sinica, Hefei, China.<br />
5<br />
S<strong>and</strong>ia National Laboratories, Livermore, CA, USA.<br />
6 INRS-ENERGIE, Varennes, Quebec, Canada.<br />
485
486 VANDENPLAS et al.<br />
It is found that TAVX increases linearly with Ip, is insensitive to the density <strong>and</strong> decreases slightly with<br />
the RF power. The effectiveness of an increase of OH power at constant density is compared to that<br />
of ICRH.<br />
1. INTRODUCTION<br />
The general characteristics of ICRH <strong>and</strong> of stationary long pulse (~ 1 s), low<br />
impurity ICRH operation have been reported previously [1-3]. This paper reports on<br />
a detailed analysis of TEXTOR confinement by means of scans of the main<br />
parameters of the heated discharge: plasma current, Ip; central chord density, Neo;<br />
RF power radiated by the antenna, PRF; <strong>and</strong> toroidal magnetic field, Bt. The<br />
measurements are made either in steady state plasmas or during the dynamic evolution<br />
of the discharges through comparison with simulation programs. For the present<br />
analysis, TEXTOR was operated with main <strong>and</strong> antenna carbon limiters <strong>and</strong> with a<br />
hot carbonized liner [4]. The heating regime is either the minority (or 2WCD) regime<br />
(CH/CD < 1%) or the mode conversion regime (CH/CD = 5%). While the relative<br />
electron <strong>and</strong> ion energy increases are different for the two heating regimes [3], the<br />
total plasma energy increases are nearly the same for identical main discharge<br />
parameters; the two regimes are, therefore, not distinguished. The operating range<br />
is 1.5 < N^ < 6 X 10 13 cm" 3 , 0.2 < Ip < 0.5 MA, 0 < PRF < 2.2 MW,<br />
B, = 2 T; small radius a = 0.46 m, large radius RQ = 1.75 m.<br />
2. INTERPRETATION 'ANSATZ'<br />
The very different behaviour of the total plasma energy content E with<br />
OH power, P0H = IpVf (Vf is the loop voltage), <strong>and</strong> with auxiliary ICRH power has<br />
suggested to us [2] to split E according to the 'ansatz'<br />
E = EQH + EAUX<br />
where EQH is that part of the energy that is due to the remaining OH power,<br />
POH = Vf'Ip, <strong>and</strong> EAUX is the part due to Pup. V,' is the reduced loop voltage in the<br />
presence of ICRH. We further assume that EAUX = TAUXPRF <strong>and</strong> E0H = TOHP6H<br />
where TOH = FciiN^ is the neo-Alcator OH confinement law of TEXTOR. The<br />
auxiliary confinement time rAUX is determined for steady state conditions from<br />
rAux = (E - V;IPTOH)/PRF (2)<br />
<strong>and</strong> will be shown to be well approximated by Eq. (5).<br />
(1)
y:<br />
<strong>IAEA</strong>-CN-47/F-I-4 487<br />
When the plasma parameters are time dependent, EQH <strong>and</strong> EAUX are described<br />
dEoH/dt = PQH — EOH/^OH; dEAUX/dt = PRF - EAUX/TAUX (3)<br />
These two equations are only coupled through V,, which depends on PRP. The<br />
single law dE/dt = Ptot — E/TE, where Ptot = P0H + PRF an d rE is the global<br />
confinement time, cannot describe all aspects of the observed energy evolution.<br />
When PRF is amplitude modulated, the set of Eqs (3) allows not only the value of<br />
TAUX to be checked, but, if the total radiated power PRF is well coupled to the<br />
plasma, is also relevant in the following manner: (i) at a sharp switchoff of PRF, we<br />
have A(dE/dt) = A(PRF + POH); (») immediately after the switchoff, the energy<br />
decay is essentially governed by dEAUX/dt = -EAUX/TAUX; (iii) with sine modulation<br />
of PRF = PRPQ + PRF exp (-iwt), we have<br />
EAUx = PRF^AUX (1 + C^AUX)-* exp (i0), with = arctan (a>rAUX) (4)<br />
<strong>and</strong> a similar expression for EOH, which is negligible for the cases considered. Then<br />
the phase difference between E = EAUX <strong>and</strong> P^ is a measure of TAUX <strong>and</strong>, if we use<br />
the value of TAUX, the amplitude of E determines IPRFI. If the value of I PRP I<br />
obtained in this way agrees with that actually radiated by the antenna, it is confirmed<br />
that the radiated power is well coupled to the bulk of the plasma <strong>and</strong> represents the<br />
PRF value to be used in Eqs (2) <strong>and</strong> (3). Another evidence for the coupling of PRP<br />
to the plasma bulk results from the fact that the thermal load remains, with ICRH,<br />
at least proportional to Ptot [2].<br />
Let us, finally, note that, when Ip <strong>and</strong> Neo are held constant, the incremental<br />
confinement time Tinc is linked to TAUX by<br />
Tinc = dE/dPtot = (TQH dPon/dP^ + rAUX) (dPtot/dPRF)"'<br />
3. STEADY STATE ANALYSIS<br />
The energy content is measured by four different methods: (i) diamagnetism,<br />
(ii) /3p computation from an equilibrium code using as input the current in the<br />
vertical field coils <strong>and</strong> the plasma current profile obtained from polarimetry, (iii) the<br />
cosine coil method [5], (iv) kinetic evaluation using the data from the HCN<br />
interferometer-polarimeter, from ECE <strong>and</strong> the neutron yield for Tio, identical T;<br />
<strong>and</strong> Te profiles being assumed. The four methods agree well to within ±7 kJ.<br />
TAUX is computed from Eq. (2) by using for TOH the neo-Alcator law defined in<br />
Eq. (1) with a = 0.8 <strong>and</strong> the value of F0H, which fits the observed TOH value just<br />
before the RF pulse (depending on the particular shot, 10 < F0H < 14). Note that<br />
lower values of a (e.g. a = 0.5) with the appropriate adjustment of FOH would also<br />
give a reasonable fit of the OH behaviour.
488 VANDENPLAS et al.<br />
(i) Power scan<br />
To decouple the effect of the density increase from the effect of the total<br />
power increase, a careful selection of shots is made with the same value of Ne0<br />
during ICRH. As was already stated in Refs [2, 3], the results agree well with<br />
a constant value of rAUX, <strong>and</strong> the global confinement time obeys the relation<br />
TE = (1 - PRF/Ptot) TOH + (PRF/PIOI) TAUX, resulting from Eq. (1). For some sets<br />
of data, there is, however, a modest decrease of rAUX with power (
100-<br />
80-<br />
60-<br />
40-<br />
20-<br />
0-<br />
(ms)<br />
•<br />
<strong>IAEA</strong>-CN-47/F-I-4 489<br />
> I . i i<br />
OH<br />
ICRH<br />
| * TAUX | ^. *<br />
^21881 -23120<br />
• • + # , , ^<br />
1 1 1 1 r<br />
+<br />
Neo (10 13 cm- 3 )<br />
Ptof-<br />
^+ 0.35MW<br />
x 0.6MW<br />
. •« 0.8MW<br />
1 1<br />
FIG. 1. (a) Density scan results for different values ofP,0, = P'0H + Pgf <strong>and</strong> constant plasma<br />
current, Ip = 350 kA. Curve labelled OH corresponds to pure Ohmic heating case; curve TAUX<br />
is computed from Eq. (2).<br />
l AUX<br />
30-<br />
20-<br />
10-<br />
(ms) (s/10 13 cm' 3 )<br />
^21881-23120<br />
Ip(MA)<br />
FIG. 1. (b) Evolution ofTAVX <strong>and</strong> TOH/Ne0 versus Ip.<br />
0.6<br />
3p Neo<br />
0.04<br />
0.03<br />
-0.02<br />
•001
490 VANDENPLAS et al.<br />
E<br />
(kJ)<br />
60 •<br />
20 •<br />
n<br />
0 1 Time (s) 2<br />
\ E<br />
FIG. 2. (a) Complete dynamic current scan made in one shot (No. 23 114). Edia is the diamagnetic<br />
<strong>and</strong> E the corresponding simulated energy (FOH = 11; FAUX = 53; P^ = 1.57 MW). The<br />
part corresponding to EAUX is also displayed.<br />
FIG. 2. (b) Corresponding time evolution of Ip, Ne0 (HCN), Te0 (ECE) <strong>and</strong> Ti0 (neutrons).<br />
Curve Ti0A is computed equipartition value from N^, Te0, Ip <strong>and</strong> B, measurements.<br />
We take r0H = FonNeoq"- 8 <strong>and</strong> rAUX = FAUXIp, where the exact value of<br />
F0H is adjusted around 12 <strong>and</strong> that of FAUX around 60 (ms, 10 13 cm" 3 , MA) to provide<br />
the best fit with the experimental evolution described by the diamagnetic signal.<br />
A careful measurement of the time response of the raw diamagnetic energy signal<br />
Edia,r (see Appendix) gives a time constant of Tdia = 12 ms, which is used to obtain<br />
E dia = Edia>r + TdiadEdilM/dt as corrected experimental energy signal.
<strong>IAEA</strong>-CN-47/F-I-4 491<br />
TIME{s)<br />
FIG. 3. (a) Dynamic power scan in one shot (No. 24 257). Edu, is compared to simulated E<br />
(F0H = 12.3; FA(JX = 58.5; Ip = 480 kA); Pgp is also shown. Decay of Ip starts at end of<br />
RF heating.<br />
1 TIME (s)<br />
FIG. 3. (b) Edia compared to simulated E (F0H = 12.8; FAVX = 58; Ip = 280 kA) for<br />
amplitude modulated RF pulse. Pgf is also shown. Inset shows enlargement of Eiia decay as<br />
compared to E after abrupt ending of RF pulse (No. 24 467).<br />
Figure 2(a) shows a comparison of the simulation with a complete current scan<br />
in one shot; EAUX is also displayed. The time evolution of Ip, Neo, the central<br />
electron temperature T^ <strong>and</strong> the ion temperature Ti0 is shown in Fig. 2(b). The<br />
value of Ti0A as computed from equipartition with the electrons agrees well with the<br />
experimental value of Ti0 (obtained from the neutron yield) during the OH parts of<br />
the shot. The simulated E <strong>and</strong> the observed Edia are compared in Fig. 3 for shots
492 VANDENPLAS et al.<br />
with an amplitude modulated ICRH pulse. Figure 3(a) displays a complete power<br />
scan, <strong>and</strong> Fig. 3(b) the results of sinusoidal amplitude modulation. The insert of<br />
Fig. 3(b) shows the good fit during the energy decay after the sharp switchoff of the<br />
RF pulse. Also, the phase shift between Edia <strong>and</strong> PRF is in agreement with the<br />
simulated phase shift.<br />
5. CONCLUSIONS<br />
From our investigations, we conclude:<br />
(1) The chosen 'ansatz' in which the effects of PRF <strong>and</strong> POH are decoupled, can<br />
accurately describe the evolution of E during the shot in a large variety of situations.<br />
(2) The validity of the parametric dependence taken for TAUX OC Ip <strong>and</strong><br />
T0H « Neoqa" for TEXTOR is confirmed.<br />
(3) The value of 7AUX is very different from that of rE = E/Ptot, showing that<br />
the supplied auxiliary energy has its own behaviour.<br />
(4) It is verified that essentially all radiated PRF power is coupled to the<br />
plasma bulk when optimum values of B, <strong>and</strong> the H/D ratio are chosen.<br />
The different nature of the confinement properties of OH <strong>and</strong> of RF additional<br />
heating is again very apparent in the comparison of the incremental heating efficiencies<br />
77 = AE/APtot for OH <strong>and</strong> ICRH. Figure 4 displays, at constant Ne0, the OH<br />
energy evolution versus P0H as Ip is increased, together with the different evolution<br />
of the energy curve at the onset of ICRH, starting from OH for various values of Ip.<br />
E<br />
Ikj)<br />
30-<br />
20-<br />
10-<br />
340^-^* ^80 k A<br />
—- RF<br />
0.2 0.6 0.8 P... IMWl<br />
FIG. 4. Evolution, at constant density N^ = 2.35 x 10 13 cm 3 , of E0H versus P0H when<br />
plasma current is increased from 215 to 280, 340, 480 kA successively (plain line arrows). Dotted<br />
arrows also indicate, for each value of plasma current, how total energy E evolves from E0H at<br />
onset of ICRH.
<strong>IAEA</strong>-CN-47/F-I-4 493<br />
While for the Ne0 value considered r]0U > T;ICRH at low Ip (200 kA), <strong>and</strong><br />
Von = I?ICRH (Ip = 350 kA), we have 7?ICRH > Von at high Ip (~500_kA).<br />
Apparently, the heating efficiency of ICRH exceeds that of OH when Ip/Ne0 is<br />
sufficiently large.<br />
Appendix<br />
MEASUREMENT OF THE TIME RESPONSE<br />
OF THE DIAMAGNETIC SIGNAL<br />
The time constant of TEXTOR's diamagnetic signal [6] has been determined by<br />
varying the frequency Q of the amplitude modulation of the ICRH pulses (Fig. 3(b))<br />
<strong>and</strong> measuring the amplitude ratio <strong>and</strong> the phase difference between Edia r <strong>and</strong> PRF.<br />
From these measurements, using a least squares fit procedure, it follows that<br />
Edia.r/PRF
EXPERIMENTS ON ICRF HEATING<br />
AND FAST WAVE CURRENT DRIVE<br />
IN JIPP T-IIU<br />
<strong>IAEA</strong>-CN-47/F-I-5<br />
T. WATARI, K. OHKUBO, R. AKIYAMA, R. ANDO,<br />
D. ECKHARTT 1 , Y. HAMADA, S. HIROKURA, K. IDA,<br />
E. KAKO, O. KANEKO, K. KAWAHATA, Y. KAWASUMI,<br />
S. KITAGAWA, T. KURODA, K. MASAI, K. MATSUOKA,<br />
A. MOHRI, S. MORITA, M. MUGISHIMA, N. NODA, I. OGAWA,<br />
Y. OGAWA, Y. OKA, M. SAKAMOTO, K. SAKURAI, M. SASAO,<br />
K. SATO, K.N. SATO, S. TANAHASHI, Y. TANIGUCHI,<br />
T. TETSUKA, K. TOI, K. YAMAZAKI<br />
Institute of Plasma Physics,<br />
Nagoya University, Nagoya,<br />
Japan<br />
Abstract<br />
EXPERIMENTS ON ICRF HEATING AND FAST WAVE CURRENT DRIVE IN JIPP T-IIU.<br />
The paper summarizes two years' progress on ICRF heating <strong>and</strong> current drive experiments in<br />
JIPP T-IIU. In the heating experiments, a new ion Bernstein wave heating regime called Mode II was<br />
examined; efficient electron heating was observed. In high power ICRF heating experiments, a five element<br />
antenna array was used, improving the quality of the heating. High power ICRF heating<br />
(2 MW-m" 1 ) was successfully utilized by suppressing high Z impurity contamination, using a carbonization<br />
technique. The energy confinement time scaling has been established, with moderate degradation<br />
compared to that of neutral beam injection. Current drive was demonstrated by injection of the<br />
fast waves in the lower hybrid frequency range. A four element dipole antenna array was used, <strong>and</strong> a<br />
current drive efficiency as high as that of slow wave current drive was achieved. The fast wave was<br />
applied to achieve stabilization of them = 2/n = 1 tearing mode, causing suppression of major disruptions<br />
in various conditions. In another effort undertaken to find a density limit free current drive method,<br />
electron beam injection was also examined.<br />
1. ION BERNSTEIN WAVE HEATING (MODE II)<br />
At the previous <strong>IAEA</strong> Conference (1984), a success in ion Bernstein wave heating<br />
was reported (Mode I) when a layer with w = 3COCD (or u> = (3/2)ooCH) was<br />
established at the central plasma vertical chord [1]. Unexpectedly, a half integer<br />
cyclotron harmonic heating process was found to exist. A new regime called Mode<br />
II is dealt with in this paper where the oi - wCH layer is aligned on the central<br />
On leave from Max-Planck-Institut fur Plasmaphysik, Garching, Fed. Rep. Germany.<br />
495
496 WATARI et al.<br />
0 . 5 -<br />
- 2 0 - 1 0 0 10 20<br />
Minor R a d i u s (cm)<br />
FIG. 1. Electron temperature profile changes for varying phasing angle.<br />
chord. The outst<strong>and</strong>ing feature observed here is a rapid rise in the electron temperature<br />
just after the RF power has been turned on, followed by a gradual rise in the<br />
ion temperature [2]. This constitutes a pronounced difference with respect to the<br />
Mode I experiment. Through a power balance analysis of the experimental data, the<br />
conclusion is reached that the input RF power is mostly absorbed by electrons.<br />
2. CONFINEMENT STUDY IN HIGH POWER ICRF HEATED PLASMAS<br />
A five element antenna array was installed for krtailoring on which the quality<br />
of heating may depend. One expectation was the reduction of impurity content at<br />
Ap = 180°, associated with the co-axial mode. In the experiment, however, changes<br />
are observed neither in the line radiation from impurity ions nor in the spatially<br />
resolved bolometer signals. However, the heating efficiency clearly depends on the<br />
phasing angle. The central electron temperature shows maximum rise <strong>and</strong> a peaked<br />
profile for A
2.0<br />
<strong>IAEA</strong>-CN-47/F-I-5 497<br />
0.0<br />
0.0 0.5 1.0 1.5<br />
PRF (MH)<br />
F/G. 2. Radiation loss versus injected RF power (open circles: before carbon coating; solid circles:<br />
after carbon coating).<br />
(2 MW max.), i.e. with high power density (2 MW-cm 3 ) which has not been<br />
attained elsewhere. A carbonization technique [5] was then employed <strong>and</strong> found to<br />
be very effective in impurity suppression (Fig. 2). Fe lines, which have been the<br />
main radiation loss channel in the hot core region, were reduced in intensity by an<br />
order of magnitude.<br />
The key question is whether or not ICRF heated plasmas show degradation of<br />
confinement as do NBI heated plasmas. The parametric dependences of TE are<br />
studied by varying Ip from 200 kA to 320 kA <strong>and</strong> PRF up to 2 MW with ne fixed<br />
around 7 X 10 13 cm" 3 (Fig. 3(a)). There is a degradation of confinement with<br />
increasing power <strong>and</strong> a marked improvement with increasing IP. A power law fit to<br />
the data yields a scaling TE OC Ip P~f with a ~ 1 <strong>and</strong> 13 « 0.42. This is generally<br />
in good agreement with Kaye-Goldston scaling [6]; the encouraging feature of this<br />
result is its indication of milder degradation than that due to Kaye-Goldston scaling.<br />
An offset linear plot [7] is likewise suitable to the same data set (Fig. 3(b)). The<br />
offset linear TE is determined to be 8 ms. While xE, from this definition, predicts a<br />
milder degradation with increasing power, there is the problem that it may not be<br />
improved by increasing Ip. With TE values provided by various machines of different<br />
size, the JIPP T-IIU data contribute to the determination of the rE scaling to the<br />
plasma volume. The offset TE seems to have aV* dependence on the machine size<br />
as Kaye-Goldston scaling has with constant q.<br />
Based on precise measurements of Te(r), n,,(r) <strong>and</strong> sawtooth activity, the power<br />
deposition profile P(r) <strong>and</strong> the electron heat diffusivity Xe(r) have been studied. The<br />
deposition profile is important because not only may it deeply affect the confinement<br />
2.0
498<br />
WATARI et al.<br />
P0H+PRF(MW)<br />
2.0 2.5<br />
FIG. 3. Confinement time TE of ICRF heated plasma: (a) power law fit <strong>and</strong> (b) offset linear fit;<br />
I » 280 kA<strong>and</strong> ne ~ 7 x 1O U cm' 3 .<br />
properties but also provides an interesting interface between experiment <strong>and</strong> wave<br />
physics. It is found to be a peaked deposition profile for medium density plasmas<br />
(S5x 10 13 cm" 3 ) <strong>and</strong> a broader profile in the higher density cases<br />
(~(7-8) x 10 13 cm" 3 ). The results agree qualitatively with the analysis from the<br />
RF power deposition code [3].<br />
3. FAST WAVE CURRENT DRIVE EXPERIMENTS<br />
Attention has been focused on fast wave current drive [8-10], because of its<br />
attractiveness as a current drive method which may be utilized in high temperature<br />
<strong>and</strong> density plasmas.<br />
The fast wave current drive is studied experimentally by using a four element<br />
dipole antenna with a double Faraday shield. The RF frequency is 800 MHz, <strong>and</strong><br />
BT is 2.6 to 2.96 T. The antenna is designed to produce only Ey <strong>and</strong> Bz fields so<br />
that, preferentially, the fast wave is excited/ Global reflections of the plasma loaded<br />
antenna show a minimum at A
.1 3"<br />
3.<br />
J<br />
5<br />
1<br />
80<br />
40<br />
0<br />
-1<br />
0.6<br />
0<br />
1<br />
0<br />
200<br />
0<br />
80<br />
0<br />
0.8<br />
<strong>IAEA</strong>-CN-47/F-I-5 499<br />
1 1 1<br />
1<br />
/ i<br />
i<br />
i<br />
i<br />
A*<br />
/ ,<br />
_ V<br />
i<br />
i<br />
i<br />
~ i<br />
80-<br />
i<br />
i<br />
1<br />
1<br />
1<br />
|<br />
1<br />
1<br />
1<br />
^—' "•<br />
1<br />
1<br />
1<br />
1<br />
- - -<br />
I<br />
|<br />
1<br />
I<br />
1<br />
{ K<br />
1 1 i<br />
100 200<br />
Time f (ms)<br />
i<br />
I<br />
1<br />
1<br />
I<br />
1<br />
I<br />
I<br />
I<br />
- ^<br />
^<br />
^\ , I<br />
i<br />
i<br />
i<br />
fJ-<br />
i^ -<br />
i _<br />
FIG. 4. Time behaviour of plasma parameters for injection of fast waves: plasma current, lp, loop<br />
voltage, VL, line averaged electron density, ne, microwave emission near the second electron cyclotron<br />
harmonic, [fCe, integrated counts of X-ray (10-300 keV), Nx, peripheral electron temperature deduced<br />
from the ratio of the O V lines, Tep, central electron temperature, Te0 <strong>and</strong> RF net power, PRF.<br />
amplitude is monitored with an electrostatic RF probe in the scrapeoff region, 90°<br />
toroidally from the antenna. The pump RF field, normalized to the injected RF<br />
power, increases by about 15 dB as Ay? is shifted from 180° to 0°. This is ascribed<br />
to the increased portion of excited waves not satisfying the accessibility condition.<br />
When 80 kW of net RF power, PRF, is applied with A
500<br />
WATAR1 et al.<br />
80 120 160 200<br />
Time(ms)<br />
80 120 160 200<br />
Time(ms)<br />
FIG. 5. Discharge characteristics of RF injected plasma in the high density regime where ii>w<br />
(r = 0) > o>.<br />
When fast waves are injected into a high OH current plasma, the hard X-ray<br />
emission in the energy range higher than 30 keV is strongly enhanced in the high density<br />
regime wLH(r = 0) > w (Fig. 5). In this discharge, an enhanced electron cyclotron<br />
emission is also observed, while the bulk electron temperature (Thomson<br />
scattering) remains constant or decreases slightly. The hard X-ray emission is sharply<br />
localized near the plasma centre. These results indicate that fast waves propagate into<br />
the high density plasma <strong>and</strong> interact intensely with the high energy electrons which<br />
exist already in a plasma with high OH current. This result is quite encouraging, in<br />
the sense that the density limit encountered in the low current plasmas can be overcome<br />
if high energy seed electrons are amply provided by slow waves <strong>and</strong>/or electron<br />
cyclotron waves, in place of an inductive electric field.<br />
The RF current drive has a large potential for controlling the current density<br />
profile, which governs tearing mode stability <strong>and</strong> confinement properties. The suppression<br />
of m = 2 tearing mode <strong>and</strong> major disruptions was studied using RF current<br />
drive <strong>and</strong>/or production of high energy electrons by fast waves [11]. Stabilizing<br />
effects are found in the following regime: q(a) = 2.5-3.5, B, = 1.2-2.4 T <strong>and</strong><br />
fie = 0.5-1.5 x 10 13 cm" 3 . The RF power required to suppress the major disruption<br />
is about 20 to 40% of the Ohmic input power, which is close to the theoretical<br />
predictions [12].<br />
4. ELECTRON BEAM INJECTION (EBI)<br />
A current drive experiment with EBI has been performed by using a newly<br />
developed injector working for a long duration (>4 ms). Here, the 'plasma anode<br />
method' was used to generate the electron beam. The parameters of the target plasma
<strong>IAEA</strong>-CN-47/F-I-5 501<br />
were B, = 2 T, ne = 1.5 x 10 l3 cm" 3 <strong>and</strong> Ip = 80 kA. When an electron beam of<br />
current I,. = 240 A at an energy 1.1 keV is injected, Ip rises quickly by 4 kA [13].<br />
The driven current remains constant for 4 ms, <strong>and</strong> the multiplication factor, AIp/Ik,<br />
is about 20.<br />
ACKNOWLEDGEMENTS<br />
The authors thank Dr. Y. Sakamoto <strong>and</strong> all collaborators who contributed to the<br />
success of the carbon coating experiment.<br />
REFERENCES<br />
[1] ONO, M., et al., Phys. Rev. Lett. 54 (1985) 2239.<br />
[2] KAWAHATA, K., et al., in Controlled Fusion <strong>and</strong> Plasma Heating (Proc. 13th Europ. Conf.<br />
Schliersee, 1986), Vol. 10c, Part II, European Physical Society (1986) 169.<br />
[3] FUKUYAMA, A., et al., Nucl. Fusion 23 (1983) 1005.<br />
[4] TOI, K., et al., in Plasma Physics <strong>and</strong> Controlled <strong>Nuclear</strong> Fusion Research (Proc. 10th Int. Conf.<br />
London, 1984), Vol. 1, <strong>IAEA</strong>, Vienna (1985) 532.<br />
[5] NODA, N., et al., Jpn. J. Appl. Phys. 25 (1986) L397.<br />
[6] KAYE, S.M., GOLDSTON, R.J., Nucl. Fusion 25 (1985) 65.<br />
[7] ODAJIMA, K., et al., to be published in Phys. Rev. Lett.<br />
[8] GOREE, G., et al., Phys. Rev. Lett. 55 (1986) 1669.<br />
[9] McWILLIAMS, R., et al., Phys. Rev. Lett. 56 (1986) 835.<br />
[10] OHKUBO, K., et al., Phys. Rev. Lett. 56 (1986) 2040.<br />
[11] TOI, K., et al., in Controlled Fusion <strong>and</strong> Plasma Heating (Proc.13th Europ. Conf. Schliersee,<br />
1986), Vol. 10c, Part II, European Physical Society (1986) 457.<br />
[12] RUTHERFORD, P.H., Rep. PPPL-2277, Plasma Physics Lab., Princeton Univ., NJ (1985).<br />
[13] MOHRI, A., et al., in High-Power Particle Beams (Proc. 6th Int. Conf. Kobe, 1986) P-A-l.<br />
DISCUSSION<br />
J.-M. NOTERDAEME: Was there any indication in the phasing experiments<br />
that radiation losses depend on phasing as the carbonization wears off, or in an uncarbonized<br />
machine?<br />
T. WATARI: We carried out our phasing experiment under three sets of conditions,<br />
namely before carbon coating, after carbon coating <strong>and</strong> after removal of the<br />
coating. In all three cases, the impurity contents were insensitive to the phasing<br />
angle.
ELECTRON HEATING AND MHD MODES<br />
DURING LOWER HYBRID CURRENT DRIVE<br />
ONPLT<br />
S. BERNABEI, R. BELL, A. CAVALLO, T.K. CHU,<br />
P. COLESTOCK, J. FELT, W. HOOKE, J. HOSEA,<br />
<strong>IAEA</strong>-CN-47/F-IM<br />
F.C. JOBES, E. MAZZUCATO, E. MESERVEY, R. MOTLEY,<br />
J.A. MURPHY, M. ONO, R. PINSKER, J. STEVENS,<br />
S. VON GOELER, J.R. WILSON<br />
Princeton Plasma Physics Laboratory,<br />
Princeton University,<br />
Princeton, New Jersey,<br />
United States of America<br />
Abstract<br />
ELECTRON HEATING AND MHD MODES DURING LOWER HYBRID CURRENT DRIVE<br />
ON PLT.<br />
Lower hybrid waves of up to 1 MW power from a 2.45 GHz source were applied to ohmic discharges<br />
in the PLT tokamak. Highly efficient current drive (Ifl]3 R/P « 1.4) was obtained from long,<br />
multi-element grills (8 <strong>and</strong> 16 element) producing a narrow, high velocity wave spectrum. Above a certain<br />
power level, dependent on the plasma density, the lower hybrid waves suppress sawtooth oscillations.<br />
Further increase in power level to about 500 kW (the original ohmic power level) <strong>and</strong> beyond<br />
suppresses the m = 1 oscillation at fie » 10 13 cm" 3 <strong>and</strong> results in strong electron heating in the core<br />
region (Te increases from 2 to 4-6 keV). The m = 2 oscillation does not manifest itself unless the<br />
limiter q is reduced to below 2.5. Enhanced sawtooth amplitude driven by up to 1 MW of ICRF heating<br />
(D- 3 He minority) can also be suppressed by the lower hybrid waves. Preliminary experiments to drive<br />
current with fast waves by a phased loop array are described. These experiments, however, did not<br />
exhibit efficient current drive effects.<br />
1. INTRODUCTION<br />
The application of lower hybrid waves to tokamak<br />
discharges in the past few years has led to a variety of new,<br />
incompletely understood phenomena, including current drive,<br />
sawteeth suppression, <strong>and</strong> strong electron heating [1-5].<br />
These effects are the result of the formation of a<br />
suprathermal electron tail by the RF waves which creates a new<br />
tokamak equilibrium in which the current distribution <strong>and</strong> the<br />
electron temperature distribution are uncoupled. The PLT<br />
experiment has been devoted to the study of this new<br />
equilibrium, which is still largely uncharted because of the<br />
large number of free parameters, such as the direction <strong>and</strong><br />
503
504<br />
'E<br />
1.5<br />
0.5<br />
BERNABEI et al.<br />
0.5 1.0<br />
nc(x|0 l3 cm" 3 )<br />
2.45 GHz<br />
I6-Waveguide Grill<br />
FIG. 1. Current drive figure of merit, In^R/P, versus electron density, for 800 MHz, 6-element,<br />
wide <strong>and</strong> narrow grills, <strong>and</strong> 2.45 GHz, 8-element <strong>and</strong> 16-element grills.<br />
phase of the lower hybrid waves, the intensity of the induced<br />
electric field in the plasma <strong>and</strong> the conditions of the target<br />
plasma.<br />
2. THE EXPERIMENT<br />
The PLT Tokamak, with major <strong>and</strong> minor radii of R = 132 cm<br />
<strong>and</strong> a = 40 cm, has been operated with a toroidal field B = 20-<br />
32 kG, a plasma current I of 300-700 kA (2 < qL < 6) in the<br />
density range fie = 0.2-4 x 10 cm . The RF system consists<br />
of three 2.45 GHz klystrons capable of delivering 1 MW of<br />
power to the plasma. The waves are coupled to the plasma by<br />
means of two grills, one an 8-waveguide array positioned on<br />
the top <strong>and</strong> the other a 16-element array on the outside of the<br />
torus. The principal diagnostics include multi-point laser<br />
Thomson scattering for T , soft <strong>and</strong> hard X-rays, 2JL,<br />
radiation, <strong>and</strong> Mirnov loops.<br />
3. RESULTS<br />
CURRENT DRIVE. Comparison of results with the present<br />
2.45 GHz system with those of the past 800 MHz, 6-waveguide<br />
grill [6] enable us to check the scaling of the density limit<br />
<strong>and</strong> the effect of the wave spectrum. On the first point, the<br />
density limit at 2.45 GHz is ~ 4 :> 10 13 cm" 3 , at least 6 times<br />
greater than at 800 MHz. As shown in Fig. 1, the current<br />
drive figure of merit In., jR/P is greatest for the higher<br />
frequency system launching the fastest waves with the<br />
1.5
0.4<br />
;o.3<br />
UJ<br />
80.1<br />
/<br />
1<br />
,m =0 at r = 1 cm<br />
^/ (Sawtooth)<br />
506<br />
BERNABEI et al.<br />
-40 0 20<br />
RADIUS (cm)<br />
FIG. 3. Temperature profiles during ohmic discharges (lower curve) <strong>and</strong> lower hybrid discharges<br />
measured by laser Thomson scattering. B = 30 kG, I = 500 kA <strong>and</strong> ne = 10 13 cnf 3 . (The Te profiles<br />
are measured along a fixed vertical chord which cannot follow any outward shift of the axis.)<br />
-<br />
.'i<br />
1 1<br />
I 1 1<br />
i '<br />
1 1 1 1<br />
200 400 600 800 1000<br />
FIG. 4. Laser Thomson scattering measurements of TJO) with RF power input. ne ~ 1& 3 cm' 3 ,<br />
B = 30 kG, I ~ 500 kA.<br />
- 1 •} —3<br />
The electron energy confinement time at ng = 10 cm<br />
rises initially with RF power <strong>and</strong> then slowly decreases to the<br />
ohmic level at an RF power level comparable to the ohmic<br />
power. The electron energy confinement time, which is<br />
proportional to ne for ohmic discharges for ne < 3 x 10<br />
cm" , increases with rie at a rate of ~ 1/3 of that of the<br />
ohmic discharge during lower hybrid current drive.<br />
During operation with qL > 2.5, the RF power suppresses<br />
the m=0 <strong>and</strong> m=1 modes without driving up the m=2 mode or<br />
causing a disruption. As qL is reduced below 2.5, the m=2<br />
mode tends to grow in bursts during the RF pulse. Operation<br />
near qL = 2 results in strong m=2 activity <strong>and</strong> disruptions in<br />
both ohmic <strong>and</strong> RF drive.<br />
Ion cyclotron minority heating (D- He) at 1 MW increases<br />
the sawteeth amplitude from 0.20 to 0.5 keV because of the<br />
-
o 2<br />
<strong>IAEA</strong>-CN-47/F-II-l 507<br />
ne (ICTcm" 3 )<br />
Prf=770kW<br />
-60° •<br />
-75° »<br />
FIG. 5. Electron temperature measured with soft X-rays before <strong>and</strong> during lower hybrid heating<br />
at 770 kW.<br />
central power deposition <strong>and</strong> electron- He coupling [7]. The<br />
application of lower hybrid wave power suppresses these<br />
enhanced sawteeth; the minimum lower hybrid power for<br />
suppression is almost independent of ICRF power (up to 1 MW).<br />
FAST WAVE. A 6-element loop array has been installed on<br />
PLT to launch the fast wave at 800 MHz, to determine whether<br />
current drive is possible beyond the normal density limit.<br />
Measureable currents have been driven with up to 80 kW of<br />
power, but this power level is too low to establish the<br />
density scaling of the current drive. The dependence of the<br />
loading of the antenna on density <strong>and</strong> the appearance of<br />
parametric decay spectra at ne > 1 x 10 13 cm" 3 are similar to<br />
those seen previously with the slow wave coupler, so that the<br />
excitation of the fast wave is in doubt. A 3 x 4 dielectric<br />
waveguide is now being installed on PLT to enable direct<br />
comparison of the slow <strong>and</strong> fast wave characteristics with a<br />
better defined launching configuration.<br />
REFERENCES<br />
[1] GORMEZANO, C, BLANC, P., BOTTOLLIER, P., et al., "Experimental studies of lower<br />
hybrid heating <strong>and</strong> current drive on the Petula-B tokamak", Radiofrequency Plasma Heating<br />
(Proc. 6th Top. Conf. Callaway Gardens, GA, 1985), American Institute of Physics, New York<br />
(1985) 111.<br />
[2] CHU, T.K., BELL, R., BERNABEI, S., et al., ibid., p. 131.
508 BERNABEI et al.<br />
[3] CHU, T.K., BELL, R., BERNABEI, S., et al., Nucl. Fusion 26 (1986) 666.<br />
[4] SOLDNER, F., McCORMICK, K., ECKHARTT, D., et al., Phys. Rev. Lett. 57 (1986) 1137.<br />
[5] HOSEA, J., WILSON, J.R., HOOKE, W., et al., "RF experiments on PLT", Controlled Fusion<br />
<strong>and</strong> Plasma Heating (Proc. 13th Europ. Conf. Schliersee, 1986), European Physical Society<br />
(1986).<br />
[6] BERNABEI, S., DAUGHNEY, C, EFTHIMION, E., et al., Phys. Rev. Lett. 49 (1982) 1255.<br />
[7] MAZZUCATO, E., BELL, R., BITTER, M., et al., in Plasma Physics <strong>and</strong> Controlled <strong>Nuclear</strong><br />
Fusion Research 1984 (Proc. 10th Int. Conf. London, 1984), Vol. 1, <strong>IAEA</strong>, Vienna (1985) 433.
RADIOFREQUENCY HEATING AND<br />
CURRENT DRIVE EXPERIMENTS<br />
ON ALCATOR C AND VERSATOR II<br />
M. PORKOLAB, P. BONOLI, Kuoin CHEN, C. FIORE,<br />
R. GRANETZ, D. GRIFFIN, D. GWINN, S. KNOWLTON,<br />
B. LIPSCHULTZ, S.C. LUCKHARDT, E. MARMAR,<br />
M. MAYBERRY 1 , F.S. McDERMOTT, J. MOODY,<br />
R. PARKER, J. RICE, Y. TAKASE, J. TERRY,<br />
S. TEXTER 2 , S. WOLFE<br />
Plasma Fusion Center,<br />
Massachusetts Institute of Technology,<br />
Cambridge, Massachusetts,<br />
United States of America<br />
Abstract<br />
<strong>IAEA</strong>-CN-47/F-II-2<br />
RADIOFREQUENCY HEATING AND CURRENT DRIVE EXPERIMENTS ON ALCATOR C<br />
AND VERSATOR II.<br />
Lower hybrid heating <strong>and</strong> current drive experiments on the Alcator C tokamak (R = 0.64 m,<br />
a = 0.165 m, molybdenum Iimiters) were performed at a frequency of 4.6 GHz, with net injected RF<br />
powers up to Prf < 1.5 MW. Recent experiments have focused on energy confinement studies in lower<br />
hybrid current driven (LHCD) <strong>and</strong> LHRF heated Ohmic discharges, <strong>and</strong> sawtooth stabilization in combined<br />
LHCD-OH driven discharges at densities ne < 1.4 x 10 20 m~ 3 . Ion Bernstein wave heating<br />
experiments were also carried out in Alcator C, at a frequency of f = 183 MHz <strong>and</strong> at power levels<br />
Prf s 200 kW. Significant heating (AT; s 400 eV) was observed at o/uCH - 1.5, 2.5, <strong>and</strong><br />
o>/«CD = 2.5, at densities ne = 1 x 10 20 m" 3 . In the Versator II tokamak, particle confinement<br />
improvement (by factors of about two) was observed in the presence of 2.45 GHz lower hybrid current<br />
drive.<br />
Energy Confinement in LHCD Plasmas in Alcator C<br />
The energy confinement properties of lower hybrid current driven<br />
(LHCD) plasmas, heated <strong>and</strong> maintained entirely by rf-driven currents<br />
have been investigated in the parameter range ne = 0.1 — 0.8 x 10 20<br />
m- 3 ,/p = 100-200 kA, BT =8-11 T, qe = 8-17,Zeff<br />
= 1.5-2.2, hy-<br />
drogen gas [1]. Electron temperature profile measurements were obtained<br />
with a 5—channel ruby Thomson scattering system <strong>and</strong> ion temperatures<br />
by neutral charge-exchange analysis. The energy of the current carrying<br />
1 GA Technologies Inc., La Jolla, CA, USA.<br />
2 TRW Inc., Los Angeles, CA, USA.<br />
509
510 PORKOLAB et al.<br />
superthermal electron population was inferred from plasma hard x-ray<br />
spectral analysis <strong>and</strong> measurements of the equilibrium quantity j3p +^/2.<br />
Confinement measurements from LHCD plasmas were compared with very<br />
similar ohmic discharges. The bulk thermal energy content of LHCD<br />
plasma was nearly identical to that of a similar ohmic plasma, while the<br />
energy content of the superthermal electron tail in LHCD discharges could<br />
account for up to half the total kinetic energy of the plasma at the lower<br />
range of densities. The global confinement time, defined as TE = Wiot/Pim<br />
where Wtot is the total kinetic energy of the bulk <strong>and</strong> the superthermal<br />
particles (LHCD plasmas), <strong>and</strong> Pjn is the net input rf or ohmic power,<br />
is plotted vs. density in Fig. 1. Over this range of densities, the ohmic<br />
power remained constant, <strong>and</strong> the ohmic confinement time rises linearly<br />
with density. The rf power required to maintain the rf driven discharge<br />
increases nearly linearly with density [2]. The quantity r'E = WBuik/Pin,<br />
where WBUUC is the thermal energy of the bulk LHCD plasma, is also plotted.<br />
The difference between T'E <strong>and</strong> TE of the LHCD plasmas indicates<br />
the relative importance of the electron tail in the overall energy balance.<br />
At densities ne
<strong>IAEA</strong>-CN-47/F-II-2 511<br />
Prf (kW)<br />
200 300 600 900<br />
LHCD<br />
1 1<br />
A LHCD<br />
10-"<br />
&<br />
5 -<br />
i<br />
OH TE<br />
i<br />
i<br />
T E<br />
T E A ^<br />
A<br />
A<br />
\>V I :<br />
K-G ^J<br />
ne (10 19 nr 3 )<br />
FIG. 1. TE versus ne for LHCD (solid circles) <strong>and</strong> Ohmic (open triangles) hydrogen plasmas,<br />
for BT = 8 T, Ip = 140 kA. T'E = WBull/Pin (solid triangles) for the LHCD plasmas. Vie dashed<br />
line represents the Kaye-Goldston scaling law.<br />
(AT;O
512<br />
15<br />
,0<br />
5<br />
%<br />
V-OH<br />
T-RF<br />
' B = 6.2 T<br />
1=250 kA<br />
n. = 1.1X1<br />
PORKOLAB et al.<br />
0.5 1.0<br />
Plot<br />
O-OH<br />
• -RF<br />
A=1<br />
B = 5.5 T<br />
1=250 kA<br />
• XiO^m 3<br />
1.5 2.0<br />
/7G. 2. Energy confinement times in OH driven plasmas with LH heating mode (A0 = 180°) <strong>and</strong> with<br />
LH current drive phasing (A = 90°).<br />
with the remainder being lost to collisional absorption near the plasma<br />
edge. Modelling indicates that a 30% degradation of Xe, the electron<br />
thermal diffusivity, is sufficient to explain the present results.<br />
Sawtooth Stabilization with LH Current Drive in Alcator C<br />
Stabilizing sawteeth by means of rf current drive has been studied<br />
in Alcator plasmas at higher densities (ne = 0.6 — 1.2 X 10 20 rn~ 3 ,/p =<br />
250 - 325 kA, qt =4-6) than in other tokamaks [9-11]. The major<br />
diagnostic of the sawtooth behavior is a 16-channel soft x-ray diode array<br />
sensitive in the range 1.5 to 15 keV. The sawtooth period is found to<br />
lengthen during lower hybrid wave injection, <strong>and</strong> with sufficient rf power<br />
(Prf H £ 550 kW for ne = 1.1 x 10 20 m ~ 3 ,IP = 250 kA, BT = 6.2<br />
T) the sawteeth are entirely suppressed [7, 8]. Sawtooth suppression has<br />
only been achieved in the current drive mode of operation, i.e. with the<br />
relative phase between waveguides of A = +90°; stabilization is not<br />
observed with symmetric (A(f> — 180°) or anti-current drive (A^> = —90°)<br />
phasings for the range of rf powers used in this experiment. It has been<br />
noted that as the rf power is increased above Prf « 900A;W\ the sawteeth<br />
recur after 40-50ms, which is comparable to the characteristic L/R time<br />
[7]. In contrast to stabilization experiments on low density plasmas in<br />
ASDEX <strong>and</strong> PLT [9, 10], in the current drive mode (A = 90°) the<br />
-
0J5<br />
0.10-<br />
0.05-<br />
<strong>IAEA</strong>-CN-47/F-II-2 513<br />
FIG. 3. Change in A (= 0p + f/2-/) versus rf power for A = +90° (triangles) <strong>and</strong> A<br />
(circles); BT = 6.0 T, he = 0.8 x 10 20 m 3 = -90°<br />
, Ip = 275 kA, q(a) = 4.7.<br />
sawtooth period increases monotonically (by up to a factor of two) with rf<br />
power until stabilization is achieved. In all cases, the sawtooth inversion<br />
radius inferred from the x-ray measurements remains at r/a ~ 0.2 at all rf<br />
powers for which sawteeth are observed. For A = +90° at rf power levels<br />
near the threshold, high frequency oscillations are often superimposed on<br />
the x-ray sawteeth. In these circumstances, the sawtooth crash times,<br />
as observed on the central soft x-ray channel, can be as long as 1 msec<br />
(compared to the usual crash times of r — -90° (not shown).<br />
The change in fip + £i/2 versus rf power has been measured <strong>and</strong> is<br />
shown in Fig. 3. During rf injection, (3p + £{/2 increases by 0.11 for<br />
A = +90° but only by 0.04 for A = —90°, in contrast to results from<br />
the low density stabilization experiments on ASDEX [9]. From the kinetic<br />
measurements, the thermal f3p is estimated to increase by 0.04 — 0.05 in<br />
both cases. A likely explanation of the difference in the measured values<br />
of (3p-\-£i/2 between the two phasings is an increase in the plasma internal<br />
inductance for the current-drive case. This conclusion is supported by<br />
comparison of the time evolution of j3p + £{/2 for the two phases. While<br />
/5p + £{/2 increases for both phases, the slowest time evolution, which<br />
most likely represents the change in the internal inductance, is negative<br />
for A
514 PORKOLAB et al.<br />
the plasma (r/a ~ 0.6 — 0.8), resulting in an increased inductance, but is<br />
flattened near the center such that q(r) > 1 everywhere.<br />
Ion Bernstein Wave Heating Experiments in Alcator C<br />
Ion Bernstein wave (IBW) heating experiments have been carried out<br />
in Alcator C in order to test the effectiveness of this technique for heating<br />
high density plasmas (n, > 1 x 10 2O m~ 3 ). Efficient ion heating with<br />
IBW has been reported at lower plasma densities in tokamaks by Ono <strong>and</strong><br />
coworkers [12]. However, the heating mechanism remained somewhat controversial<br />
<strong>and</strong>,in addition to minority heating, nonlinear absorption mechanisms<br />
have also been advocated to explain the observed results [13,14].<br />
The present work indicates that both nonlinear absorption <strong>and</strong> improved<br />
ion energy confinement could play a significant role in the ion heating<br />
process.<br />
Ion Bernstein waves were launched by a low field side, center fed,<br />
moveable T-shaped loop antenna, with the center conductor aligned parallel<br />
to the toroidal magnetic field, <strong>and</strong> surrounded by a double layered<br />
Faraday shield. The outer dimensions of the stainless steel antenna are:<br />
width
<strong>IAEA</strong>-CN-47/F-II-2 515<br />
0 100 200 300 400 500 600<br />
time (ms)<br />
FIG. 4. Time sequence of a typical shot with rf injection in the IBW regime, B = 7.5 T, I = 240 kA.<br />
incoming IBW wave at the plasma edge should be complete. Nevertheless,<br />
even in such cases efficient central bulk hydrogen <strong>and</strong> deuterium minority<br />
ion heating was observed.<br />
A typical shot during IBW launching at B=7.6T is shown in Fig.4.<br />
The hydrogen bulk temperature rises by an amount ATJJ ~ 300 eV for<br />
Prf = 125kW as measured by st<strong>and</strong>ard mass-resolving charge exchange<br />
neutral analysis. The density rises by 30%, the loop voltage, Zeff <strong>and</strong><br />
the electron temperature remain nearly constant. The ion temperature<br />
profile is centrally peaked, <strong>and</strong> is quite similar to the initial ohmic profile.<br />
Plots of the increase in the bulk hydrogen temperature versus RF<br />
power at three different values of the magnetic field (corresponding to the<br />
three regimes discussed before) are shown in Fig.5. The most efficient<br />
ion heating is recorded for the case of B = 9.3 T (or ($ = 1.25, £^<br />
= 2.5). The typical range of densities corresponding to these data were<br />
ne ~ (0.7 — 1.1) x 10 2o m~ 3 . Typical heating rates corresponding to these<br />
cases are AT(eV)/P(kW) ~ 2.2-3.3 at a density of ne ~ 1.0 X lO 20 " 3 . In<br />
all cases a threshold power is apparent before heating is observed (namely<br />
PtK ~ 20 kW for £^ ) = 2.5, Pth ~ 35 kW for ^ = 1.5, <strong>and</strong> Pth < 10 kW<br />
for *g> = 1.25).<br />
In general, significant heating at any magnetic field is observed only<br />
at densities ne
516 PORKOLAB et al.<br />
500<br />
400<br />
-* 300<br />
200<br />
100<br />
40 60 80 100 120 140 160<br />
PRF(kW)<br />
FIG. 5. AT( versus P^ for three values of B. At B = 9.3 T, lH(0) = 1.25; at B = 7.5 T,<br />
(H(0) = 1.50; at B = 5 T, (H(0) = 2.5, ne = (0.7- 1.1) x 10 20 m 3 .<br />
is present, Tp ~ T/j. In particular, the hydrogen ion temperature rise<br />
is independent of the presence of deuterium, indicating that nonlinear<br />
absorption is operative in this regime [14]. However, to some extent at<br />
tH = 1.5, <strong>and</strong> especially at £H = 1.25 the deuterium temperature (with<br />
typical concentrations of 0.5-10%) may achieve significantly higher values<br />
than the hydrogen majority component. For example, at B = 9.3T,<br />
TD £ 3.5 keV while TH 1.5 x 10 2O m~ 3 , Te often decreased owing to increasing<br />
values of radiation. Nevertheless, Ti does not decrease, <strong>and</strong> the electron<br />
to ion temperature ratio may approach unity (in contrast to pure ohmic<br />
discharges where Te > Ti). This phenomena is observed at densities up<br />
to ne ~ 2 x 10 20 m- 3 at both B = 7.5 T (iff = 1.5) <strong>and</strong> B = 9.3 T (*g }<br />
= 1.25). These results clearly indicate the importance of direct rf heating<br />
of ions (as long as Te > Tj, collisional heating of ions due to confinement<br />
improvement cannot be ruled out).<br />
In most discharges for which ne < 2.5 X 10 20 ro~ 3 , IBW injection results<br />
in a significant increase in the global particle confinement time, rp.<br />
Typically, a large increase in electron density, accompanied by a decrease<br />
in the particle source rate as inferred from the Ha emission, is observed.
400<br />
300<br />
200<br />
100<br />
<strong>IAEA</strong>-CN-47/F-II-2 517<br />
I i i<br />
. 4<br />
A<br />
- r<br />
& O<br />
i i i i<br />
a 30
518<br />
3.5<br />
3.0<br />
I"<br />
o<br />
t<br />
a.<br />
1 .0<br />
PORKOLAB et al.<br />
O B,=9.2-9.5 T<br />
• B,=7.4-8.0 T<br />
for Prf>80 kW<br />
O O O -<br />
0.5<br />
0.0 1.0 2.0 3.0 4.0<br />
target ne (x10 20 m" 3 )<br />
FIG. 7. Particle confinement time with <strong>and</strong> without IBW injection versus density. B = 9.4 T.<br />
made by mapping out the dispersion relation. The excitation of the IBW<br />
is optimized when In evaluated at the antenna is just below an integer<br />
value, as expected from theory. The scattered CO2 signal intensity at<br />
x/a ~ +0.4, B — 7.5T, is shown as a function of density in Fig. 8a. A<br />
sharp decrease of the scattered signal is observed above ne ~ 1 X 10 20 m~ 3 .<br />
This density corresponds to the ion heating "density limit", <strong>and</strong> the loss<br />
of ion heating may be attributed to the inaccessibility of the IBW to the<br />
plasma interior. To check this hypothesis, the level of low-frequency fluctuations<br />
was measured near the plasma edge by CO2 scattering. The relative<br />
magnitude of these fluctuations is plotted on Fig. 8b. A strong correlation<br />
between the increased level of low frequency edge fluctuations <strong>and</strong><br />
the decreased level of IBW in the plasma interior is observed as the density<br />
is increased above ne > 1 x 10 20 m~ 3 . In the present case a minimum in the<br />
low frequency fluctuation activity is observed at ne ~ 1 x 10 2O m~ 3 > <strong>and</strong> at<br />
the same density IBW <strong>and</strong> ion heating (see Fig.6) maximize in the plasma<br />
interior. Thus, the density limit for IBW heating may be associated with<br />
strong scattering by low frequency density fluctuations [16].<br />
A brief discussion regarding the physics of IBW heating in Alcator C is<br />
in order. As shown in Ref. 14, we expect that nonlinear absorption should<br />
dominate (even in the presence of minority species) at the resonances<br />
1$ = 2.5 (m = 5, B = 5T) <strong>and</strong> ($ = 1.5 (m = 3, B = 7.5T). The<br />
situation at B=9.3T is more complex. In particular, both nonlinear <strong>and</strong><br />
linear absorption can take place near the plasma edge where i£ — 1.5<br />
(TO = 3) <strong>and</strong> £p = 3, or nonlinear absorption can take place near the
40<br />
-20 -<br />
•(a)<br />
<strong>IAEA</strong>-CN-47/F-H-2 519<br />
•<br />
t<br />
t<br />
•<br />
I<br />
• | i | i<br />
1 2 3 4<br />
ne (10 20 m- 3 )<br />
FIG. 8. Scattered CO2 power versus nefrom (a) IBW at rla = 0.4, <strong>and</strong> (b) low frequency fluctuations,<br />
(An/n) 2 at rla = 0.83. Hydrogen plasma, B = 7.5 T.<br />
center on the deuterium minority where £D — 2.5 (m = 5) (this may<br />
be the only possible process at B>10T). The nonlinear threshold for one<br />
e-fold decay of the transmitted power in a single pass is given by [14]<br />
1.14 x 10 19 Wk± 2 R(m)(P(kW)/S(m 2 )) > 1<br />
where W is the nonlinear matrix element whose values are given in Fig.9 for<br />
m=3, 5. P/S is the transmitted power density, <strong>and</strong> Y = (fcj./2)(w^i/wpi) X<br />
(deR/dk±) is a quantity proportional to the group velocity. Typical values<br />
of Y vary from Y ~ 0.3 — 0.1 for k±rci ~ 1.2 — 2. The other plasma parameters<br />
are in st<strong>and</strong>ard notation, including R, the major radius. The<br />
calculated threshold powers for each regime are listed in Table 1. Here<br />
we assumed an effective power transmission area of S=2A, where A is the<br />
antenna surface. We see that the calculated thresholds are in reasonable<br />
agreement with the observed values at B=5T <strong>and</strong> B=7.5T. The situation<br />
at B=9.3T is complicated by the presence of the surface absorption layer<br />
at r ~ 10 cm (r/a ~ 0.83). In order to explain the observed energetic<br />
deuterium component, at least part of the wave power penetrates to the<br />
plasma center. This phenomena is not well understood at present, especially<br />
since linear absorption is also effective at the plasma edge. If edge<br />
absorption is operative, it also produces significant central bulk heating
520<br />
0.10<br />
0.08 -<br />
0.06 -<br />
0.04 -<br />
0.02 -<br />
PORKOLAB et al.<br />
0 1 2 3 4 5 6 7 8<br />
FIG. 9. Non-linear cyclotron damping matrix element, W, versus k±rcifor IBW.<br />
of hydrogen, apparently by improving energy confinement of ions near the<br />
center. In addition, tens of kW s of power would be transferred to the H<br />
majority by collisional equilibration from the energetic deuterium minority<br />
component. Further complications arise from significant ponderomotive<br />
forces at the surface. Detailed theoretical <strong>and</strong> transport code studies of<br />
these complex phenomena are underway.<br />
Particle Confinement in LHCD Plasmas<br />
in the Versator II Tokamak<br />
We have reported previously that significant density increases (up to<br />
factors of two) observed during combined ohmic <strong>and</strong> 800 MHz LHCD at<br />
densities ne
TABLE 1. THRESHOLD POWERS<br />
B(0) (T)<br />
5.2<br />
7.6<br />
9.3<br />
m<br />
5<br />
5<br />
3<br />
3<br />
3<br />
3<br />
5<br />
Resonance<br />
at (r/a)<br />
0.5<br />
0.5<br />
-0.3<br />
-0.3<br />
0.9<br />
0.9<br />
0<br />
<strong>IAEA</strong>-CN-47/F-H-2 521<br />
Ion Species<br />
absorbing<br />
H (maj)<br />
D (min)<br />
H (maj)<br />
D (min)<br />
D (min)<br />
H (maj)<br />
2% D (min)<br />
n(r)<br />
(10 20 m- 3 )<br />
0.8<br />
0.8<br />
0.8<br />
0.8<br />
0.1<br />
1.0<br />
Ti(r)<br />
(keV)<br />
0.4<br />
0.4<br />
0.7<br />
0.7<br />
0.1<br />
1.0<br />
Pth (kW)<br />
served during injection of the 2.45 GHz RF power, even at densities<br />
n(>lx 10 19 cm~ 3 . In Fig. 10, the line-averaged density, ne, is shown to<br />
increase from ne ~ 1.3 X 10 19 to ~ 1.9 x 10 19 cm~ 3 when 60 kW of 2.45<br />
GHz RF power is applied in the current drive mode (Acf> — 90° relative<br />
waveguide phasing). The density profile is broadened <strong>and</strong> increased while<br />
the Ha profile height is decreased during RF injection. Since emissions<br />
from carbon <strong>and</strong> oxygen impurities did not show any increase during RF<br />
injection, the electron source term S is dominated by ionization of hydrogen<br />
neutrals. The global confinement can be calculated from the particle<br />
balance equation, dNejdt = S — Ne/rp. The particle confinement time is<br />
found to increase by a factor of ~ 2.2 during RF injection. The density<br />
increase is largest for a relative waveguide phasing of A
522<br />
CA<br />
PORKOLAB et al.<br />
PRP=60kW<br />
20 25<br />
Time (ms)<br />
FIG. 10. Temporal evolution of the line-averaged density ne, the total electron number Ne, the ionization<br />
source term S deduced from Ha emissivity profiles, <strong>and</strong> ike calculated global particle confinement<br />
time rp in Versator II during LHCD.<br />
value is increased from 1.6 x 10 19 cm~ 3 to 2.0 x 10 19 cm~ 3 . This dependence<br />
may be explained by improved wave access when the magnetic field<br />
is increased, in agreement with other current drive effects. The exact<br />
physical mechanism responsible for the improved confinement during RF<br />
current drive has not been identified yet.<br />
ACKNOWLEDGEMENTS<br />
The authors are grateful to the Alcator <strong>and</strong> Versator technical staff for their help<br />
in these experiments. They also thank Dr. S. McCool <strong>and</strong> Dr. R. Watterson for their<br />
contributions to the Thomson scattering experiments.<br />
This work was supported by the United States Department of Energy, under<br />
Contract No. DE-AC02-78ET51013.<br />
30
<strong>IAEA</strong>-CN-47/F-II-2 523<br />
REFERENCES<br />
[1] KNOWLTON, S., et al., Phys. Rev. Lett. 57 (1986) 1529;<br />
TAKASE, Y., et al., Nucl. Fusion 27 (1987) 53.<br />
[2] PORKOLAB, M., et al., Phys. Rev. Lett. 53 (1984) 450.<br />
[3] KAYE, S.M., GOLDSTON, R.J., Nucl. Fusion 25 (1985) 65.<br />
[4] BONOLI, P., ENGLADE, R., PORKOLAB, M., in Heating in Toroidal Plasmas (Pcoc. 4th Int.<br />
Symp. Rome, 1984), Vol. 2, Int. School of Plasma Physics, Varenna (1984) 1311.<br />
[5] TEXTER, S., Ph.D. Thesis, 1986; Rep. PFC/JA-86-10, Plasma Fusion Center, Massachusetts<br />
Inst. of Tech., Cambridge (1986).<br />
[6] PORKOLAB, M., et al., Phys. Rev. Lett. 53 (1984) 1229.<br />
[7] PORKOLAB, M., et al., in Controlled Fusion <strong>and</strong> Plasma Heating (Proc. 13th Europ. Conf.<br />
Schliersee, 1986), Vol. 2, European Physical Society (1986) 445.<br />
[8] PORKOLAB, M., et al., Bull. Am. Phys. Soc. 30 (1985) 1493.<br />
[9] SOLDNER, F., et al., Phys. Rev. Lett. 57 (1986) 1137.<br />
[10] CHU, T.K., et al., Nucl. Fusion 26 (1986) 666.<br />
[11] VAN HOUTTE, D., et al., Nucl. Fusion 24 (1984) 1485.<br />
[12] ONO, M., et al., Phys. Rev. Lett. 54 (1985) 2339.<br />
HOSEA, J., et al., Plasma Phys. Controll. Fusion 28 (1986) 1241.<br />
[13] ABE, H., et al., Phys. Rev. Lett. 53 (1984) 1153.<br />
[14] PORKOLAB, M., Phys. Rev. Lett. 59 (1985) 434.<br />
[15] TAKASE, Y., et al., Bull. Am. Phys. Soc. 31 (1986) 1587.<br />
[16] ONO, M., Phys. Fluids 25 (1982) 990.<br />
[17] LUCKHARDT, S.C., et al., Phys. Fluids 29 (1986) 1985.<br />
[18] MAYBERRY, M.J., et al., Phys. Rev. Lett. 55 (1985) 829.<br />
DISCUSSION<br />
R.J. GOLDSTON: The Alcator team has previously identified ion thermal<br />
losses as the cause of the deterioration of confinement at high density. Now you have<br />
a tool to heat ions or perhaps to improve their confinement. How do the electrons<br />
respond when the ion temperature rises?<br />
M. PORKOLAB: The electron temperature remains nearly constant as the RF<br />
power is injected. In some instances, at the highest power levels, Te may decrease<br />
by 10-20% because of radiation losses associated with injection of high Z; impurities.<br />
In all cases, however, Te > T( is observed. Since we heat ions exclusively, it<br />
is hard to say anything about electron confinement.<br />
K. UEHARA: Did you observe a relationship between the energy confinement<br />
time <strong>and</strong> PRF in the low density regions where TE is better than in the OH case? And<br />
what was TE in the low density region as compared with TE during injection of RF<br />
power?<br />
M. PORKOLAB: Our Thomson scattering equipment does not operate reliably<br />
at densities below 3 x 10 19 nr 3 . Hence, we have no information on confinement at<br />
very low densities, i.e. below 1 x 10 19 nr 3 . However, if the trend in our data<br />
remained the same, I would expect TE (RF) > rE (OH) at these low densities. This<br />
would be consistent with observations in other machines.
<strong>IAEA</strong>-CN-47/F-II-3<br />
CURRENT DRIVE BY LOWER HYBRID WAVES<br />
AT 3.7 GHz IN PETULA B<br />
F. PARLANGE 1 , D. VAN HOUTTE 1 ,<br />
H. BOTTOLLIER-CURTET, G. BRIFFOD, P. CHABERT 1 ,<br />
M. CLEMENT, C. DAVID 2 , A. GIRARD, C. GORMEZANO 2 ,<br />
W. HESS 1 , M. HESSE 1 , G.T. HOANG 1 , G. ICHTCHENKO,<br />
J.M. RAX 1 , F. RYTER 3 , J.C. VALLET 1<br />
Association Euratom-CEA,<br />
Departement de recherches sur la fusion controlee,<br />
Centre d'etudes nucleaires de Grenoble,<br />
Grenoble, France<br />
Abstract<br />
CURRENT DRIVE BY LOWER HYBRID WAVES AT 3.7 GHz IN PETULA B.<br />
The density limit for Lower hybrid current drive is extended to 8 x 10 13 cm" 3 by increasing the<br />
frequency from 1.3 to 3.7 GHz. When the density is increased above 2 x 10 13 cm" 3 , the plasma<br />
current cannot be replaced entirely by RF current, because of limited power <strong>and</strong> wave absorption saturation.<br />
Even with partial current replacement, sawteeth can be suppressed with rather low power. In some<br />
cases, this may be due to a broadening of the current profile <strong>and</strong> the vanishing of the q = 1 surface.<br />
In other cases, there is some evidence that relaxations may be suppressed while q < 1 on axis.<br />
1. INTRODUCTION<br />
The capability of lower hybrid current drive to produce more stable discharges<br />
than inductive drive is of great interest at present, in view of the high temperature<br />
relaxation limiting performances in today's experiments [1]. The spatial distribution<br />
of wave driven currents is a priori different from that in the Ohmic case. In addition,<br />
the existence of fast electrons having the wave velocity affects the plasma DC<br />
conductivity. Therefore, even partial sustainment of a discharge by waves should<br />
modify the stability of tokamak plasmas against MHD resistive modes <strong>and</strong> sawtooth<br />
relaxations.<br />
These effects were demonstrated in an early work on Petula [2] <strong>and</strong> are<br />
currently being observed on other tokamaks [3-5]. Up to now, experiments on Petula<br />
were limited to low densities, r^ < 1.5 X 10 13 cm~ 3 , because of the low RF<br />
frequency of 1.3 GHz <strong>and</strong> critical density phenomena.<br />
1<br />
CEA, Centre d'&udes nucldaires de Cadarache, Saint-Paul-lez-Durance, France.<br />
2<br />
JET Joint Undertaking, Abingdon, Oxfordshire, UK.<br />
3<br />
Association Euratom-Confederation Suisse, Ecole polytechnique fe'de'rale de Lausanne,<br />
Lausanne, Switzerl<strong>and</strong>.<br />
525
526 PARLANGE et al.<br />
Current drive studies in Petula are now being extended to high densities of up<br />
to 10 M cm" 3 , by adding a new lower hybrid equipment at 3.7 GHz [6]<br />
(500 kW/50 ms). The grill with 2x9 waveguides is of the multijunction type <strong>and</strong><br />
emits a well defined Ny spectrum which can be varied from 2.7 to 1.5.<br />
Experiments were made with the following parameters: R = 0.72 m,<br />
a = 0.165 m, BT = 2.8 T, Ip = 100-170 kA, ne = (0.5-10) x 10 13 cm' 3 .<br />
2. DENSITY LIMIT<br />
At low densities (n,, ~ (0.8-1.6) x 10 13 cm 3 ), the current drive efficiency<br />
is similar to what was obtained at 1.3 GHz. The usual figure of merit is<br />
nIR/PRF ~ 10 19 A-m" 2 -W~'. At higher densities, where current drive is no longer<br />
observed at 1.3 GHz because of the density limit effect, a significant decrease in loop<br />
voltage, at constant plasma current, is still measured during the 3.7 GHz RF pulse,<br />
up to the practical operating density of Petula, ne ~ 10 14 cm" 3 (Fig. 1).<br />
However, no complete replacement of the Ohmic current is obtained for<br />
densities higher than ne ~ 2 x 10 13 cm" 3 , owing to the l/ne density scaling of the<br />
lower hybrid current drive <strong>and</strong>, possibly, other phenomena such as wave accessibility<br />
or absorption saturation.<br />
1.0 -<br />
0.5 - I V<br />
•<br />
i i ^ . i i<br />
u<br />
D N// = 1.7<br />
o N// - 2.7<br />
D<br />
-cfi> ; J.7 GHz<br />
\i.3 GHz<br />
i<br />
t<br />
—eft-.<br />
1<br />
3 4 5 6 7<br />
?Te(10 13 cm- 3 )<br />
PHF<br />
PHF<br />
= 300 kW •<br />
- 400 kW<br />
FIG. 1. Relative loop voltage drop <strong>and</strong> parametric decay wave excitation during lower hybrid<br />
current drive.<br />
/<br />
X<br />
10<br />
10
<strong>IAEA</strong>-CN-47/F-II-3 527<br />
In particular, the small effect on loop voltage at n
528 PARLANGE et al.<br />
an increasing function of density. Saturation is also observed for the same power on<br />
electron cyclotron emission [10]. This saturation is interpreted as a limitation in<br />
power absorption when collisions are not sufficient to prevent the formation of a<br />
plateau in the electron distribution function.<br />
In short, compared to the linear relation I = n a P, the experimental points in<br />
Fig. 2 show an improved efficiency at low power, due to enhanced conductivity <strong>and</strong><br />
degradation at high power because of limited absorption.<br />
For N,| = 1.7, accessibility becomes a severe problem preventing propagation<br />
of power to the plasma centre for nc > 4 x 10' 3 cm" 3 (a = 0) <strong>and</strong> giving<br />
a = 5% for ne = 3.2 x 10 13 cm" 3 . Nevertheless, the experimental curves are<br />
quite similar to the N« = 2.7 case <strong>and</strong> can be fitted by taking a = 10%, which<br />
corresponds to accessibility at mid-radius. Saturation is observed, as well.<br />
4. SUPPRESSION OF INTERNAL DISRUPTIONS<br />
Studies of sawtooth activity during lower hybrid current drive were carried out<br />
with an array of soft X-ray diodes supplemented, for some shots, by fast IR<br />
interferometry <strong>and</strong> ECE emission.<br />
For the whole density range of 1 to 6 x 10 13 cm" 3 , the soft X-ray emission is<br />
strongly affected by the lower hybrid current drive <strong>and</strong> may increase by a factor of<br />
three above the Ohmic level, on the central chord.<br />
The sawtooth <strong>and</strong> MHD behaviour during current drive on Petula depends on<br />
the density:<br />
(1) For densities lower than 3 x 10 13 cm" 3 , the sawtooth suppression is<br />
associated with the triggering of an m = 2 mode in a way similar to the<br />
1.3 GHz case [2]. When the density is increased, the MHD oscillations are<br />
triggered later <strong>and</strong> later until, for ne = 3 x 10 13 cm" 3 , they cannot be<br />
observed any longer during a 100 ms RF pulse. Soft X-ray emission starts<br />
increasing in the plasma centre but levels off when the m = 2 mode is present.<br />
(2) In the (3-4.5) X 10 13 cm" 3 density range, amplitude <strong>and</strong> period of the<br />
sawteeth increase at low RF power (Fig. 3). As the RF power is raised, the sawteeth<br />
disappear for some time <strong>and</strong> may start again. The sawtooth structure<br />
becomes more complicated. For sufficiently high power, complete stabilization<br />
is achieved from the beginning of the RF pulse. On the central chord, the X-ray<br />
level goes to a maximum within 8 to 15 ms, after which the emission is<br />
redistributed to the external parts of the plasma. This results in a highly peaked<br />
emission for the first 10 ms, which relaxes to a profile much broader than the<br />
Ohmic one (Fig. 4). The broadening of the SXR emission seems to be triggered<br />
by an m = 1 mode, which is detected slightly before the maximum at the centre<br />
<strong>and</strong> may last for the rest of the RF pulse.
<strong>IAEA</strong>-CN-47/F-II-3 529<br />
Central soft X-ray emission<br />
I =120 kA, n = 3xlO a cm~ 3 <strong>and</strong> = 1.7<br />
p & //<br />
1.2<br />
ISO<br />
FIG. 3. Soft X-ray signal on central chord at three different powers compared to Ohmic case. Noise<br />
on two highest power traces is m = 1 MHD oscillation.<br />
I S.X.R.(a.u')<br />
Ip - 122 kA<br />
fie ' 3.4x10 n cm- 3<br />
N// - 1.7<br />
-5 10 15<br />
FIG. 4. Soft X-ray emission profile for he = 3.2 x 10 13 cm 3 . Before RF pulse (solid circles), 10 ms<br />
(circles) <strong>and</strong> 25 ms (squares) after beginning of RF pulse.<br />
.2"-
530 PARLANGE et al.<br />
S.X.R | r = 0<br />
3.6 • fo.u.l<br />
2.7<br />
1.8<br />
9<br />
1<br />
1 ~f<br />
i fT<br />
1 /1 111<br />
7<br />
. i .<br />
/ i<br />
1<br />
1<br />
n j* . i JL* < .i J . ** • I . . i > « • l/i/iftfcnjll\fif<br />
F/G. 5. 5o^ X-ray signal as a function of time for nt = 6 x /0" cm 3 . Bottom to top: Ohmic<br />
discharge, 150 kW RF discharge, 240 kW RF discharge. Time-scale is 8 ms/div.<br />
The inversion radius of the sawtoothing discharges has been determined for<br />
different RF powers. Up to the power threshold for stabilization, this radius remains<br />
roughly constant <strong>and</strong> close to its value for the Ohmic case, although amplitude <strong>and</strong><br />
period of the sawteeth have been increased by a large factor.<br />
These two facts — constancy of inversion radius <strong>and</strong> presence of m = 1<br />
oscillations — lead to the conclusion that sawteeth can be inhibited with central<br />
q-value smaller than one. Alfven wave measurements [12] indicate, on the other<br />
h<strong>and</strong>, a decrease in the internal inductance but their interpretation is not yet clear.<br />
(3) At higher densities, ne = (4.5-6.5) x 10 13 cm" 3 , the picture is much<br />
simpler. At low RF level, the total soft X-ray emission increases without much<br />
effect on sawtooth amplitude <strong>and</strong> frequency. For sufficiently high power<br />
(~240 kW), internal disruptions disappear completely, <strong>and</strong> the soft X-ray level<br />
may increase for the duration of the RF pulse without the large emission<br />
rearrangement observed at lower densities (Fig. 5). m = 1 oscillations with<br />
low amplitude are sometimes observed. At the highest densities, the RF pulse<br />
is clearly too short for a stationary situation to be established.<br />
All these observations refer to the case of NB = 1.7. It is to be noted that sawteeth<br />
could not be suppressed at high density, with the Nj = 2.7 spectrum, although<br />
the effects were quite similar for low powers, for the two spectra.<br />
5. CONCLUSIONS<br />
Current drive effects were observed up to 8 X 10 cm 3 . The Ohmic current<br />
replacement was limited by the high power required for high density <strong>and</strong> absorption<br />
saturation, which impairs the apparent efficiency, in the intermediate density range.<br />
1.
<strong>IAEA</strong>-CN-47/F-II-3 5 31<br />
Even at the highest densities, temperature relaxation is suppressed with<br />
moderate power levels, compared to what would be required for complete replacement<br />
of the inductive drive (AV/V ~ 25%).<br />
The power requirements could be further reduced by using the accessibility<br />
properties of the lower hybrid waves to deliberately generate an off-axis current [11].<br />
Experiments along this line in Petula were difficult to interpret. Even at the highest<br />
densities, the efficiency of waves with fast phase velocities, N[ = 1.7, remains high<br />
although accessibility would localize these waves in the plasma periphery. Moreover,<br />
the presence of m = 1 oscillations, already observed on PLT [5], indicates that<br />
sawtooth stabilization mechanisms more complex than the simple decrease in central<br />
current density have to be considered.<br />
ACKNOWLEDGEMENTS<br />
The authors wish to thank Mr. Agarici <strong>and</strong> Mr. Panzarella for their technical<br />
support <strong>and</strong> the RF team for the design <strong>and</strong> operation of the RF system.<br />
REFERENCES<br />
[1] LALLIA, P.P., JET TEAM, Plasma Phys. Contrail. Fusion 28 (1986) 1211.<br />
[2] VAN HOUTTE, D., et a]., Nucl. Fusion 24 (1984) 1485.<br />
[3] PORKOLAB, M., et al., in Controlled Fusion <strong>and</strong> Plasma Heating (Proc. 13th Europ. Conf.<br />
Schliersee, 1986), Vol. 2, European Physical Society (1986) 445.<br />
[4] SOLDNER, F.X., et al., Phys. Rev. Lett. 57 (1986) 1137.<br />
[5] HOSEA, J., et al., Plasma Phys. Contrail. Fusion 28 (1986) 1241.<br />
[6] REY, G., et al., in Controlled Fusion <strong>and</strong> Plasma Heating (Proc. 13th Europ. Conf. Schliersee,<br />
1986), Vol. 2, European Physical Society (1986) 339.<br />
[7] WEGROWE, J.G., TONON, G., Non-inductive Current Drive in Tokamaks (Proc. <strong>IAEA</strong><br />
Techn. Comm. Meeting Culham, 1983), Vol. 2, Culham Laboratory, Abingdon (1983) 343.<br />
[8] FISCH, N.J., Phys. Fluids 28 (1985) 245.<br />
[9] RAX, J.M., Saturation Induction <strong>and</strong> Radiation in Wave-Driven Plasmas, Rep. EUR-CEA-<br />
FC-1298, Association Euratom-CEA sur la fusion, Centre d'e'tudes nucteaires de Cadarache,<br />
Saint-Paul-lez-Durance (1986).<br />
[10] GIRARD, A., et al., in Controlled Fusion <strong>and</strong> Plasma Heating (Proc. 13th Europ. Conf.<br />
Schliersee, 1986), Vol. 2, European Physical Society (1986) 374.<br />
[11] BRIFFOD, G., et al., ibid., p. 453.<br />
[12] COLLINS, G.A., et al., submitted to Plasma Phys. Contrail. Fusion.<br />
DISCUSSION<br />
F.X. SOLDNER: In your sawtooth stabilization results you report that for some<br />
cases there is a continuous increase in the intensity of the soft X-ray emission after<br />
suppression of the sawteeth. You attribute this to the occurrence of one giant sawtooth.<br />
Could it not be just a continuous acceleration of the fast electrons generated<br />
by your low NB spectrum in the DC electric field?
532 PARLANGE et al.<br />
F. PARLANGE: The giant sawtooth was mentioned only to stress the fact that<br />
we do not have a stationary situation <strong>and</strong> that the X-ray level could not go on increasing<br />
for ever if the RF pulse was longer. As far as the continuous acceleration of fast<br />
electrons is concerned, it should be noted that this occurs only at high density<br />
(6 x 10 19 m~ 3 ) <strong>and</strong> not at lower densities (< 4 x 10 19 m" 3 ), <strong>and</strong> that the hard<br />
X-ray signal is quite flat.<br />
K. McGUIRE: Do you observe improved confinement time or increased stored<br />
energy when you stabilize the sawtooth oscillation?<br />
F. PARLANGE: Neither electron cyclotron emission nor X-rays can be used<br />
to measure the electron temperature profile during current drive because of the<br />
presence of the energetic tail. Furthermore, Thomson scattering was not reliable<br />
during the 3.7 GHz campaign, so that we have no possibility to measure the stored<br />
energy.
EXPERIMENTS ON<br />
CURRENT DRIVE AND PLASMA HEATING<br />
BY LH AND EC WAVES<br />
IN THE T-7 TOKAMAK<br />
V.V. ALIKAEV, A.A. BORSHCHEGOVSKIJ,<br />
V.V. CHIST'AKOV, Yu.A. GORELOV, V.I. IL'IN,<br />
D.P. IVANOV, N.V. IVANOV, A.M. KAKURIN,<br />
P.P. KHVOSTENKO, A.Ya. KISLOV, V.A. KOCHIN,<br />
P.E. KOVROV, K.I. LIKIN, Yu.S. MAKSIMOV,<br />
I.B. SEMENOV, A.F. SHIGAEV, Yu.A. SOKOLOV,<br />
N.L. VASIN, V.V. VOLKOV<br />
I.V. Kurchatov Institute of Atomic Energy,<br />
Moscow, Union of Soviet Socialist Republics<br />
J. DATLOV, V. KOPECKY, L. KRYSKA<br />
Institute of Plasma Physics,<br />
Czechoslovak Academy of <strong>Sciences</strong>,<br />
Prague, Czechoslovakia<br />
Presented by F. Zdcek<br />
Abstract<br />
<strong>IAEA</strong>-CN-47/F-II-4<br />
EXPERIMENTS ON CURRENT DRIVE AND PLASMA HEATING BY LH AND EC WAVES IN<br />
THE T-7 TOKAMAK.<br />
A microwave set in the ECR range, including two gyrotrons with X = 4.8 mm <strong>and</strong> a total power<br />
of about 400 kW, was added to the lower hybrid set (600 kW, f = 900 MHz), for further development<br />
of current drive experiments in T-7. Experimental results on the application of LH <strong>and</strong> EC power are<br />
presented in this paper. The initial stage, where gas breakdown was performed by an EC wave, was<br />
followed by LH current ramp-up. In the experiments on LH current sustainment, attention was paid to<br />
the dependence of current drive efficiency on electron temperature <strong>and</strong> to a study of the plasma power<br />
characteristics. Application of ECRH allowed a rise of the electron temperature from 1 to 4 keV, at<br />
plasma densities within a range of ne = (5-7) x 10 12 cm" 3 . In this case, a rise in the current drive<br />
efficiency was observed. The LH current drive was accompanied by substantial electron heating. The<br />
electron energy confinement time for the LH <strong>and</strong> EC heating techniques is well described by an 'Ohmic'<br />
scaling law.<br />
533
534 ALIKAEV et al.<br />
1. INTRODUCTION<br />
In further developing the LHCD experiments in the T-7 tokamak [1, 2], grill<br />
waveguide conditioning by glow discharge was used which enabled us to raise the<br />
LH power launched. In addition to the LH system, the tokamak was supplied with<br />
an EC system including two gyrotron generators operating at f = 63 GHz. The<br />
output power of each gyrotron is 200 kW for a pulse duration of 100 ms. 90% of<br />
the gyrotron power is radiated as an electromagnetic wave with a polarization<br />
corresponding to the ordinary wave in the plasma. The power from the gyrotrons is<br />
launched into the tokamak chamber along oversized cylindrical waveguides, 80 mm<br />
in diameter, through a horizontal port. A mode converter, which converts the<br />
incident radiation with ordinary polarization into a radiation with a polarization<br />
corresponding to the extraordinary wave, is installed at the chamber wall opposite<br />
to the waveguides. The reflected radiation mainly propagates at an angle 80° to the<br />
toroidal magnetic field.<br />
The main parameters of the T-7 tokamak are: the major <strong>and</strong> minor chamber<br />
radii are 122 <strong>and</strong> 35 cm. The main ring-like limiter has a radius of 31.5 cm, the rail<br />
limiter is located at the bottom part of the chamber at a distance of a = 25-31.5 cm<br />
from the chamber axis. The toroidal magnetic field in most cases was BT = 2.3 T,<br />
the discharge current was I < 200 kA in deuterium. The magnitude of the longitudinal<br />
moderation of the LH wave related to the spectral power distribution maximum<br />
at the grill mouth for a relative phase shift of 90° corresponded to NB « 3.<br />
The set of diagnostics enabled us to record the plasma parameters including the<br />
diamagnetic flux, the electron density along six chords, <strong>and</strong> the X-ray spectra in the<br />
energy range of 2-150 keV (with two germanium detectors). One detector was<br />
located in the horizontal port <strong>and</strong> the other in the vertical port. The line of sight of<br />
each detector could be scanned so that the spatial X-ray spectra distributions could<br />
be determined. The radiation losses were recorded by a wide angle pyroelectric<br />
detector. The impurity spectral line intensities were recorded by optical instruments<br />
in the visible area of the spectrum. The ion temperature at the plasma column axis<br />
was recorded by a five channel charge exchange neutral spectrum analyser.<br />
2. NON-INDUCTIVE DISCHARGE STARTUP<br />
Experiments, in which gas breakdown, ramp-up <strong>and</strong> sustainment of the toroidal<br />
current were performed by RF methods only, were recently carried out in some<br />
tokamaks [3, 4]. Using these techniques, one can expect startup <strong>and</strong> continuous<br />
plasma sustainment in tokamaks without inductors or, at least, substantial savings in<br />
the inductor magnetic flux.<br />
Only ECR power — 360 kW — was launched into the tokamak at the first stage<br />
of the gas breakdown experiments. A toroidal field of 2.3 T, corresponding to the<br />
ECR zone position near the tokamak chamber axis, was used. The primary winding<br />
of the tokamak was short circuited; deuterium was the working gas.
<strong>IAEA</strong>-CN-47/F-H-4<br />
•\l<br />
ne(10 12 cm- 3 )<br />
-30 -20 -10 0 10 20 #r(cm)<br />
FIG. I. Spatial distributions of average (over vertical chords) plasma density.<br />
-20 -10 0 r (cm)<br />
FIG. 2. Signals of pyroelectric detectors versus position of ECR point.<br />
too<br />
50<br />
n<br />
is 20 25 JO r (cm)<br />
FIG. 3. Spatial distribution of electron temperature.<br />
2<br />
0<br />
-2<br />
IL(A)<br />
20<br />
n<br />
o ° o<br />
o<br />
o<br />
"i<br />
if" 0 ;<br />
o<br />
o<br />
\<br />
/ ' o ° , i ° ° °i<br />
-S3 -40 -?0 0 ?0 40<br />
FIG. 4. Toroidal <strong>and</strong> limiter currents versus B±.<br />
535
536 ALIKAEV et al.<br />
I, (A),<br />
Z h 6 &<br />
ne(10 12 cnr 3 ) '<br />
FIG. 5. Rail limiter current versus plasma density.<br />
0 50 100 150 200 0 50 100 150 200<br />
t(ms)<br />
FIG. 6. Oscillograms of toroidal current <strong>and</strong> loop voltage.<br />
Effective gas ionization occurred under ECR power injection into the tokamak<br />
chamber. An almost unchanged plasma density, depending on the initial neutral gas<br />
pressure, prevailed up to the end of the microwave pulse, after a 10-15 ms transient<br />
process. A typical spatial plasma density distribution at a pressure of 3 X 10 " 5 torr<br />
is shown in Fig. 1. At pressures 2: 10 " 4 torr, gas ionization occurred nonsimultaneously<br />
in different chamber regions; signals from the interferometer<br />
channels located at r = -15.5 cm <strong>and</strong> at r = -6.5 cm increased with =5ms delay<br />
in comparison with the signals from the other channels.<br />
The signals from two wide angle pyroelectric detectors placed in the upper<br />
diagnostic port versus the toroidal field (<strong>and</strong> hence the ECR zone position) are<br />
represented in Fig. 2. The first detector r = 0 recorded the energy losses, P, from<br />
the plasma by radiation <strong>and</strong> charged particles, the second detector (r = -10 cm)<br />
measured the losses by radiation only, Pr The direction of the magnetic field<br />
corresponded to the upward direction of electron toroidal drift. The electron temperature<br />
as measured by a double Langmuir probe was 70-80 eV (Fig. 3).<br />
A toroidal current depending on the vertical magnetic field Bx (Fig. 4)<br />
was generated when the ECR power was injected in case the tokamak primary<br />
winding was short circuited. In magnitude <strong>and</strong> direction, this current coincided with<br />
the current which should be driven as a result of electron accumulation on top<br />
due to toroidal drift <strong>and</strong> their drain-off along the inclined magnetic field lines:
<strong>IAEA</strong>-CN-47/F-II-4 537<br />
I = a 2 enevdBT/B± (lines 1 in Fig. 4). For low B±, the driven current should be<br />
limited at a level where the field produced by this current reaches a value «BX:<br />
I = acB±/2, which is observed in the experiment (line 2 in Fig. 4). The current IL<br />
passing between rail limiter <strong>and</strong> chamber wall is shown in the same figure. The direction<br />
of this current corresponds to the toroidal drift direction of charged particles, <strong>and</strong><br />
its value depends on the plasma density, as is shown in Fig. 5.<br />
The breakdown was followed by a stage of toroidal plasma current ramp-up by<br />
the lower hybrid wave. ECR <strong>and</strong> LH systems were switched on simultaneously in<br />
this experiment. The ECR system was under operation for 30 ms, <strong>and</strong> the LH system<br />
for 150 to 200 ms, at a power of 300 kW.<br />
If the primary tokamak winding was short circuited, the current rose up to<br />
15-20 kA in 30-40 ms, after which the current rise was decelerated substantially<br />
(Fig. 6(a)). The current trace virtually did not depend on the duration of ECR system<br />
operation. Probably, ramp-up deterioration was caused by the self-inductive electric<br />
counter field in the plasma which affects hot electrons with energies of mc 2 /2N|.<br />
The time of their appearance must be of the order of magnitude of the Coulomb<br />
collision time for the electrons of such energies, i.e. r « 40 ms.<br />
Changing the sign of the loop voltage to positive (U = 0.5 V) by means of<br />
primary tokamak winding current control made it possible to retain the high rate of<br />
the plasma current ramp-up during the entire time of LH system operation<br />
(Fig. 6(b)).<br />
3. TEMPERATURE DEPENDENCE OF LOWER HYBRID CURRENT<br />
DRIVE EFFICIENCY<br />
The question of the dependence of LHCD efficiency on the plasma electron<br />
temperature seems to be very important for a better underst<strong>and</strong>ing of the LHCD<br />
phenomenon as well as from the point of view of application of LHCD to a<br />
tokamak reactor. The efficiencies obtained in experiments carried out so far (see,<br />
e.g. [1, 2, 5, 6]) are not sufficiently high for a reactor, <strong>and</strong> previous theoretical<br />
considerations [7] of the current drive mechanism do not predict any change in efficiency<br />
when we go over from temperature values of Te « 1 keV that are typical of<br />
present experiments to reactor scale values of Te = 10 keV. However, an analysis<br />
of the experimental data suggests that these considerations are not quite accurate <strong>and</strong><br />
that the current drive efficiency should depend on the electron temperature in the<br />
conditions of a real experiment.<br />
In fact, it was shown in Refs [2, 8] that, in contrast to Ref. [7], the lower velocity<br />
limit, V,, of the quasi-linear plateau on the electron distribution function does<br />
not coincide with the short wavelength boundary of the spectrum of the LH waves<br />
launched into the plasma from an external source. The probable reason is the<br />
development, in the plasma, of some mechanism of LH wave spectrum broadening<br />
towards parallel phase velocity reduction. This broadening continues until a balance
538 ALIKAEV et al.<br />
is reached between the input RF power transferred to the resonant electrons <strong>and</strong> their<br />
power lost by Coulomb collisions. In the case where the whole current is driven by<br />
LH waves, the value of V, can be found from the known current density which<br />
approximately corresponds to the condition q(0) = 1, from the equation<br />
_ en. Vj- V? -v^e _ cB<br />
J ~ V* VTc 2 ~ 2 TTR { '<br />
Here, ne is the electron density, VTe is the electron thermal velocity, <strong>and</strong> V[ <strong>and</strong> V2<br />
are the limits of the quasi-linear plateau on the electron distribution function. For<br />
ordinary experimental conditions, Eq. (1) yields the approximate solution<br />
V, ~ 2VTe, which is only weakly dependent on the other plasma parameters. As a<br />
result, an electron temperature dependence appears in the expression for the current<br />
drive efficiency:<br />
= Zeff + 5 fl^R = m Vj- V]<br />
23<br />
6 P + ILH U 18 ir 2 e 3 L In (V2/V,)<br />
where U is the loop voltage, ILH = IAU/U0 the driven current, PLH the LH power,<br />
<strong>and</strong> L is the Coulomb logarithm. In formula (4), the driven current is assumed to<br />
flow near the plasma column axis, where the plasma density n,. = 1.5ne.<br />
To verify experimentally the dependence of the efficiency ?; on the electron<br />
temperature we compare results obtained in three tokamak operation regimes. In the<br />
first regime (toroidal field BT = 19 kG, plasma current I = 110 kA, effective<br />
charge Zeff = 2.5, <strong>and</strong> LH power PLH = 40 kW), the electron temperature was<br />
Te = 0.8 keV. The temperature increased up to Te = 2.3 keV in the second regime<br />
(BT = 23 kG, I = 180 kA, Zeff = 2.5, PLH = 180 kW) <strong>and</strong> reached a value of<br />
3.5 keV in the third regime (BT = 23 kG, I = 180 kA, Zeff = 5, PLH = 180 kW),<br />
which differed from the other regimes in that ECRH was applied. The plasma density<br />
in all three regimes was ne = (3-7) x 10 12 cm" 3 . The electron temperature <strong>and</strong> the<br />
effective plasma charge were determined from the results of X-ray spectroscopy<br />
measurements in the energy range of 3-10 keV.<br />
The results of measurements of current drive efficiency in the above regimes<br />
are given in Fig. 7. The power input into the wave propagating parallel to the current<br />
forming electron flux was used as PLH in determining the efficiency. According to<br />
calculations, this power amounted to =70% of the total LH power input into the<br />
plasma, in our case. The result of calculating the dependence of efficiency on<br />
temperature, by formula (4), is also shown in Fig. 7 by the dashed curve. A<br />
characteristic phase velocity of the launched LH wave of V2 = 10 10 cm-s~ l was<br />
chosen in these calculations. It will be seen from Fig. 7 that in the temperature range<br />
investigated the efficiency tends to rise with Te. This increase agrees, within<br />
experimental accuracy, with the result of calculation by formula (4).
<strong>IAEA</strong>-CN-47/F-II-4 539<br />
FIG. 7. Dependence of LHCD efficiency on electron temperature. Result from calculation by<br />
formula (4) is shown by dashed line.<br />
200<br />
KkA) tOO<br />
0<br />
U(V) '<br />
Pr(kW)<br />
0.5<br />
0<br />
{arSu^f\<br />
dt 10<br />
5 6<br />
-10<br />
1.5<br />
AW±(kJ)<br />
0.5 0<br />
TV^-w^-l<br />
0 100 200 3Q0<br />
r<br />
/\<br />
t(tns)<br />
\<br />
200 300 t(ms)<br />
FIG. 8. Oscillograms of main discharge parameters under LHCD. LH pulse duration is shown by<br />
dashed lines.<br />
4. LH AND EC HEATING<br />
Here, we consider the energy balance of a plasma when LHCD is applied to<br />
a discharge that was formed by the ordinary OH method. Typical oscillograms of the<br />
integral discharge parameters are shown in Fig. 8. A fast drop in the loop voltage<br />
was observed upon LH power launching. This voltage drop was followed by a
540 ALIKAEV et al.<br />
to-.<br />
0 10 SO 120 E (keV)<br />
FIG. 9. X-ray spectra in Ohmic regime <strong>and</strong> during LH pulse.<br />
r (cm)<br />
W PO r(cm)<br />
FIG. 10. Spatial distributions of electron temperature <strong>and</strong> density in Ohmic regime <strong>and</strong> during<br />
LH pulse.<br />
transient process lasting =30 ms, <strong>and</strong> then the loop voltage was established at a<br />
quasi-stationary, almost constant level. This level was 0-0.3 V, depending on the<br />
discharge parameters fie, I <strong>and</strong> on the launched LH power. The loop voltage in the<br />
Ohmic discharge stage was U = 0.8 V in these experiments.<br />
Regimes with a discharge current of I = 170 kA were studied in detail. The<br />
typical X-ray spectra recorded in the Ohmic discharge <strong>and</strong> during the LH pulse are<br />
shown in Fig. 9, where we see that, during the LH pulse, besides the appearance of<br />
X-ray radiation within the energy range of 20-150 keV, the slope of this spectrum
<strong>IAEA</strong>-CN-47/F-II-4 541<br />
from 2 to 10 keV is changed substantially. The radial electron temperature distributions,<br />
obtained from the X-ray spectra, <strong>and</strong> ne(r) before the LH power launch <strong>and</strong><br />
50 ms after its triggering, are shown in Fig. 10. We see that a rise in the electron<br />
temperature takes place upon LH power deposition (ATe = 1 keV in the central<br />
part of the plasma column), ne rises by 30-40% <strong>and</strong> reaches 10' 3 cm" 3 at the<br />
plasma column axis. The obtained distributions n,,(r) <strong>and</strong> Te(r) show a considerable<br />
rise, by a factor of about two, in the thermal electron energy. This result is confirmed<br />
by diamagnetic measurements (Fig. 8).<br />
Measurements with pyroelectric detectors showed that the radiation losses<br />
remained virtually unchanged during the LH pulse <strong>and</strong> were equal to 10% of the OH<br />
power deposition. No changes were obtained in the charge exchange neutral spectra<br />
in this case, the ion temperature being Tj(O) = 250 eV at the plasma column axis.<br />
Thus, in the regimes under study, electron heating was observed besides the<br />
current drive. Let us find the LH power absorbed in the plasma, PLH, <strong>and</strong> the<br />
electron energy confinement time, T^" . PLH can be calculated from the equation for<br />
the change in the plasma column energy:<br />
dwLH<br />
dw 0H<br />
dt dt<br />
Here, dW0H/dt <strong>and</strong> dWLH/dt are the time derivatives of the plasma total energy in<br />
the OH regime <strong>and</strong> just after the LH system triggering, obtained from a combined<br />
consideration of the diamagnetic signal <strong>and</strong> the plasma equilibrium signals. AU is the<br />
change in loop voltage. The electron energy confinement time during the LH pulse<br />
is found from the equation describing the power balance for the quasi-stationary state:<br />
= PLH + ULHI (4)<br />
where Wf H is the electron thermal energy obtained by integrating the ne(r) <strong>and</strong> Te(r)<br />
distributions (Fig. 10). We note that the energy transfer from electrons to ions in (6)<br />
is neglected. The results of calculations of PLH, Wf H <strong>and</strong> r£f , together with the<br />
corresponding parameters in the Ohmic regime, are given in Table I. An evaluation<br />
of the parameters of the electron beam produced by LH waves yields 0.8 U <strong>and</strong><br />
0.2-0.3 kJ for the longitudinal <strong>and</strong> transverse beam energies <strong>and</strong> 90 kA for the<br />
current transported by the electron beam.<br />
The ECRH technique was studied in the next portion of this run. The experiments<br />
were done with discharge parameters close to those in which the LH current<br />
drive was conducted. This enabled us to compare the efficiencies of the two heating<br />
techniques.<br />
The oscillograms of the integral discharge parameters shown in Fig. 11 show<br />
that the loop voltage drops, (ft + £-/2) rises <strong>and</strong> fie increases after the gyrotrons are
542 ALIKAEV et al.<br />
TABLE I. LH EXPERIMENT<br />
OH<br />
LH<br />
I<br />
(kA)<br />
170<br />
17<br />
00<br />
i<br />
12<br />
cm 3 )<br />
4.6<br />
6.6<br />
(kW)<br />
140<br />
40<br />
PLH<br />
(kW)<br />
-<br />
160<br />
WT<br />
(W)<br />
1.3<br />
2.5<br />
0 100 300 ttms)<br />
FIG. 11. Oscillograms of main discharge parameters under ECRH. ECRHpulse duration is shown by<br />
dashed lines.<br />
switched on. The power losses recorded by the pyroelectric detector <strong>and</strong> the carbon<br />
line intensities rise, in this case. A comparison of the X-ray spectra obtained for the<br />
Ohmic discharge <strong>and</strong> during the ECR pulse shows that the electron temperature rises<br />
from 1.5 keV to 4 keV <strong>and</strong> the effective charge rises from Zeff = 1.3 to Zeff = 3.<br />
The Te(r) distributions obtained from the X-ray spectra <strong>and</strong> n
<strong>IAEA</strong>-CN-47/F-II-4 543<br />
r(cm)<br />
10 r (cm)<br />
F/G. 72. Spatial distributions of electron temperature <strong>and</strong> density in Ohmic regime <strong>and</strong> during<br />
ECRH pulse.<br />
TABLE II. ECR EXPERIMENT<br />
OH<br />
ECR<br />
I<br />
(kA)<br />
160<br />
160<br />
fie<br />
(10 12 cm" 3 )<br />
4<br />
6<br />
(kW)<br />
135<br />
50<br />
PECR<br />
(kW)<br />
power is launched; hence.the change in internal inductance A^ = 0. In this condition<br />
the time derivative (d/dt)(ft + fyl) immediately after switching the ECR power<br />
on yields the power absorbed in the plasma, PECR. The increase in thermal energy<br />
in the electrons 50 ms after switching ECRH on is 2.3 kJ. The energy content is<br />
found from an integration of n^r) <strong>and</strong> Te(r) (Fig. 12).<br />
The electron energy confinement time under ECRH is found for the quasistationary<br />
state from the energy content W-f CR <strong>and</strong> PECR :<br />
ECR _<br />
WECR<br />
"ECR + URTR I<br />
where UECR is the loop voltage during the ECR pulse. The values of W| CR , PECR <strong>and</strong><br />
7f£ R are shown in Table II. In the table we see that T§£ R > 7^". This is partly due<br />
to the increase in electron density during ECRH. The plasma parameters U, ne, /3r<br />
—<br />
260<br />
WT<br />
(kJ)<br />
1.1<br />
3.4<br />
(ms)<br />
8<br />
11<br />
(ms)<br />
7<br />
12<br />
(5)
544 ALIKAEV et al.<br />
<strong>and</strong> rEe obtained from a numerical simulation are in good agreement with the<br />
experimental data. The calculations were based on the T-l 1 transport coefficients [9];<br />
the difference between the OH <strong>and</strong> ECRH power deposition profiles was taken into<br />
account.<br />
Thus, comparing LH <strong>and</strong> ECRH results, we note that the power absorption<br />
coefficients for LH <strong>and</strong> EC power are approximately the same <strong>and</strong> equal to 0.7-0.8.<br />
A rise in the electron energy confinement time is observed under LHCD <strong>and</strong> ECRH<br />
which is due to the increase in fL,. The values of T^ <strong>and</strong> T|£ R are close to the Ohmic<br />
value 7^e M , in this case.<br />
REFERENCES<br />
[1] ALIKAEV, V.V., et al., in Plasma Physics <strong>and</strong> Controlled <strong>Nuclear</strong> Fusion Research 1982 (Proc.<br />
9th Int. Conf. Baltimore, 1982), Vol. 1, <strong>IAEA</strong>, Vienna (1983) 227.<br />
[2] ALIKAEV, V.V., et al., Fiz. Plazmy 11 (1985) 53 (in Russian).<br />
[3] TANAKA, S., et al., in Plasma Physics <strong>and</strong> Controlled <strong>Nuclear</strong> Fusion Research 1984 (Proc.<br />
10th Int. Conf. London, 1984), Vol. 1, <strong>IAEA</strong>, Vienna (1985) 623.<br />
[4] TOI, K., et al., Phys. Rev. Lett. 52 (1984) 2144.<br />
[5] LLOYD, B., et al., in Non-inductive Current Drive (Proc. <strong>IAEA</strong> Tech. Comm. Mtg Culham,<br />
1983), Vol. 1, UKAEA, Culham Laboratory, Abingdon (1983) 250.<br />
[6] MOTLEY, R., et al., ibid., Vol. 2, p. 299.<br />
[7] FISCH, N.J., Phys. Rev. Lett. 41 (1978) 873.<br />
[8] IVANOV, N.V., Vopr. Atomn. Nauki Tekh., Ser. Termoyadernyj Sintez 3 (1985) 22 (in<br />
Russian).<br />
[9] MEREZHKIN, V.G., MUKHOVATOV, V.S., Pis'ma Zh. Ehksp. Teor. Fiz. 33 (1981) 463 (in<br />
Russian).
<strong>IAEA</strong>-CN-47/F-II-5<br />
ELECTRON CYCLOTRON HEATING OF<br />
LOWER HYBRID CURRENT DRIVEN PLASMA<br />
IN THE JFT-2M TOKAMAK<br />
T. YAMAMOTO, A. FUNAHASHI, K. HOSHINO, S. KASAI,<br />
T. KAWAKAMI, H. KAWASHIMA, T. MATOBA, T. MATSUDA,<br />
H. MATSUMOTO, Y. MIURA, M. MORI, K. ODAJIMA,<br />
H. OGAWA, T. OGAWA, H. OHTSUKA, S. SENGOKU,<br />
T. SHOJI, N. SUZUKI, H. TAMAI, Y. UESUGI, T. YAMAUCHI,<br />
M. HASEGAWA 1 , S. TAKADA 2 , K. HASEGAWA, A. HONDA,<br />
I. ISHIBORI, T. KASHIMURA, Y. KASHIWA, M. KAZAWA,<br />
K. KIKUCHI, Y. MATSUZAKI, K. OHUCHI, H. OKANO,<br />
T. SHIBATA, T. SHIBUYA, T. SHIINA, K. SUZUKI, T. TANI,<br />
K. YOKOYAMA<br />
Naka Fusion Energy Research Establishment,<br />
Department of Thermonuclear Fusion Research,<br />
Japan Atomic Energy Research Institute,<br />
Tokai-mura, Naka-gun, Ibaraki-ken, Japan<br />
Abstract<br />
ELECTRON CYCLOTRON HEATING OF LOWER HYBRID CURRENT DRIVEN PLASMA IN<br />
THE JFT-2M TOKAMAK.<br />
The second harmonic electron cyclotron heating of a lower hybrid current driven plasma has been<br />
investigated in the JFT-2M tokamak to evaluate its potential for optimizing RF current drive. It is<br />
observed that the extraordinary mode effectively couples to electrons at largely down shifted frequencies.<br />
From measuring the soft X-ray radiation parallel <strong>and</strong> perpendicular to the toroidal magnetic field,<br />
the existence of selective perpendicular heating of electrons with parallel velocities satisfying the<br />
relativistic cyclotron resonance condition is concluded. Initial results on 200 MHz fast wave experiments<br />
are also reported. It is observed that, in a discharge combined with electron cyclotron heating, the fast<br />
waves launched by a phased two loop antenna array couple to energetic electrons.<br />
1. INTRODUCTION<br />
Current drive by lower hybrid (LH) waves has been achieved in a number of<br />
tokamaks. These experiments have shown that the LH waves produce a current carrying<br />
fast electron tail. Recently, electron cyclotron heating (ECH) in the presence of<br />
a mildly relativistic electron tail has received a lot of interest, because of the need<br />
for supplementary heating <strong>and</strong> current profile control in high phase velocity RF current<br />
driven plasmas <strong>and</strong> because of possible improvements, using ECH, of the current<br />
drive by LH waves (LHCD) <strong>and</strong> electron cyclotron (EC) waves [1, 2].<br />
1 On leave from Mitsubishi Electric Corp., Japan.<br />
2 On leave from Mitsubishi Electric Computer System Corp., Tokyo, Japan.<br />
545
546 YAMAMOTO et al.<br />
rti<br />
o<br />
-o X<br />
", f, - - i<br />
QL<br />
1 1<br />
-<br />
-<br />
ib L<br />
p in q o p q q<br />
d<br />
d d d<br />
o<br />
o<br />
(A) *A +V Cfl'V) 303 I<br />
X<br />
00<br />
r-<br />
M<br />
X<br />
o<br />
J<br />
o<br />
-<br />
o §<br />
i—<br />
I-?<br />
3 1<br />
"I
<strong>IAEA</strong>-CN-47/F-II-5 547<br />
On the other h<strong>and</strong>, in a high temperature <strong>and</strong> density fusion plasma, LH waves<br />
can only drive a skin current since for a plasma with large f^./f£e the lower bound of<br />
the allowed parallel refractive index N, is restricted to relatively high values <strong>and</strong> the<br />
wave power is then absorbed near the plasma surface. Fast waves (FW) in the frequency<br />
range of fci < f0 < fLH(0) (fLH(0) is the maximum LH resonance frequency<br />
in the plasma) can, however, penetrate into the plasma core, even if the plasma is<br />
hot <strong>and</strong> dense. The current drive by fast waves (FWCD) is based on the same<br />
mechanism as LHCD, i.e. the current carrying electrons are accelerated through<br />
L<strong>and</strong>au damping; this mechanism is expected to be applicable to fusion plasmas.<br />
2. EXPERIMENTAL SET-UP<br />
The JFT-2M tokamak has a D-shaped vacuum vessel with a major radius of<br />
Ro = 1.31 m <strong>and</strong> a 0.415 m x 0.595 m minor cross-section [3]. The ECH system<br />
consists of two gyrotrons <strong>and</strong> two oversized waveguide transmission lines [4]. The<br />
RF power is generated by a Varian gyrotron capable of producing 200 kW at 60 GHz<br />
for up to 0.1 s. The extraordinary mode is radiated at an injection angle of 0 = 80°<br />
to the direction of the toroidal magnetic field from a conical horn antenna propagating<br />
the TEn mode. The horn antennas are placed outside the torus in the midplane. The<br />
LH waves are launched by a four waveguide array, which is fed by four 0.75 GHz<br />
klystrons. The phase difference between adjacent waveguides is set at 90°, <strong>and</strong> thus<br />
the Brambilla RF spectrum is concentrated between N, = 1 <strong>and</strong> 5. The fast wave<br />
system consists of a 200 MHz RF source capable of 100 kW for up to 0.1 s feeding<br />
to a phased two loop antenna array [5]. The RF power is divided into the two lines<br />
by a 3 dB hybrid coupler. The phase difference between the antennas, A$FW, is<br />
adjusted by a line stretcher. The impedance of each line is matched by using X/8<br />
double stub tuners.<br />
3. EXPERIMENTAL RESULTS<br />
3.1. Selective electron cyclotron heating<br />
Experiments with a radiated ECH power of PECH = 240 kW <strong>and</strong> a pulse width<br />
of td = 50 ms have been carried out to investigate the EC wave interaction with<br />
mildly relativistic electrons [6]. Figure l(a) shows the time evolution of the relevant<br />
plasma parameters during a typical shot with a central toroidal magnetic field at<br />
which no cyclotron resonance layer lies in the plasma column (B, = 1.4 T, corresponding<br />
to fo/(2fcO) = 0.76). For this discharge, the target plasma has a<br />
D-shaped cross-section (a = 0.34 m, b = 0.46 m) <strong>and</strong> the plasma current Ip kept<br />
constant by feedback control. With application of ECH power during the LH pulse,<br />
noticeable increases in A = /3p + f/2-1, in the stored plasma energy, W DIA , <strong>and</strong> in
548<br />
YAMAMOTO et al.<br />
the EC emissions, IECE, are observed, with no increase in the line averaged electron<br />
density ne, as is shown in Fig. 1. The value of A is evaluated from a pqloidal magnetic<br />
field fitting code, <strong>and</strong> W DIA is estimated from the diamagnetic measurement,<br />
assuming isotropic pressure of the plasma.<br />
The Bt dependence of the change in the relevant plasma parameters is shown<br />
in Figs l(b) <strong>and</strong> (c). Figure l(b) shows the absorbed ECH power, Pab, <strong>and</strong> the<br />
increase, AW DIA , due to ECH. The value of Pab is estimated from dAW DIA /dt at the<br />
initiation of the ECH pulse. The experimental conditions are the same as in Fig. l(a),<br />
except for the toroidal magnetic field. It is found that Pab <strong>and</strong> AW DIA have a peak<br />
around Bt = 1.07 T (corresponding to fo/(2fcO) = 1.0) <strong>and</strong> increase with Bt for<br />
B, > 1.25 T. Figure l(c) shows the changes in A, /3° IA <strong>and</strong> |3pl + £; as a function<br />
of the toroidal magnetic field, where (i° 1A is the perpendicular component estimated<br />
from the diamagnetic measurement, <strong>and</strong> |3p, + ^ is obtained from the relation<br />
AA = A (|8 , + fj )/2. Most of AA is likely to result from the enhanced Pp, since<br />
the change in lv during the ECH pulse duration of 50 ms, which is much shorter than<br />
the current diffusion time, tdiff > 1 s, can be neglected. For B, = 1.07 T, A/?* is<br />
found to be approximately equal to A/3p,, while AjS^ is about six times as large as<br />
Aj8pn for Bt = 1.4 T. This result demonstrates selective perpendicular heating of the<br />
fast electrons for Bt = 1.4 T. Therefore, taking account of anisotropic plasma pressure,<br />
we obtain Pab = 37 kW <strong>and</strong> a resulting absorption efficiency of r)ab = Pab/<br />
PECH = 0.15 atB, = 1.4 T.<br />
Figures 2(a), (b) <strong>and</strong> (c) show the time evolution of the soft X-ray photon counts<br />
integrated over different energy ranges for three viewing angles, 0SX = 0°, 90° <strong>and</strong><br />
180°, respectively, at Bt = 1.34 T. The X-ray radiation parallel (0SX = 0°) <strong>and</strong> perpendicular<br />
(0SX = 90°) to the magnetic field is measured simultaneously by two<br />
0.4 0.5 0.6 0.7 0.8 0.9 0.4 0.5 0.6 0.7 0.8 0.9 0.4 0.5 0.6 0.7 0.8 0.9<br />
TIME (s)<br />
FIG. 2. Time evolution of soft X-ray photon counts integrated over different energy ranges for three<br />
different viewing angles: (a) 0K = 0°, (b) 6SX = 90°, (c) 6SX = 180°. B, = 1.34 T, Ip = 100 kA,<br />
ne = 2 x 10 18 nr 3 , PLH = 100 kW, PECH = 100 kW.<br />
(c)
<strong>IAEA</strong>-CN-47/F-II-S 549<br />
intrinsic germanium detectors with pulse height analyser systems. The forwardbackward<br />
(0SX = 180°) radiation is also measured by changing the direction of the<br />
plasma current. It is seen that ECH produces remarkable enhancement of the perpendicular<br />
radiation, appreciable increase in the backward radiation <strong>and</strong> a little decrease<br />
in the forward radiation. This result indicates selective EC perpendicular heating of<br />
the energetic electrons but no enhanced absorption efficiency of the LH power, which<br />
is consistent with the magnetic measurement mentioned above. The noticeable<br />
increase in the photon counts in the backward radiation as well as the decrease in the<br />
low energy component in the forward radiation during the ECH pulse suggests the<br />
generation of an inverse electric field, which decelerates the current carrying electrons<br />
<strong>and</strong> produces a backward stream of fast electrons. It is noted that an additional<br />
current drive generates the inductive electric field. From the energy spectra obtained<br />
from the data shown in Figs 2(a) to (c) we can infer enhancement of the fast electrons<br />
having an energy of ~ 100 keV, which satisfies the relativistic EC resonance condition<br />
at the plasma centre.<br />
Meanwhile, the Fisch <strong>and</strong> Boozer formula [7] predicts that the selective ECH<br />
of fast electrons yields an additional current drive due to an asymmetric plasma<br />
resistivity effect with high efficiency. From the calculation under the experimental<br />
conditions as shown in Fig. l(a) [6], 90 kA of additional driven current, IECH, concentrated<br />
around the plasma centre <strong>and</strong> 28 kW of absorbed ECH power in a single<br />
path are expected. Specifically, the current drive efficiency is rjCD = IECH/Pab = 3.2<br />
(A- W" 1 )- No appreciable additional current drive has, however, been observed<br />
from the measurement of the loop voltage. The reason for this could be that the pulse<br />
width of ECH has no sufficient duration for the inductive electric field to diffuse to<br />
the plasma surface.<br />
3.2. Current drive by fast waves<br />
In this section, initial experimental results using a 200 MHz fast wave are<br />
presented. Figure 3(a) shows the time behaviour of the relevant plasma parameters<br />
for two typical discharge shots at ne = 1.5 X 10 19 m 3 <strong>and</strong> Bt = 1.32 T. The solid<br />
line indicates the result of FW combined with ECH, <strong>and</strong> the dashed line represents<br />
the result of independent application of ECH <strong>and</strong> FW pulses in a shot. The radiated<br />
ECH <strong>and</strong> FW powers are PECH = 100 kW <strong>and</strong> PFW = 40 kW, respectively. The<br />
value of A&PW is set at 135°, <strong>and</strong> the RF spectrum of the fast waves is thus calculated<br />
to have a mild peak around N, = 3 in the direction of the current carrying<br />
electron drift. The working gas is deuterium, <strong>and</strong> the plasma current is kept constant<br />
at Ip = 200 kA. The present plasma parameters yield 1.1-5 for the accessible N, at<br />
the plasma centre <strong>and</strong> r/a = 0.9 for the radial position of the LH resonance layer at<br />
200 MHz. The combination of ECH <strong>and</strong> FW pulses is seen to make an appreciable<br />
increase in the EC emissions with frequencies of 50.4 GHz <strong>and</strong> 78.4 GHz, which correspond<br />
to fr/(2fc0) = 0.68 <strong>and</strong> 1.06, respectively. Note that the emission at<br />
50.4 GHz comes from non-thermal electrons since 50.4 GHz is not the electron
550 YAMAMOTO et al.<br />
1.5<br />
0.5<br />
(a)<br />
10 -<br />
0<br />
0.5 -<br />
_—<br />
" ) •<br />
fr=50.4GHz"<br />
fr=78.4GiHz<br />
1.0 = = -.<br />
FW<br />
f ECH |<br />
0.7 0.8 0.9<br />
TIME (si<br />
1<br />
-<br />
~io 2<br />
to<br />
(b)<br />
to 2 -<br />
• *—\-' 1<br />
1<br />
-t-<br />
10<br />
t 1<br />
1 1<br />
OH + ECH<br />
Te«=57keV<br />
"' '-t- ~~^-<br />
OH + ECH+FW<br />
Teff=80keV<br />
t 1<br />
20 40 60 80 100<br />
PHOTON ENERGY (keV ]<br />
FIG. 3(a). Time evolution of relevant plasma parameters with <strong>and</strong> without (solid <strong>and</strong> dashed lines) FW<br />
power of 40 kW during ECH pulse. B, = 1.32 T, lp = 200 kA, PECH = 90 kW; (b) energy spectra of<br />
soft X-rays without <strong>and</strong> with (upper <strong>and</strong> bottom) FW power during ECH pulse. Experimental conditions<br />
are the same as in Fig. 3(a).<br />
cyclotron frequency in the plasma. The emission in the extraordinary mode was<br />
measured in the horizontal direction with a calibrated heterodyne receiver. A little<br />
increase in the loop voltage is also seen during the FW pulse, in both shots. At the<br />
same time, an increase in the line intensity of metal impurities was observed.<br />
We have also measured the soft X-ray radiation under the same conditions as<br />
those of Fig. 3(a). The measured energy spectra of the forward radiation with <strong>and</strong><br />
without FW pulse during the ECH pulse are shown in Fig. 3(b). The spectrum is time<br />
averaged over the duration of the FW pulse <strong>and</strong> is superposed for two identical discharges.<br />
From this figure, we conclude that energetic electrons exist in the plasma<br />
<strong>and</strong> the application of the FW pulse leads to a noticeable increase in the electron tail<br />
in the range of 40 to 100 keV.<br />
The observed results indicate an appreciable interaction of fast waves <strong>and</strong> energetic<br />
electrons, leading to current drive at higher density. No indication of FWCD<br />
has, however, been obtained from measuring the loop voltage. The reason for this<br />
could be that the RF power <strong>and</strong> the shape of the RF spectrum are not sufficient to<br />
overcome the increase in loop voltage due to enhanced impurity flux. From the calculation<br />
[8], a driven current less than 10 kA is predicted in the present experimental<br />
conditions assuming 1 % of the fraction of the energetic electrons with a temperature<br />
of 40 keV. This would, by itself, result in a relative drop of the loop voltage of only<br />
a few per cent.
4. SUMMARY<br />
<strong>IAEA</strong>-CN-47/F-H-5 551<br />
The experimental results can be summarized as follows:<br />
(1) An absorption efficiency of i?ab = 0.15 of the ECH power is obtained at a<br />
largely down shifted cyclotron frequency of fo/(2fcO) = 0.76, when ECH is<br />
applied into an LH current driven plasma.<br />
(2) The measurement of the soft X-ray radiation parallel <strong>and</strong> perpendicular to the<br />
magnetic field demonstrates selective electron cyclotron perpendicular heating<br />
of the fast electrons, generated by the LH waves, with the parallel velocity satisfying<br />
the relativistic resonance condition.<br />
(3) It is observed from the measurements of the electron cyclotron emission <strong>and</strong> the<br />
soft X-ray radiation that the 200 MHz fast waves launched from the phased two<br />
loop antennas interact with the energetic electrons — in contrast to the LH<br />
waves, at high densities.<br />
ACKNOWLEDGEMENTS<br />
The authors are grateful to Drs M. Tanaka, K. Tomabechi, <strong>and</strong> S. Mori for continuous<br />
encouragement, <strong>and</strong> to Dr. J.-M. Noterdaeme for fruitful discussions.<br />
REFERENCES<br />
[1] FIDONE, I., et al., in Heating in Toroidal Plasmas (Proc. 4th Int. Symp. Rome, 1984),<br />
Vol. 2, Int. School of Plasma Physics, Varenna (1984) 872.<br />
[2] KRIVENSKI, V., et al., Nucl. Fusion 25 (1985) 127.<br />
[3] SHOJI, T., et al., in Controlled Fusion <strong>and</strong> Plasma Physics (Proc. 11th Europ. Conf. Aachen,<br />
1983), Vol. 1, European Physical Society (1983) 55.<br />
[4] HOSHINO, K., et al., Design Concepts <strong>and</strong> Performance Tests of the 60 GHz Electron Cyclotron<br />
Heating (ECH) System for the JFT-2M Tokamak, Rep. JAERI-M-85-169, Japan Atomic Energy<br />
Research Institute, Tokyo (1985).<br />
[5] UESUGI, Y., et al., Coupling to Fast Waves via a Phased Loop Antenna Array for Fast Wave<br />
Current Drive in the JFT-2M Tokamak, Rep. JAERI-M-86-103, Japan Atomic Energy Research<br />
Institute, Tokyo (1986).<br />
[6] YAMAMOTO, T., et al., in Controlled Fusion <strong>and</strong> Plasma Heating (Proc. 13th Europ. Conf.<br />
Schliersee, 1986), Vol. 10 C, Part II, European Physical Society (1986) 437.<br />
[7] FISCH, N.J., BOOZER, A.H., Phys. Rev. Lett. 45 (1980) 720.<br />
[8] YAMAMOTO, T., et al., Numerical Study of the Electron Heating <strong>and</strong> Current Drive by the<br />
Fast Waves, Rep. JAERI-M-86-115, Japan Atomic Energy Research Institute, Tokyo (1986).<br />
DISCUSSION<br />
M. PORKOLAB: It appears to me that in Fig. 3(a), showing combined<br />
ECH/FW pulses, the loop voltage increases when the fast wave is applied. This is
552 YAMAMOTO et al.<br />
perhaps due, as you say, to impurity injection. If so, the increased DC electric field<br />
in the plasma could enhance the electron tail <strong>and</strong> hence the ECH emission, rather than<br />
the fast wave. In view of this, I am not certain that you have really demonstrated FW<br />
current drive.<br />
T. YAMAMOTO: It can be seen in Fig. 3(a) that the ECE does not increase,<br />
even when the loop voltage increases during the ECH pulse alone. In addition, no<br />
increase in ECE accompanied by an increase in the loop voltage has been observed<br />
when the FW power is applied to the plasma with n :£ 1 x 10 19 nr 3 . These results<br />
indicate that the increase in the ECE stems from FW heating <strong>and</strong> not from the<br />
increase in the loop voltage.<br />
No FW current drive has been observed from the measurement of the loop voltage.<br />
We have observed appreciable interaction between fast waves <strong>and</strong> fast electrons,<br />
which would lead to FW current drive.<br />
T. CHO: During ECH, it is reasonable to expect the perpendicular soft X-rays<br />
to increase, since the lobe of the X-ray inclines in the electron accelerated direction<br />
owing to the relativistic effect. However, because of this relativistic effect, the X-ray<br />
emission parallel to the magnetic field should be increased by LH current drive alone<br />
in the energy range of the quasi-linear L<strong>and</strong>au-damped resonant particles. How<br />
would you interpret the only slight change in the X-ray emission parallel to the magnetic<br />
field during slow-wave LHCD with the parallel refractive index Ns = 2?<br />
T. YAMAMOTO: In the present discharge, the target plasma already includes<br />
many runaway electrons <strong>and</strong> most of the soft X-ray radiation comes from these.<br />
When LH power is applied to the plasma, the LH current drive causes a drop in the<br />
loop voltage which reduces the production rate of the runaway electrons, while the<br />
LH waves accelerate the resonant electrons. As a result, the amount of runaway electrons<br />
does not change. Thus, the LH pulse does not contribute to an appreciable<br />
enhancement of the soft X-ray radiation. In the case of a discharge which includes<br />
a few fast electrons, a remarkable increase in soft X-ray radiation has been observed.
<strong>IAEA</strong>-CN-47/F-II-6<br />
ELECTRON CYCLOTRON AND<br />
LOWER HYBRID CURRENT DRIVE EXPERIMENTS<br />
IN THE WT-2 AND WT-3 TOKAMAKS<br />
S. TANAKA, Y. TERUMICHI, T. MAEKAWA,<br />
M. NAKAMURA 1 , T. CHO 2 , A. ANDO, K. OGURA,<br />
H. TANAKA, M. IIDA, S. IDE, K. OHO, S. OZAKI,<br />
R. ITATANI 3 , H. ABE 3 , Y. YASAKA 3 , M. FUKAO 3 ,<br />
K. ISHII 3 , A. MOHRI 4 , S. KUBO 4<br />
Department of Physics, Faculty of Science,<br />
Kyoto University, Kyoto,<br />
Japan<br />
Abstract<br />
ELECTRON CYCLOTRON AND LOWER HYBRID CURRENT DRIVE EXPERIMENTS IN THE<br />
WT-2 AND WT-3 TOKAMAKS.<br />
An electron cyclotron (EC) driven current is generated in two types of toroidal plasmas: an<br />
ohmically heated (OH) plasma <strong>and</strong> a lower hybrid (LH) driven current sustained plasma. In the former<br />
case, by injecting microwave PEC near the EC frequency into an OH plasma, after OH power has been<br />
shut off in the WT-2 tokamak, the plasma current is sustained <strong>and</strong> ramped up by the EC wave only,<br />
without OH power. Here, the EC driven current is generated by EC heating of suprathermal electron<br />
beam in the OH plasma. In the latter case, when PEC is injected into the LH driven current sustained<br />
plasma, the plasma current Ip <strong>and</strong> its ramp-up rate increase, <strong>and</strong> the increased Ip is kept after PEC is<br />
shut off. Here, the EC driven current is generated by EC heating of the mildly relativistic electrons in<br />
the LH driven plasma. On the other h<strong>and</strong>, the current Ip <strong>and</strong> its ramp-up rate decrease when the bulk<br />
electrons are EC heated. This selective EC heating of the bulk or the mildly relativistic electrons is<br />
performed by changing the radial position of EC resonance layer in the plasma column. Further, the<br />
electron beam (EB) is injected by using the plasma anode method. EB injection into a currentless ECR<br />
plasma forms a toroidal current, which is nine times the injected beam current.<br />
1. INTRODUCTION<br />
Recently, experiments on non-inductive current drive (CD) have shown that the<br />
plasma current is started up, ramped up <strong>and</strong> sustained by the LH wave in many<br />
tokamaks [1]. Meanwhile, other non-inductive CD methods have been suggested<br />
theoretically. Fisch et al. [2] have predicted that the plasma current can be produced<br />
by quasi-linear cyclotron damping of the EC wave. This current drive, ECCD, is<br />
achieved by creating an asymmetric electron distribution function along the field,<br />
Osaka Institute of Technology, Osaka, Japan.<br />
2<br />
Plasma Research Center, University of Tsukuba, Tsukul Ibaraki, Japan.<br />
3<br />
Faculty of Engineering, Kyoto University, Kyi Kyoto, Japan.<br />
Institute of Plasma Physics, Nagoya University, Nagoya, Japan.<br />
553
554 TANAKA et al.<br />
whose mechanism is quite different from LHCD. Here, we report on experiments in<br />
the WT-2 tokamak, in which the plasma is sustained by the EC driven current only,<br />
without OH power. Furthermore, the plasma current is produced by EC heating of<br />
the mildly relativistic electron beam present in the LH driven current sustained<br />
plasma. In addition, an experiment on plasma current drive by injection of an electron<br />
beam is presented.<br />
The WT-2 tokamak has an aluminium shell <strong>and</strong> an iron core, major <strong>and</strong> minor<br />
radii of RQ = 40 <strong>and</strong> a = 9 cm, respectively, a toroidal field of BT < 15 kG, <strong>and</strong><br />
a plasma current of Ip < 30 kA [3,4]. A microwave from a gyrotron<br />
(W/2TT = 35.6 GHz, PEC < 120 kW, pulse width t < 10 ms) is fed from the low<br />
field side through circular waveguides to a Vlasov antenna with parabola reflector<br />
placed along the major radius. By rotating the antenna around the guide axis, a<br />
linearly polarized electromagnetic wave (EMW), propagating parallel or antiparallel<br />
to the field BT with an angle of ±48° to BT, is emitted as the extraordinary<br />
(X) mode. To achieve LHCD, RF from a magnetron (0.915 GHz, PLH < 100 kW,<br />
t < 20 ms) is launched into the plasma with a phased array of four waveguides (inner<br />
dimension, 13 X 185 mm 2 ).<br />
The operation of the new toroidal machine WT-3 (R = 65 cm, a = 22 cm <strong>and</strong><br />
BT = 1.7 T) was started in June 1986 for a study of RF heating <strong>and</strong> current drive.<br />
The RF sources are 200 kW, 56 GHz for ECH <strong>and</strong> 350 kW, 2 GHz for LHH <strong>and</strong><br />
500 kW, 12-30 MHz for ICH.<br />
2. ELECTRON CYCLOTRON CURRENT DRIVE AFTER OH PLASMA [5]<br />
In Figs l(a) to (g), the temporal evolution of plasma parameters with <strong>and</strong><br />
without PEC is plotted. First, a low density slide-away discharge (dotted curves)<br />
with bulk electron density % = 2 x 10 12 cm" 3 <strong>and</strong> temperature Te = 70 eV, is<br />
produced by an OH discharge with EC resonance preionization. When PEC is<br />
injected after the primary voltage V, of OH transformer has been short-circuited,<br />
the plasma parameters change drastically, <strong>and</strong> the constant plasma current Ip<br />
continues to flow with a loop voltage of VL = 0 as long as PEC is applied (full<br />
curves). The data show that the plasma is sustained by the EC driven current only<br />
since no OH current flows for VL = 0. It is noticeable that in this ECCD plasma<br />
strong hard X-ray IHX appears <strong>and</strong> both the soft X-ray Isx (0.85 keV) <strong>and</strong> the second<br />
electron cyclotron emission L. (68 GHz) increase to more than ten times the values<br />
in the OH plasma. The result suggests that a suprathermal electron beam carrying the<br />
EC driven current is generated. After PEC has been turned off, VL changes abruptly<br />
to a positive value, <strong>and</strong> Ip falls off in a short time. Here, IHX increases strongly,<br />
suggesting that the suprathermal electrons are accelerated by the positive VL. On the<br />
other h<strong>and</strong>, the pyroelectric signal Ipyro <strong>and</strong> the light intensity of impurity line<br />
IL (O II - O V) decrease gradually, suggesting that the temperature of bulk<br />
electrons is nearly the same as that in OH plasma.
10 20<br />
Time (ms)<br />
<strong>IAEA</strong>-CN-47/F-II-6 555<br />
10 20<br />
Time (ms)<br />
F/G. /. Temporal evolution of (a) loop voltage VL, (b) plasma current Ip, (c) electron density he,<br />
(d) hard X-ray emission IHX (20 keV), (e) soft X-ray Isx (0.85 keV), (f) electron cyclotron emission lf<br />
(68 GHz), <strong>and</strong> (g) pyroelectric signal lpyro. Full curves are with ECHpower, Pec (parallel injection)<br />
<strong>and</strong> dotted curves without PEC. p<br />
injection of PEC, BT = 12 kG.<br />
= 2 x 10 torr in H2, additional gas comes from puffing during<br />
0 50 100 150<br />
Photon Energy(keV)<br />
•(c)/<br />
: /<br />
40<br />
PECH (kW)<br />
V ~> ECH<br />
OFF:<br />
8 12<br />
Time(ms)<br />
L- "<br />
FIG. 2. (a) X-ray energy spectra emitted from plasma as shown in Fig. I, during: (1) time t = 0-5 ms<br />
(startup stage), (2) t = 5-10 ms (OHstage) <strong>and</strong> (3) t = 70-75 mi (ECCD stage); (b) (1) loop voltage<br />
VL <strong>and</strong> (2) ramp-up rate as a function ofPEC; (c) EC driven current ramp-up, flat-top <strong>and</strong> decrease for<br />
(1) PEC = 70 kW, (2) 50 kW, (3) 30 kW.<br />
16
556 TANAKA et al.<br />
The X-ray energy spectra emitted from ECCD as well as OH plasmas are<br />
measured, <strong>and</strong> plotted in Fig. 2(a). The slope of the X-ray spectrum is about 15 keV,<br />
<strong>and</strong> the energy extends to 150 keV in the ECCD plasma. Thus, it is concluded that<br />
in the ECCD plasma the electrons are composed of bulk electrons with<br />
Te ~ 70 eV, fie ~ 0.5 x 10 12 cm" 3 <strong>and</strong> suprathermal electrons with<br />
Te ~ 15 keV, n,, ~ 10 10 cm" 3 , which are carrying Ip ~ 3 kA. In addition, the fact<br />
that SX-rays up to 100 keV are emitted from the initial OH plasma suggests that<br />
weakly suprathermal electrons are present <strong>and</strong> are necessary for the formation of<br />
ECCD plasma.<br />
As PEc increases, the current Ip due to ECCD changes from a decreasing<br />
curve to flat-top <strong>and</strong> then to ramp-up as is shown in Figs 2(b) <strong>and</strong> (c).<br />
Correspondingly, the voltage VL changes from a positive value to a negative one.<br />
This behaviour shows that Ip is fully sustained by ECW. These flat-top discharges<br />
due to ECCD, without OH power, are also obtained in WT-3, where Ip = 10 kA<br />
for ne ~ 10 12 cm" 3 , BT = 1.6 T, <strong>and</strong> PEC = 70 kW.<br />
The effect of ECH is examined for various BT <strong>and</strong> ECW injection methods.<br />
The flat-top or ramp-up discharge is obtained when the ECR layer is located on the<br />
inner side of the torus. Inefficient ECCD under strong BT may correspond to the<br />
theoretical prediction that the EC heated electrons become trapped on the outer side<br />
of the torus. The ECCD efficiency with ECW, propagating parallel to the electron<br />
drift, is better than that with ECW, propagating antiparallel or perpendicular to BT,<br />
<strong>and</strong> ramp-up discharges are only formed in the former case. Radial profiles of Isx<br />
have rather broad peaks near the plasma centre, <strong>and</strong> fie at peaks is somewhat<br />
smaller than co. It is concluded that plasma current is generated by EC heating of the<br />
suprathermal electron beam formed in the initial OH plasma. Such a unidirectional<br />
electron beam may eliminate the cancelling effect of EC driven current on the<br />
opposite side.<br />
The above mentioned ECCD mechanism is also demonstrated in the microwave<br />
discharge at ECR in WT-2, where a weak current Ip is generated [6]. Here, the<br />
toroidal drift of electrons circulating in one direction is cancelled by superposing a<br />
vertical field Bv, <strong>and</strong> an electron beam is formed. The EC driven current is<br />
generated in the direction determined by Bv, independent of the propagation<br />
direction of ECW.<br />
3. ELECTRON CYCLOTRON CURRENT DRIVE IN RF TOKAMAK [7]<br />
In contrast to the OH plasma, in the LHCD plasma, high energy electrons in<br />
the mildly relativistic range, which carry the current Ip, are produced. Highly efficient<br />
ECCD is expected in the LHCD plasma, since ECW is strongly absorbed by<br />
such high energy electrons <strong>and</strong> their collisionality decreases further. As shown in the<br />
dotted curves in Figs 3(a) to (k), when PLH is injected into an initial ECR plasma,<br />
the current Ip starts up rapidly <strong>and</strong> attains Ip = 4 kA at the end of PLH <strong>and</strong> the
10 20 30<br />
Time (ms)<br />
<strong>IAEA</strong>-CN-47/F-II-6 557<br />
^50 n ECHJ |<br />
~ 0<br />
£50 1 LHH ' ' 1 '<br />
is 2<br />
a<br />
(IIO)I (IDO)I<br />
I ><br />
S 2<br />
CD _•<br />
3.<br />
><br />
O<br />
f J l (9) "<br />
pj^v^ Hi<br />
(j)<br />
(k)<br />
10 20 30<br />
Time (ms)<br />
FIG. 3. Temporal evolution of (a) plasma current Ip, (b) loop voltage VL, (c) electron density ne,<br />
(d) electron cyclotron emission 1^, (e) <strong>and</strong> (f) soft X-ray emission Isx, (g) pyroelectric detector signal<br />
Ipyro, <strong>and</strong> (h) to(k) impurity line radiations O II, III, IV, V, respectively. Full curves are with PEC <strong>and</strong><br />
dotted curves without PEC. The ECR layer is set at r = rECR = +8.2 to +6.3 cm, changing during<br />
ECHpulse according to BT change in time (BT0 = 15.3-14.7kG at r - 0 cm), PEC = 80 kW, <strong>and</strong><br />
P LH ~ 48 kW. p = 6 x 10' s ton in H2; additional gas comes from puffing during P^.<br />
r (cm)<br />
0 50 100 150 200<br />
Photon Energy (keV)<br />
Hi<br />
c<br />
UJ<br />
!0 J P<br />
TJ 10':<br />
in '<br />
LU<br />
'• 1 /^
558 TANAKA et al.<br />
tokamak plasma is formed by RF power alone, without Ohmic heating power<br />
(so-called RF tokamak [8]). When PEC is applied to the RF tokamak plasma the<br />
ramp-up rate of current, AIp/At, increases <strong>and</strong> Ip attains a value higher than that<br />
without PEC (solid curve) after termination of the PEc pulse. This increment of Ip is<br />
ascribed to the EC driven current <strong>and</strong> the voltage VL, the direction of which is<br />
opposed to that of electron drift, increases in proportion to AIp/At. The electron<br />
density ne remains constant. The X-ray emission Isx (0.85 keV), IHX <strong>and</strong> nonthermal<br />
ECE 1^ increase drastically during ECH, while Ipyr0, Isx (0.2 keV) <strong>and</strong> IL<br />
(O II-O V) do not change or even decrease slightly. The results suggest that high<br />
energy electrons are generated by ECH although there is no effect on the bulk<br />
electrons.<br />
Measurements show that this EC driven current is generated <strong>and</strong> the emissions<br />
I,, <strong>and</strong> Isx (0.85 keV) increase strongly when BT is strong <strong>and</strong> the ECR layer<br />
(w = 0e) is on the outer side of the torus (rECR 5: 5 cm). In Fig. 4(a) the radial profile<br />
of Isx (0.2 keV) is plotted, which is very similar to the density profile of the<br />
bulk electrons. The radial profiles of Isx (0.85 keV) <strong>and</strong> IHX (20 keV), representing<br />
the profile of high energy electrons, show peaks on the high field side of the ECR<br />
layer. When ECH is applied to the RF tokamak, both Isx (0.85 keV) <strong>and</strong> IHX<br />
(20 keV) increase drastically near the peaks of their profiles without PEC, while<br />
there is no change of Isx (0.2 keV). Here, the ECR layer is on the outer side of<br />
plasma (rECR = 0.3 a), <strong>and</strong> the radial position of the peaks of Isx (0.85 keV) <strong>and</strong><br />
IHX is not at the ECR layer, but is shifted slightly towards the high field side, where<br />
Oce = 1.07 co.<br />
In the RF tokamak, high energy electrons are present, <strong>and</strong> strong X-rays up to<br />
300 keV are emitted. The energy spectrum is composed of the steep slope part<br />
(—15 keV) in the low energy range <strong>and</strong> the gentle slope part (~45 keV) in the high<br />
energy range as is shown in Fig. 4(d) [9]. When PEC is injected, the X-ray emission<br />
increases by a factor of three in the high energy range of 20-200 keV, while there<br />
is no change below 20 keV. Considering the relativistic effect <strong>and</strong> the Doppler shift,<br />
the ECR condition is given by<br />
1 - (N,v,)/c = (O» {1 - (v? + v 2 ±)/c 2 }*<br />
As the electron density increases, the relativistic effect dominates the Doppler shift<br />
<strong>and</strong> resonance occurs at fle/co > 1, even if N|/V| > 0. A calculation shows that in<br />
the field region of 0e/a> = 1.07 ± 0.05 the energy of the resonant electrons is<br />
20-150 keV for N, = 0.23 ± 0.1 <strong>and</strong> 2-50 keV for N, = - (0.23 + 0.1), where<br />
v 2 = 2v 2 | is assumed (Fig. 4(e)). It is concluded that mildly relativistic electrons<br />
generated by LHW <strong>and</strong> drifting along one direction of BT are accelerated efficiently<br />
in the perpendicular direction by ECW, then these electrons become more collisionless<br />
<strong>and</strong> carry the EC driven current efficiently. The collision time of electrons of<br />
50 keV is about 60 ms (fie = 2 x 10 !2 cm" 3 , Zeff = 2) <strong>and</strong> much longer than the<br />
ECH pulse. Thus, in Fig. 4(d), the enhancement of X-ray emission due to PEC in
~ 0<br />
£50<br />
4<br />
<<br />
i 2<br />
a<br />
0<br />
g- 0<br />
ECH|<br />
(d)<br />
(e)<br />
10 20 30<br />
Ti me (ms)<br />
<strong>IAEA</strong>-CN-47/F-II-6 559<br />
3 50<br />
~ 0<br />
CL50<br />
B<br />
o<br />
5 ><br />
co O<br />
LHH<br />
v(i)<br />
0 10 20 30 40<br />
Time ( ms)<br />
FIG. 5. Temporal evolution of plasma parameters as in Fig. 3. Here, ECR layer is set at<br />
r = r ECR = ~ 2 -0 to -4.8 cm (BT0 = 12.1-11.2 kG).<br />
the high energy range is maintained after PEC has been switched off. Correspondingly,<br />
the increased current Ip due to ECCD does not decay after PEC has been<br />
switched off in Fig. 3(a).<br />
The change of Ip due to ECCD in RF tokamak is measured for various BT.<br />
When BT is weak <strong>and</strong> the ECR layer is located on the inner side (rECR = -0.3 a),<br />
the effects of ECH are quite different from those observed in Fig. 3. During the PEC<br />
pulse, Ip continues to decrease, AIp/At becomes negative, <strong>and</strong> Ip is smaller than the<br />
dotted values after termination of PEC in Fig. 5(a). The loop voltage VL is zero or<br />
slightly positive. The electron density n,. increases. The increment of IM (68 GHz)<br />
<strong>and</strong> Isx (0.85 keV) is small, but Isx (0.2 keV) <strong>and</strong> Ipyr0 increase strongly during PEC.<br />
The line intensities of low excitation energy (O II, O III) do not change or even<br />
decrease slightly compared with the dotted curves, in spite of the increase of n,,, but<br />
curves of high energy (O IV, O V) increase strongly. It is roughly estimated that the<br />
bulk electron temperature increases from 20 to 70 eV by comparing the line intensities<br />
with those of no ECH. This behaviour suggests that the heating of bulk electrons<br />
occurs at Ue/u * 1 <strong>and</strong> no high energy electrons are produced. The dependence of<br />
Ip due to ECCD on BT is similar for various methods of PEC injection: parallel,<br />
antiparallel, perpendicular <strong>and</strong> top injection although the absolute value of AIp/At is<br />
different. The reason why the LH driven current Ip decreases during bulk electron<br />
heating is unknown although it may be ascribed to an enhancement of return current.
560 TANAKA et al.<br />
4. EFFICIENCY OF ECCD<br />
In the ECR plasma, the dependence of EC driven current Ip on PEC <strong>and</strong><br />
rij. is investigated, <strong>and</strong> the relation, Ip = ^PEC/I^R, is demonstrated experimentally.<br />
Then, the figure of merit of ECCD is obtained as 17 = 1.2 x 10 ~ 3<br />
(10 19 m~ 2 kA-kW" 1 ). Furthermore, by using the experimental data of the flat-top<br />
discharge due to ECCD after OH plasma in Fig. 2(c), the efficiency is calculated to<br />
be r\ » 1 x 10 ~ 3 . These values are small, compared with r) « 6 x 10" 2 for<br />
LHCD in WT-2 [10]. The experimental value of 77 obtained from the flat-top<br />
discharge due to ECCD is calculated to be 17 = 0.8 X 10" 2 , while 17 ~ 1 x 10"'<br />
for LHCD (Ip « 45 kA, PLH = 100 kW, ne = 2.6 x 10 12 cm' 3 ) in WT-3.<br />
According to the quasi-linear theory of ECCD, the efficiency is given by<br />
r) = 0.306 (j/p) (Te/10 keV)/ln A. The expression for normalized efficiency (j/p) is<br />
given by Fisch et al. [2] <strong>and</strong> Cordey et al. [11]. Substituting the experimental values<br />
of resonant electrons, Te supra = 15 keV, <strong>and</strong> the bulk electrons, Te = 70 eV, we<br />
obtain 77 = 2 x 10~\ which is two orders larger than for the experimental values<br />
of WT-2.<br />
Next, the efficiency of ECCD is examined for RF tokamak. In Fig. 6 is plotted<br />
the ramp-up rate AIp/At as a function of PRF (PLH or PEC). For the RF tokamak<br />
discharge (PEC = 0), as PLH increases the ramp-up rate increases at first, then<br />
attains a constant value (curve 1). When a constant PEC is superposed, the ramp-up<br />
rate increases with PLH (curve 2) <strong>and</strong> exceeds that with PEC = 0. When the RF<br />
tokamak is sustained by a constant PLH, the current ramp-up rate increases with PEC<br />
<strong>and</strong> attains a constant value (curve 3). Unfortunately, the present pulse of PEC is too<br />
short for Ip to attain a quasi-stationary state. If it is assumed that the change of the<br />
ramp-up rate with respect to PRF, d(AIp/At)/dPRF, is proportional to the efficiency<br />
of RFCD, i7RF, then both rjEC with a constant PLH <strong>and</strong> TJLH with a constant PEC<br />
kA/ms)<br />
<<br />
a.<br />
<<br />
0.2<br />
O.V<br />
c<br />
(2) -^.<br />
(1)-^<br />
(3).<br />
- - "<br />
•<br />
A<br />
4 8<br />
W /<br />
FIG. 6. Ramp-up rate as a junction ofPRF<br />
<strong>and</strong> (3) Pw = 60 kW; BT = 15 kG.<br />
e<br />
20<br />
f<br />
p<br />
RF<br />
40<br />
( kW)<br />
60<br />
in the cases of(l) PEC = 0, (2) PEC = 62 kW
<strong>IAEA</strong>-CN-47/F-II-6 561<br />
are nearly equal to rjLH without PEC in the unsaturated region. It is suggested<br />
theoretically that<br />
~ (3/4) {1 +(v/2vll) 2 }- 1 ~ 1<br />
which is consistent with the experimental results. As has been noted, when PEC is<br />
superposed on the RF tokamak, the ramp-up rate exceeds that for PHL alone. Such<br />
an enhancement of LHCD efficiency combined with ECH is consistent with the<br />
theoretical predictions by Fidone et al. [12].<br />
5. CURRENT DRIVE BY INJECTION OF ELECTRON BEAM [13]<br />
By the plasma anode method, an electron beam (EB) is injected into a currentless<br />
ECR plasma in WT-2. The peak current of EB is Ik = 0.46 kA, <strong>and</strong> the pulse<br />
width is 5 ms. The energy of EB decreases from 2 to 0.4 keV during the pulse. The<br />
plasma current Ip reaches 4 kA at 0.7 ms after EB injection. Here, the current<br />
amplification ratio Ip/Ik is about 9 at this peak. When EB is injected, the plasma<br />
density increases considerably, n
562 TANAKA et al.<br />
REFERENCES<br />
[1] Non-inductive Current Drive in Tokamaks (Proc. <strong>IAEA</strong> Tech. Comm. Meeting, Culham, 1983),<br />
Vols 1 <strong>and</strong> 2, Culham Laboratory, Abingdon (1983).<br />
[2] FISCH, N.J., BOOZER, A.H., Phys. Rev. Lett. 45 (1980) 720.<br />
[3] TANAKA, S., et al., in Plasma Physics <strong>and</strong> Controlled <strong>Nuclear</strong> Fusion Research 1982 (Proc.<br />
9th Int. Conf. Baltimore, 1982), Vol. 1, <strong>IAEA</strong>, Vienna (1983) 199.<br />
[4] TANAKA, S., et al., in Plasma Physics <strong>and</strong> Controlled <strong>Nuclear</strong> Fusion Research 1984 (Proc.<br />
10th Int. Conf. London, 1984), Vol. 1, <strong>IAEA</strong>, Vienna (1985) 623.<br />
[5] ANDO, A., et al., Phys. Rev. Lett. 56 (1986) 2180; J. Phys. Soc. Jpn. 56 (1986).<br />
[6] SHIMOZUMA, T., et al., J. Phys. Soc. Jpn. 54 (1985) 1360.<br />
[7] ANDO, A., et al., Nucl. Fusion 26 (1986) 107.<br />
[8] KUBO, S., et al., Phys. Rev. Lett. 50 (1983) 1994.<br />
[9] OGURA, K., et al., J. Phys. Soc. Jpn. 55 (1986) 13.<br />
[10] NAKAMURA, M., et al., J. Phys. Soc. Jpn. 53 (1984) 3399.<br />
[11] CORDEY, J.G., et al., Plasma Phys. 24 (1982) 7.<br />
[12] FIDONE, I., GIRUZZI, G., GRANATA, G., MEYER, R.L., Phys. Fluids 27 (1984) 2486.<br />
[13] TANAKA, H., et al., Jpn. J. Appl. Phys. 24 (1985) 644.<br />
DISCUSSION<br />
A.C. RIVIERE: In the case of electron cyclotron current drive, did you make<br />
an experiment with the antenna in the opposite toroidal direction? If so, what was the<br />
difference in current between the two antenna orientations?<br />
S. TANAKA: Yes, we did perform such an experiment. When the antenna was<br />
in the opposite toroidal direction, we could not obtain a flat-top or ramp-up<br />
discharge, although a weak EC driven current did appear.
IMPROVEMENT OF<br />
CURRENT DRIVE AND CONFINEMENT<br />
BY COMBINATION OF<br />
LHCD AND NBI HEATING IN JT-60<br />
JT-60 TEAM<br />
(Presented by T. Imai)<br />
<strong>IAEA</strong>-CN-47/F-II-7<br />
T. Abe, H. Aikawa, H. Akaoka, H. Akasaka, M. Akiba, N. Akino, T. Akiyama,<br />
T. Ando, K. Annoh, N. Aoyagi, K. Arakawa, M. Araki, K. Arimoto, M. Azumi,<br />
S. Chiba, M. Dairaku, N. Ebiswa, T. Fujii, T. Fukuda, H. Fumkawa,<br />
K. Hamamatsu, K. Hayashi, M. Hara, K. Haraguchi, H. Hiratsuka, T. Hirayama,<br />
S. Hiroki, K. Hiruta, M. Honda, H. Horiike, R. Hosoda, N. Hosogane, Y. Iida,<br />
T. Iijima, K. Ikeda, Y. Ikeda, T. Imai, T. Inoue, N. Isaji, M. Isaka, S. Ishida,<br />
N. Itige, T. Ito, Y. Ito, A. Kaminaga, M. Kawai, Y. Kawamata, K. Kawasaki,<br />
K. Kikuchi, M. Kikuchi, H. Kimura, T. Kimura, H. Kishimoto, K. Kitahara,<br />
S. Kitamura, A. Kitsunezaki, K. Kiyono, N. Kobayashi, K. Kodama, Y. Koide,<br />
T. Koike, M. Komata, I. Kondo, S. Konoshima, H. Kubo, S. Kunieda,<br />
S. Kurakata, K. Kurihara, M. Kuriyama, T. Kuroda, M. Kusaka, Y. Kusama,<br />
S. Maehara, K. Maeno, S. Mase, S. Matsuda, M. Matsukawa, T. Matsukawa,<br />
M. Matsuoka, N. Miya, K. Miyati, Y. Miyo, K. Mizuhashi, M. Mizuno, R. Murai,<br />
Y. Murakami, M. Muto, M. Nagami, A. Nagashima, K. Nagashima,<br />
T. Nagashima, S. Nagaya, H. Nakamura, Y. Nakamura, M. Nemoto, Y. Neyatani,<br />
S. Niikura, H. Ninomiya, T. Nishitani, H. Nomata, K. Obara, N. Ogiwara,<br />
Y. Ohara, K. Ohasa, T. Ohga, H. Ohhara, M. Ohkubo, T. Ohshima, K. Ohta,<br />
M. Ohta, M. Ohtaka, Y. Ohuchi, A. Oikawa, H. Okumura, Y. Okumura,<br />
K. Omori, S. Omori, Y. Omori, T. Ozeki, M. Saigusa, K. Sakamoto, A. Sakasai,<br />
S. Sakata, M. Satou, M. Sawahata, M. Seimiya, M. Seki, S. Seki, K. Shibanuma,<br />
R. Shimada, K. Shimizu, M. Shimizu, Y. Shimomura, S. Shinozaki, H. Shirai,<br />
H. Shirakata, M. Shitomi, K. Suganuma, T. Sugie, T. Sugiyama, H. Sunaoshi,<br />
K. Suzuki, M. Suzuki, M. Suzuki, N. Suzuki, S. Suzuki, Y. Suzuki,<br />
H. Takahashi 1 , M. Takahashi, S. Takahashi, T. Takahashi, M. Takasaki,<br />
M. Takatsu, A. Takeshita, H. Takeuchi, S. Tamura, S. Tanaka, K. Tani,<br />
M. Terakado, T. Terakado, K. Tobita, T. Tokutake, T. Totsuka, N. Toyoshima,<br />
H. Tsuda, T. Tsugita, S. Tsuji, Y. Tsukahara, M. Tsuneoka, K. Uehara,<br />
M. Umehara, Y. Uramoto, H. Usami, K. Ushigusa, K. Usui, J. Yagyu,<br />
K. Yamada, M. Yamamoto, O. Yamashita, Y. Yamashita, K. Yano, T. Yasukawa,<br />
K. Yokokura, H. Yokomizo, H. Yoshida, M. Yoshikawa, Y. Yoshinari.<br />
R. Yoshino, I. Yonekawa, K. Watanabe<br />
Naka Fusion Energy Research Establishment,<br />
Japan Atomic Energy Research Institute,<br />
Naka-machi, Naka-gun, Ibaraki-ken,<br />
Japan<br />
1 Princeton Plasma Physics Laboratory, Princeton University, NJ, USA.<br />
563
564 JT-60 TEAM<br />
Abstract<br />
IMPROVEMENT OF CURRENT DRIVE AND CONFINEMENT BY COMBINATION OF LHCD<br />
AND NBI HEATING IN JT-60.<br />
First results of the lower hybrid current drive (LHCD) experiment on JT-60 are presented, in<br />
which maximum RF driven currents of 1.7 MA with an RF power of 1.2 MW at 2 GHz are obtained<br />
for 2 s. High current drive efficiency, JJCD = ne [10 19 m~ 3 ]R[m]IRF[MA]/PLH[MW] = 1-1.7 for<br />
Ohmic plasma is reliably attained. An enhancement of )jCD is obtained with the combination of LHCD<br />
<strong>and</strong> NBI heating <strong>and</strong> a value of ?jCD = 2-2.8 is reached. Improvement in confinement because of the<br />
synergetic effect of combined LHCD <strong>and</strong> NBI is also observed. The energy confinement time during<br />
NBI heating is not degraded, compared with that in Ohmic discharges.<br />
1. INTRODUCTION<br />
Improvement in current drive efficiency <strong>and</strong> reduction of confinement degradation<br />
during auxiliary heating are crucial problems of the next large tokamak aiming<br />
at a steady state tokamak reactor. Recent progress in current drive, heating <strong>and</strong><br />
suppression of MHD activities making use of RF power makes us hope that we shall<br />
be able to overcome these problems. As a result of successful heating <strong>and</strong> current<br />
drive experiments in the Lower Hybrid Range of Frequencies (LHRF) on the JAERI<br />
tokamaks (JFT-2, JFT-2M) [1-3], a scaling-up programme with high power LHRF<br />
heating from 24 MW source power has started in JT-60. The major objectives of the<br />
JT-60 LHRF system are the production of a reactor grade plasma with a combination<br />
of 20 MW Neutral Beam Injection (NBI) <strong>and</strong> 6 MW Ion Cyclotron Range of<br />
Frequencies (ICRF) heating, <strong>and</strong> current drive in low <strong>and</strong> medium density plasmas,<br />
in order to ascertain the physics feasibility of stationary or quasi-stationary operation<br />
of the tokamak reactor.<br />
In this paper, the first results of lower hybrid current drive in Ohmic <strong>and</strong> NBI<br />
heated plasmas in JT-60 will be described, in which enhancement of current drive<br />
efficiency by combination of LHCD <strong>and</strong> NBI heating <strong>and</strong> an improvement of<br />
confinement are obtained.<br />
2. LHRF SYSTEM<br />
Since the performance of JT-60 <strong>and</strong> the NBI heating system are described in<br />
companion papers [4, 5], only a brief description of the LHRF system will be given<br />
here. The LHRF heating system produces 24 MW RF power at about 2 GHz<br />
(1.7-2.23 GHz) with three units of the eight klystron amplifier subsystems, where<br />
the 1 MW klystrons developed in JAERI are used. The line-up of the amplifier chain<br />
is shown in Fig. 1 (a). One of three 4 X 8 phased array launchers, which are installed<br />
in JT-60 at present, is designed for current drive <strong>and</strong> has additional passive<br />
waveguides [6]. The results obtained here are from this launcher, whose N| spectra,
S.G. LEVEL S.S.<br />
CONT. AMP<br />
FUNC. SIG - ON/OFF<br />
GEN. CONT.<br />
CAMAC<br />
Pit<br />
180*<br />
15 - 0 V\<br />
90* /X \<br />
-5 - 100 keV is expected. The radial position<br />
of the launcher front is usually at r = 945-950 mm.<br />
3. CURRENT DRIVE IN OHMIC PLASMA<br />
The current drive effect in Ohmic plasma is reliably obtained in JT-60, when<br />
the lower hybrid wave is coupled unidirectionally to the low density plasma. A<br />
typical time evolution of loop voltage V,, plasma current Ip, Ohmic primary
566 JT-60TEAM<br />
II<br />
(A)<br />
(A) f A<br />
(VW) d I<br />
o •" op<br />
(VW) d I (A) Mi R.oi) a y v<br />
61<br />
too<br />
07<br />
(V1J<br />
/<br />
~2°
2.0<br />
1.5 -<br />
1.0-<br />
0.5 -<br />
<strong>IAEA</strong>-CN-47/F-II-7 567<br />
•<br />
- V'<br />
-<br />
1<br />
(IO •n _ e<br />
l9 m 3 )-R(m)-IRF(A)<br />
'CD"<br />
LH<br />
0.5 1.0<br />
1<br />
ne (IO l9 m 3 )<br />
— - —<br />
FIG. 3. Density scan of RF driven current normalized by RFpower, where Igp = /<br />
current IF, electron line average density ft,, <strong>and</strong> A (= j3p+ 0 is clearly<br />
observed during the RF pulse. Current sustainment without Ohmic supply is also<br />
demonstrated in Fig. 2(h). RF currents of 0.7 MA are only sustained by RF power<br />
of 0.76 MW, during 2 s. The maximum RF current obtained so far is 1.7 MA, as<br />
will be shown in Fig. 5(a).<br />
The density dependence of IRF (= LjAVj/V,) is shown in Fig. 3. IRF is<br />
roughly proportional to 1/n,,, as usual, since our present density regime is lower<br />
1.5
568 JT-60TEAM<br />
than the density limit. It may be stated that an efficient current drive of<br />
ijCD = 1-1.7 in an Ohmic target plasma is obtained although the estimation of the<br />
RF currents (IRF) contains some error bar due to the change in ^ (roughly 20%).<br />
These values are appreciably larger than previous results obtained in other small<br />
<strong>and</strong> medium size tokamaks. The theoretical current drive efficiency is given<br />
by 7? = K^fg [7], where p = 1/N? (1 - N?/Ni)/log (N2/N,), N, <strong>and</strong> N2 being<br />
accessibility limit of N| <strong>and</strong> the upper limit of the N| spectrum of radiated power;<br />
f is a directivity factor, g is the portion of the accessible wave, <strong>and</strong> K is a constant<br />
factor if Zeff is constant. The factors /t, f <strong>and</strong> g are not very different among various<br />
tokamaks if the NB spectrum is optimized for current drive. Therefore, the reason<br />
for our improved efficiency lies elsewhere. The effect of electron temperature does<br />
not explicitly appear in r;TH. However, since we need some secondary mechanism to<br />
fill up the spectral gap between the wave phase velocity <strong>and</strong> the thermal velocity in<br />
order to explain the effective current drive results obtained previously in many<br />
tokamaks, this secondary effect necessarily brings about some reduction in<br />
efficiency. Therefore, the electron temperature must play an important role in determining<br />
the efficiency, because the higher the electron temperature, the smaller the<br />
spectral gap if we optimize fi. From this conclusion, we can achieve a more efficient<br />
current drive in higher temperature plasmas, which can be realized by NBI heating.<br />
4. IMPROVEMENT OF VcD WITH NBI HEATING<br />
As was discussed in Section 3, higher current drive efficiency is expected in<br />
NBI heated plasma. Figure 4 shows the time evolution of the relevant plasma<br />
parameters in a typical LHCD + NBI shot, where the RF <strong>and</strong> NBI powers are 0.88<br />
<strong>and</strong> 8.8 MW, respectively, <strong>and</strong> Ip = 1 MA. The IRF current is estimated in the<br />
same manner as that in the case of an Ohmic target plasma. Here, the increment of<br />
the loop voltage after the RF pulse, while the NBI power is still on, is used as AV,.<br />
An interesting feature shown in Fig. 4 is that the loop voltage drop ratio (AV,/V,)<br />
does not change much before <strong>and</strong> after NBI is turned on, while tie increases by more<br />
than a factor of 2.5. As is seen from the figure, IAV,|/V, = 1.25, because of<br />
LHCD before NBI, <strong>and</strong> 0.75 during the NBI pulse <strong>and</strong>, hence IRF = 1.25 <strong>and</strong><br />
0.75 MA, in the respective cases. Using ft,. = 0.35 X 10 19 m" 3 (OH + LHCD),<br />
0.9 x 10 19 m" 3 (LHCD + NBI) <strong>and</strong> R = 3.1 m, ijCD = 1.5 in an Ohmic plasma<br />
<strong>and</strong> 2.4 in an NBI heated plasma are obtained. The estimated RF current, IRF, for<br />
various cases is plotted in Fig. 5(a), where the currents in an Ohmic target plasma<br />
are also plotted. As is seen from the figure, rjCD, for NBI + LHCD, is 2-2.8, while<br />
for OH + LHCD, it is 1-1.7. The efficiency is almost doubled by NBI. This efficiency<br />
enhancement is also supported by measurements of the hard X-ray intensity,<br />
IHX, <strong>and</strong> the electron cyclotron emission intensity, IECE(3fce). The linear correlation<br />
between IRF <strong>and</strong> the hard X-ray increment during LHCD AIHX is obtained from<br />
Fig. 5(b). Figure 5(c) shows the transition of AIHX from OH + LHCD to
2<br />
: i<br />
? o<br />
-i<br />
cc<br />
i<br />
"-30<br />
§ 0.5 k<br />
i= 0<br />
1.2<br />
> 1.0 ~———^—v/<br />
0.8<br />
<strong>IAEA</strong>-CN-47/F-II-7 569<br />
f<br />
PNBI = 8.8 MW<br />
NBI V<br />
\H = 0.88MW<br />
, \<br />
•"" "<br />
5<br />
t (s)<br />
—s<br />
FIG. 4. Time evolution of loop voltage <strong>and</strong> relevant plasma parameters in discharge with<br />
LHCD + NBI heating.<br />
LHCD + NBI in the same shot. Since AIHX
570<br />
V V<br />
•O o<br />
o —<br />
JT-60 TEAM<br />
(UNO BhV) "y/*"l7<br />
(A'*002* :<br />
g<br />
to<br />
XH,7<br />
i s<br />
ll<br />
'•si<br />
a C<br />
I s<br />
if<br />
I1<br />
* -5 .=><br />
0.3<br />
S. 0.1 -<br />
0.0<br />
0.4<br />
0.2<br />
-0.2<br />
0.4<br />
0.2<br />
-0.2<br />
0 -<br />
0.4<br />
0.2<br />
0 -<br />
(a)<br />
(b)<br />
<strong>IAEA</strong>-CN-47/F-II-7 571<br />
NBI<br />
-•2<br />
-0.2<br />
4, 0 5.0 6.0 7.0<br />
Time (s)<br />
1<br />
1<br />
T Eoh<br />
572 JT-60 TEAM<br />
W* [OH + NBI] = 0.26 MJ <strong>and</strong> W* [LHCD + NBI] = 0.4 MJ, assuming A^<br />
due to NBI — 0. A substantial enhancement of the stored energy by the combination<br />
of LHCD <strong>and</strong> NBI heating is found from these values. The confinement time for the<br />
incremental stored energy during NBI heating increases by 20-30% in the LHCD<br />
plasma. A remarkable increase in stored energy is obtained with the higher NBI<br />
power of 11 MW in the LHCD plasma, <strong>and</strong> W* reaches 1.1 MJ, from Fig. 6(c).<br />
Surprisingly, the global energy confinement time is approximately equal to that in the<br />
Ohmic discharge <strong>and</strong> is 2.5 times larger than that from Kaye-Goldston scaling. The<br />
confinement is not degraded by high power NBI (PNBI > POH) m LHCD plasma,<br />
even if hydrogen is dominant. The particle confinement is also improved, since<br />
density profile peaking is observed in the LHCD + NBI discharge [5]. These profile<br />
reorganizations of j(r), n^r) <strong>and</strong> possibly Te(r) in the LHCD plasma seem to play<br />
an important role in confinement <strong>and</strong> make a new H-mode regime using RF current<br />
drive a very promising device.<br />
6. CONCLUSIONS<br />
Up to 1.2 MW of LHRF power is launched unidirectionally in toroidal direction<br />
into Ohmic <strong>and</strong> NBI heated plasmas in JT-60. Our results may be summarized as<br />
follows:<br />
(1) Maximum RF currents of 1.7 MA are obtained.<br />
(2) Efficient RF current drive (T;CD = 1-1.7) is obtained in Ohmic plasmas.<br />
(3) A substantially improved current drive efficiency (T;CD = 2-2.8) is observed in<br />
plasmas with high power NBI heating, due to the increase in electron<br />
temperature.<br />
(4) The degraded energy confinement in NBI heated plasmas is improved by<br />
LHCD.<br />
Although more detailed studies should be done in the future, the results<br />
presented in this paper are very important <strong>and</strong> promising with respect to a future large<br />
tokamak. In particular, items (3) <strong>and</strong> (4) seem to be highly relevant to a steady state<br />
tokamak reactor.<br />
ACKNOWLEDGEMENTS<br />
The authors wish to thank the members of JAERI who have contributed to the<br />
JT-60 project. They also wish to express their gratitude to Drs S. Mori, Y. Iso, <strong>and</strong><br />
K. Tomabechi for continued encouragement <strong>and</strong> support.
<strong>IAEA</strong>-CN-47/F-II-7 573<br />
REFERENCES<br />
[1] NAGASHIMA, T., FUJISAWA, N., in Heating in Toroidal Plasmas (Proc. 1st Joint Varenna-<br />
Grenoble Int. Symp. Grenoble, 1978), Vol. 2 (1978) 281.<br />
[2] IMAI, T., et al., in Radiofrequency Plasma Heating (Proc. 4th Top. Conf. Austin, TX, 1981),<br />
American Institute of Physics, New York (1981).<br />
[3] YAMAMOTO, T., et al., Phys. Rev. Lett. 45 (1980) 716.<br />
[4] YOSHIKAWA, M., et al., Paper <strong>IAEA</strong>-CN-47/A-I-1, these Proceedings, Vol. 1.<br />
[5] JT-60 TEAM (presented by NAGAMI, M.), Paper <strong>IAEA</strong>-CN-47/A-II-2, these Proceedings,<br />
Vol. 1.<br />
[6] NAGASHIMA, T., et al., JT-60 radiofrequency heating system: Description <strong>and</strong> R&D results,<br />
to be published in Nucl. Eng. Des./Fusion.<br />
[7] FISCH, N.J., Phys. Rev. Lett. 41 (1978) 873.<br />
DISCUSSION<br />
F.X. SOLDNER: The confinement times are derived from A, the sum of<br />
poloidal equilibrium beta <strong>and</strong> internal inductance. Can you rule out an increase in the<br />
internal inductance during combined LHCD + NBI in the case of lower NBI power<br />
for which you have shown A curves for comparable cases of NBI alone <strong>and</strong> for<br />
NBI + LHCD?<br />
Further, what kind of enhancement of the energy confinement is left if you<br />
include the injected LH power, i.e. if you scale plasma energy versus total power<br />
input?<br />
T. IMAI: We cannot completely rule out a difference in A A between cases<br />
with NBI + LHCD <strong>and</strong> NBI alone, for medium NBI power, as seen in Fig. 6(a)<br />
<strong>and</strong> (b), since no kinetic measurements were made because of the low density. In<br />
order to avoid this ambiguity, we conducted a higher power experiment <strong>and</strong> obtained<br />
the result shown in Fig. 6(c), where an improvement in confinement can be clearly<br />
seen. In addition, we did not observe any evidence of an abrupt increase in internal<br />
inductance. If it occurred, a substantial increase in loop voltage should also have been<br />
observed.<br />
As to your second point, in our TE calculation we disregarded both the<br />
absorbed LH power <strong>and</strong> the increase in stored energy due to the LH power AWgH,<br />
since we have not yet been able to determine AW£H- However, our estimate of TE<br />
is valid if PLH -4 PNBi, as in our present experiments. If you compare the<br />
incremental energy confinement time, rf d = AW$B/PNB, you also find an enhancement<br />
of rl d in the LHCD plasma.<br />
R.J. GOLDSTON: In contrast to the H-mode, one imagines that most of the<br />
extra stored energy in this regime lies in the centre of the discharge. The electron<br />
temperature profile must be very impressive. Do you have any data on this that you<br />
could show us?
574 JT-60 TEAM<br />
T. IMAI: Unfortunately, our density regime in this series of experiments is<br />
still low, since the available LH power is not yet high enough to drive a current in<br />
a high density plasma. So it is very difficult, for the time being, to produce a<br />
temperature profile by Thomson scattering.<br />
K. LACKNER: I would like to recall that the TEXTOR results presented by<br />
Dr. V<strong>and</strong>enplas 1 for fairly low density also seemed not to show any deterioration of<br />
the additional heating, compared to Ohmic confinement times. Your results probably<br />
fall into the same category. In your plot, comparing TE with NBI to NBI/LHCD, the<br />
former cases appear to lie at higher densities. Was the change in particle confinement<br />
time associated with the addition of LHCD?<br />
T. IMAI: Yes, we observed an improvement in particle confinement for NBI<br />
heated plasma with LHCD. This point was dealt with in the paper of Dr. Nagami 2 .<br />
1 Paper <strong>IAEA</strong>-CN-47/F-I-4, these Proceedings, Vol. 1.<br />
2 Paper <strong>IAEA</strong>-CN-47/A-II-2, these Proceedings, Vol. 1.
CURRENT DRIVE, CONFINEMENT AND<br />
INSTABILITY CONTROL EXPERIMENTS<br />
WITH ECRH ON THE CLEO TOKAMAK<br />
D.C. ROBINSON, N.R. AINSWORTH, P.R. COLLINS,<br />
A.N. DELLIS, T. EDLINGTON, P. HAYNES, S. IYENGAR 1 ,<br />
I. JOHNSON, B. LLOYD, M. O'BRIEN, B.J. PARHAM,<br />
A.C. RIVIERE, D.F.H. START, T.N. TODD<br />
Euratom-UKAEA Fusion Association,<br />
Culham Laboratory<br />
Abingdon, Oxfordshire,<br />
United Kingdom<br />
Abstract<br />
HAEA-CN-47/F-III-2<br />
CURRENT DRIVE, CONFINEMENT AND INSTABILITY CONTROL EXPERIMENTS WITH<br />
ECRH ON THE CLEO TOKAMAK.<br />
Electron cyclotron resonance heating has been carried out on CLEO (R/a = 7, R = 0.9 m) using<br />
the second harmonic extraordinary mode at both 28 GHz <strong>and</strong> 60 GHz to investigate current drive, confinement<br />
<strong>and</strong> instability control. With the 28 GHz source, at low collisionality (cc* - 0.01) <strong>and</strong> with<br />
a non-thermal population of electrons the confinement is enhanced relative to that in ohmic plasmas,<br />
whereas with the 60 GHz source <strong>and</strong> ve* ~ 0.1 the confinement degrades with little non-thermal electron<br />
production. No evidence for current drive has so far been obtained at 28 GHz, but at 60 GHz a<br />
different loop voltage response was obtained when either the antenna direction or the plasma current<br />
direction relative to the antenna pattern was changed, indicating a driven current of about 5 kA for<br />
150 kW of absorbed power. Low mode number MHD activity has been controlled in a number of<br />
experiments, allowing an increase in the disruptive density limit <strong>and</strong> control of sawtooth activity.<br />
INTRODUCTION<br />
A series of experiments with 28 <strong>and</strong> 60 GHz ECRH has been<br />
carried out on CLEO using a variety of different waveguide<br />
technologies <strong>and</strong> modes, to study confinement, current drive, MHD<br />
control, preionisation <strong>and</strong> p-limits in tokamak, stellarator <strong>and</strong><br />
hybrid configurations.<br />
Current drive experiments have been carried out using<br />
second harmonic extraordinary mode radiation launched from the<br />
low field side at both 28 [1] <strong>and</strong> 60 GHz. Considerable<br />
development work has been aimed at producing high quality<br />
antenna patterns at high power for the current drive experiments<br />
at 60 GHz <strong>and</strong> recent results are detailed below.<br />
Commonwealth Universities scholar.<br />
575
576 ROBINSON et al.<br />
Low-m MUD mode control has been achieved in a variety of<br />
experiments, including stabilisation of the 2,1 tearing mode to<br />
raise the disruptive density limit <strong>and</strong> control of the 1,1 mode<br />
affecting the sawtooth period <strong>and</strong> amplitude.<br />
ENERGY CONFINEMENT<br />
For CLEO tokamak the plasmas associated with 2o> ECRH at<br />
28 <strong>and</strong> 60 GHz lie in a large aspect ratio, low density regime<br />
where conventional ohmic heating scalings (e.g- neo-Alcator)<br />
predict significantly lower confinement time than those of<br />
auxiliary heating, while the resulting data fall between these<br />
predictions <strong>and</strong> are therefore not easily categorised as simply<br />
L-mode or ohmic. Energy confinement was generally better in the<br />
bi-Maxwellian (thermal plus 13 keV tail) 28 GHz ECRH plasmas [2]<br />
than in their OH targets, even at absorbed power to initial<br />
ohmic heating power ratios ( p ahS/PoH^ °* > *°* ^ Orl< on other<br />
machines [3] has also correlated confinement enhancement with<br />
distorted electron distributions. In the more thermal 60 GHz<br />
ECRH cases, with similar P . /PnH ratios, the confinement<br />
degrades <strong>and</strong> the data indicate a scaling of WTQT ~ I ap ah with<br />
a < 0.8 <strong>and</strong> with the resonance in the plasma centre.<br />
For 28 GHz, 2w heating,the fairly weak sensitivity of the<br />
energy content to resonance position was accompanied by clear<br />
in-out asymmetry in electrical conductivity, consistent with a<br />
strong trapped particle population when heating on the low field<br />
side. Surface barrier diode array data show that the<br />
si owing-down time of this non-thermal trapped particle group is<br />
essentially classical [4], while the particles would have to<br />
slow down much more rapidly if they were to account for the<br />
observed anomalous electron energy loss. Lowering the plasma<br />
density raised the stored energy, anisotropy <strong>and</strong> the population<br />
of the 13 keV tail.<br />
At 60 GHz the higher densities <strong>and</strong> lower temperatures<br />
made the ECRH plasmas much less collisionless, resulting in<br />
essentially Maxwellian isotropic distributions, while the<br />
density dependence of Tr or W. . became weakly positive up to<br />
the cut-off <strong>and</strong> the sensitivity to resonance position became<br />
more critical. At both frequencies the stored energy increase<br />
rose with plasma current, saturating near q~2 with the
I<strong>IAEA</strong>-CN-47/F-III-2 577<br />
TABLE I. PARAMETERS OF OHMIC HEATING TARGET<br />
PLASMA AND OF THE RESULTANT ECRH PLASMA<br />
Ip = 10 kA, B* = 1.07 T<br />
Te(0)<br />
ne(0)<br />
/3p<br />
POH/RF<br />
Ohmic heating<br />
400 eV<br />
8 x 10 18 nT 3<br />
0.7<br />
14 kW<br />
2.3 ms<br />
ECRH<br />
1250 eV<br />
6 x 10 18 m- 3<br />
2.7<br />
155 kW<br />
0.9 ms<br />
RF-dominated 28 GHz case <strong>and</strong> at higher q with the 60 GHz case,<br />
where the stored energy of the target plasma became significant.<br />
The effect on this current scaling of adding vacuum rotational<br />
transform using the i=3 stellarator windings was investigated at<br />
28 GHz, with the conclusion that an improvement was realised<br />
only when a significant relative contribution was made by the<br />
vacuum transform.<br />
The parameters of the ohmic heating target plasma <strong>and</strong> of<br />
the resultant ECRH plasma at 60 GHz are summarised in Table I<br />
<strong>and</strong> typical waveforms are shown in Fig 1. The ohmic plasmas<br />
feature sawteeth <strong>and</strong> Z ff < 2. RF probes indicate that about<br />
85% of the incident RF power is absorbed. The confinement<br />
degradation seems to be stronger than the Merezhkin scaling [5]<br />
but similar to the L-mode.<br />
With gettering, good vacuum conditions <strong>and</strong> constant gas<br />
injection rates, ECRH in CLEO invariably produces a fall in line<br />
averaged density, reaching a factor > 2 when the initial density<br />
is a little above the nominal cut-off. However, measurements<br />
with a two-channel interferometer show that part of this fall is<br />
due to a broadening of the density profile. Ha measurements show<br />
that the particle confinement decreases by a factor ~ 2.<br />
In CLEO the stored energy (p + S../2), SXR flux, etc. in<br />
general do not relax during the RF pulse (usually 20-50ms in<br />
duration) even when the resonance is displaced off axis.<br />
Fundamental heating has been directly compared with second<br />
harmonic heating at the same toroidal field using 28 <strong>and</strong> 60 GHz.
578<br />
(V>l)lN3dbinO VWSVld<br />
(A) 39V±1OA dOOl<br />
ROBINSON et al.<br />
A1ISN3Q
I<strong>IAEA</strong>-CN-47/F-III-2 579
580 ROBINSON et al.<br />
For an 11 kA plasma current at n ~ 3.6xlO 18 m" 3 <strong>and</strong> B ~ 1.04 T<br />
the central electron temperature rise was practically the same:<br />
450 eV (ohmic) * 1 keV for 28 GHz <strong>and</strong> 450 eV * 1.15 keV for 60<br />
GHz. However, the range of parameters over which the heating is<br />
effective is greater with second harmonic heating.<br />
CURRENT DRIVE<br />
At 28 GHz the wave was launched in the median plane at<br />
about 80° to the magnetic field parallel or anti-parallel to I .<br />
The directed launch was obtained by mixing TEQ1 <strong>and</strong> TEn modes<br />
<strong>and</strong> checked by launching the gyrotron output through the entire<br />
waveguide system into free space, with far-field antenna<br />
patterns recorded on heat sensitive paper. The principal<br />
antenna lobe was directed with <strong>and</strong> against the plasma current,<br />
but no discernible differences in the current or loop voltage<br />
behaviour appeared, despite a theoretically predicted current of<br />
~ 10 kA (for the far-field launch angles).<br />
60 GHz ECRCD experiments utilised a Vlasov antenna,<br />
converting a TE02 mode to a single crescent-shaped launch<br />
pattern, angled at about 70° to the magnetic field. This<br />
theoretical pattern was verified in detail using a real-time<br />
30° 20° 10° 0° 10°<br />
1 I I I I<br />
Infra-red image of antenna pattern<br />
(60GHz,180kW)<br />
I<br />
30mm<br />
/—'<br />
l_^— waveguide<br />
FIG. 2. Far-field infra-red image of antenna pattern for the Vlasov antenna.
10<br />
0-8<br />
> 06<br />
O<br />
><br />
8 0A<br />
02<br />
I<strong>IAEA</strong>-CN-47/F-ni-2 581<br />
Pr, = 185 kW<br />
Olp=10kA C.W<br />
096 100 1-04 108 1-12<br />
FIG. 3. Loop voltage during ECRHfor clockwise <strong>and</strong> anticlockwise plasma current<br />
as a Junction of toroidal field.<br />
temperature-analysing infra-red camera to look at the result of<br />
launching the gyrotron output onto large absorbent tiles, as<br />
shown in Fig 2. Calorimetric measurements indicate that 185 kW<br />
is radiated into the torus with this directivity, from one<br />
200 kW gyrotron 32 metres, 3 bends <strong>and</strong> 2 convertors away.<br />
Current drive experiments with this configuration were<br />
carried out at n ~ 3.5 x 10 18 m" 3 (see Fig. 1) <strong>and</strong> with<br />
essentially Maxwell ian central temperatures of 1.3 keV at I =<br />
10 kA <strong>and</strong> 1.5 keV at I =15 kA,as deduced from SXR spectra.<br />
Reversing the servo-controlled plasma current or the antenna<br />
direction produced a clear <strong>and</strong> consistent difference in loop<br />
voltage. Figure 3 shows the difference for a toroidal field<br />
scan with both current directions. The theoretical assumption<br />
that the ECRH current is essentially the same for each plasma<br />
current direction allows its magnitude to be unfolded from the
582 ROBINSON et al.<br />
16 • Theory<br />
12<br />
10<br />
X 8<br />
100 102<br />
Experiment<br />
1-04 106 108 1-10<br />
FIG. 4. Comparison of experimental <strong>and</strong> theoretical values for deduced RF driven current as a function<br />
of toroidal field, <strong>and</strong> percentage absorption as a function of B^, for Ip = JOkA <strong>and</strong> P^ = 185 kW.<br />
For percentage absorption, the open <strong>and</strong> closed circles correspond to clockwise <strong>and</strong> counter-clockwise<br />
plasma current, respectively.<br />
loop voltage difference, with the result shown in Fig. 4. The<br />
deduced RF current increases with plasma current from 2.5 kA at<br />
5 kA to 5 kA at 15 kA.<br />
A calibrated 'horn receiver' detecting the magnitude of<br />
60 GHz radiation in the torus has been used to estimate the<br />
unabsorbed gyrotron power. The absorbed power is typically<br />
80-90% <strong>and</strong> only a weak function of B , I <strong>and</strong> n , indicating the<br />
importance of wall reflections for absorption, as theoretically<br />
predicted. The wave driven current, however, varies more<br />
strongly with B <strong>and</strong> ID>as shown for example in Fig. 4.<br />
Theoretical calculations of the RF driven current in these<br />
experiments have been made using a ray tracing code which<br />
includes a current drive model allowing for trapping effects <strong>and</strong><br />
the weakly relativistic resonance condition [6], The radiation<br />
pattern shown in Fig. 2 was modelled by a bundle of 270 rays.<br />
-|100<br />
75<br />
50<br />
25
I<strong>IAEA</strong>-CN-47/F-III-2 583<br />
Plasma profiles of the form n = n (l-r 2 /a 2 ) 2 <strong>and</strong> T = T<br />
(l_r2/a2)3 (n^^ <strong>and</strong> j^ typically 0.8 x 10" m-3 <strong>and</strong> 1.3 keV,<br />
respectively) <strong>and</strong> a hot-core shift of up to 4 cm were assumed, in<br />
accordance with the experimental data. The calculations<br />
including wall reflections predict greater than 80% absorption,<br />
in reasonable agreement with the 'horn receiver 1 measurements as<br />
shown in Fig. 4. With the resonance in the hot core the driven<br />
current profile has a half-width of about 3 cm, with an<br />
efficiency of typically 60 A/kW. This leads to predicted<br />
currents of approximately three times the observed values in the<br />
hot core (Fig. 4). As the heating <strong>and</strong> driven current profiles<br />
are somewhat broader than the high-q displaced ohmic profiles,<br />
sawteeth suppression is to be expected. In general, this is<br />
observed at 15 kA, but, at 10 kA with gas puffing, sawtooth<br />
activity has been observed several msec after the RF is applied,<br />
with a period ~ tr <strong>and</strong> with individual sawteeth showing strong<br />
saturation. SXR profile broadening is observed with ECRU at 5,<br />
10 <strong>and</strong> 15 kA. For these pi asmas, p/p-rrovon ~ °« 3 « Tne<br />
calculations show that positioning the resonance away from the<br />
magnetic axis leads to broader driven current profiles but only<br />
a modest fall in absorption.<br />
The observed loop voltage response to co- <strong>and</strong> counterdirections<br />
is in satisfactory agreement with the predictions of<br />
ID heat <strong>and</strong> current diffusion calculations using deposition<br />
profiles calculated from the ray tracing code.<br />
The interpretation of these results as current drive needs<br />
to be treated with caution. Preferential loss of fast electrons<br />
carrying toroidal current in one direction could give rise to<br />
some of the observed voltage difference, as observed on previous<br />
stellarator experiments on CLEO. With a symmetric antenna at 10<br />
kA (but only weakly at 15 kA) the loop voltage response to the<br />
ECRU varies with plasma current direction, indicating a<br />
preferential loss current in the opposite direction to the net<br />
RF currents seen with the Vlasov antenna. The line averaged<br />
density <strong>and</strong> SXR flux profiles are similar for each current<br />
direction during the RF but not the H« emission. In addition,<br />
the profiles are sensitive to whether gas puffing is applied to<br />
compensate the apparent fall in line density.<br />
The bootstrap current is in the same sense as the total<br />
current, <strong>and</strong> for p > 2, v* ~ 0.1, <strong>and</strong> with the inferred profiles
584 ROBINSON et al.<br />
it should be ~ 6 kA with a hollow distribution. In the<br />
experiment the bootstrap current must be much smaller, as the<br />
average decrease in loop voltage corresponds closely to the rise<br />
in temperature if the resistivity is neoclassical.<br />
MODE CONTROL<br />
Experiments on CLEO using 60 GHz 2u near-axis ECRH have<br />
succeeded in raising the disruptive limit for 9 kA discharges at<br />
1.07 T by ~ 70%, attaining an I/N value of 1.0 x lO-l^ A-m (where<br />
N = :ra 2 n). Adding vacuum rotational transform to perturb the<br />
relative locations of the current density gradients <strong>and</strong> the q=2<br />
surface has been similarly successful, although the density<br />
limit remained disruptive <strong>and</strong> could only be improved at high q<br />
[7].<br />
Four saddle coils have been added to CLEO, capable of<br />
operation at up to 6 kiloampere-turns per winding in four<br />
configurations producing predominantly (m,n): 1,1; 2,1; 1,0<br />
(3,2) or 2,0 (2,2) (the principal resonant modes of the n=0<br />
options being shown in brackets). Following the successful<br />
stabilisation of ohmic heating sawteeth by 1,1 magnetic<br />
perturbations in TOSCA [8], experiments have been conducted on<br />
CLEO to investigate sawteeth stabilisation using the 1,1<br />
perturbations in the presence of high power 2W ECRH on axis at<br />
28 GHz since this produces strong sawteeth at high central<br />
temperatures. Preliminary results, however, indicate only<br />
interference of the sawtooth process <strong>and</strong> not full<br />
stabilisation.<br />
CONCLUSIONS<br />
ECRH current drive experiments at 60 GHz have shown an<br />
asymmetric current component of up to * 5 kA for 185 kW injected<br />
power. For 28 GHz, second harmonic heating with v* ~ 0.01 <strong>and</strong> a<br />
non-Maxwellian electron distribution function, the energy<br />
confinement time is better than the ohmic target plasma, while<br />
at 60 GHz with v* ~ 0.1, near-Maxwel1ian distributions are<br />
obtained but with some confinement degradation. Low-m MHD mode<br />
control has been demonstrated in a variety of ways,
I<strong>IAEA</strong>-CN-47/F-III-2 585<br />
significantly raising the disruptive density limit <strong>and</strong> achieving<br />
a measure of sawteeth control, both by using localised ECRH <strong>and</strong><br />
externally imposed helical fields.<br />
ACKNOWLEDGEMENT<br />
The authors would like to thank the CLEO operating team for<br />
their valuable support in these studies.<br />
REFERENCES<br />
[1] EDLINGTON, T., et al., in Controlled Fusion <strong>and</strong> Plasma Heating (Proc. 13th Europ. Conf.<br />
Schliersee, 1986), Part II, European Physical Society (1986) 219.<br />
[2] ROBINSON, D.C., et al., in Plasma Physics <strong>and</strong> Controlled <strong>Nuclear</strong> Fusion Research 1984<br />
(Proc. 10th Int. Conf. London, 1984), Vol. 1, <strong>IAEA</strong>, Vienna (1985) 205.<br />
[3] SOLDNER, F., et al., in Controlled Fusion <strong>and</strong> Plasma Physics (Proc. 12th Europ. Conf.<br />
Budapest, 1985), Part II, European Physical Society (1985) 244.<br />
[4] ROBINSON, D.C., "Small scale turbulence <strong>and</strong> anomalous transport in magnetized plasmas",<br />
in Magnetic Reconnection (Proc. Workshop Corsica, 1986).<br />
[5] MUKHOVATOV, V., JETP Lett. 33 (1981) 463.<br />
[6] FERREIRA, A., O'BRIEN, M.R., START, D.F.H., Plasma Phys. Controll. Fusion 26 (1984)<br />
1565.<br />
[7] TODD, T.N., et al., in Controlled Fusion <strong>and</strong> Plasma Physics (Proc. 12th Europ. Conf.<br />
Budapest, 1985), Suppl., European Physical Society (1985) 76.<br />
[8] McGUIRE, K., ROBINSON, D.C., in Controlled Fusion <strong>and</strong> Plasma Physics (Proc. 9th Europ.<br />
Conf. Oxford, 1979), Vol. 1, UKAEA, Culham Lab., Abingdon (1979) D2.7.<br />
DISCUSSION<br />
M.C. ZARNSTORFF: How much of your jSp is due to fast electrons? And<br />
what is your anisotropy?<br />
D.C. ROBINSON: According to diamagnetic loop <strong>and</strong> 0P 4- iJ2 measurements,<br />
there is no significant anisotropy in these 60 GHz experiments. The SiLi<br />
detector measurements of the electron distribution function show only a slight distortion<br />
from Maxwellian at energies of a few times thermal (1.5 keV); thus we believe<br />
there is no significant f5p contribution from the fast electrons.<br />
M.C. ZARNSTORFF: After the ECH pulse, /3p + {12 dropped to far below<br />
the initial Ohmic value. What is the reason for this?<br />
D.C. ROBINSON: In this particular case, the charge came from the toroidal<br />
field, which led to some pick-up in the diagnostic; thus the low /3p + ij2 value is<br />
erroneous is this case. With fi^ held constant, /3p + \I2 returns to the previous<br />
Ohmic value after the ECRH pulse.
586 ROBINSON et al.<br />
M.A. DUBOIS: On TFR, we have also suppressed sawteeth with ECRH, but<br />
our explanation is very different. You say the temperature profile broadens; what<br />
diagnostic do you use to measure this?<br />
D.C. ROBINSON: In these experiments the sawtooth is suppressed by current<br />
drive <strong>and</strong> heating. Theoretical calculations predict current <strong>and</strong> temperature broadening.<br />
Broadening of the temperature profile is deduced from soft X-ray measurements<br />
with surface barrier diodes <strong>and</strong>, when combined with density profile measurements,<br />
with SiLi detectors.
<strong>IAEA</strong>-CN-47/F-III-3<br />
CONFINEMENT IN ELECTRON CYCLOTRON<br />
HEATING EXPERIMENTS ON DOUBLET III<br />
R. PRATER, S. EJIMA, R.W. HARVEY,<br />
A.J. LIEBER, K. MATSUDA, C.P. MOELLER,<br />
<strong>and</strong> the DOUBLET HI PHYSICS GROUP<br />
GA Technologies Inc.,<br />
San Diego, California,<br />
United States of America<br />
Abstract<br />
CONFINEMENT IN ELECTRON CYCLOTRON HEATING EXPERIMENTS ON DOUBLET III.<br />
Electron cyclotron heating (ECH) experiments have been performed on the Doublet III tokamak<br />
in the exp<strong>and</strong>ed boundary divertor configuration. Effective ECH is found even at densities twice the<br />
cutoff density, with no decrease in the global energy confinement time when the cutoff is exceeded.<br />
Analysis of the behaviour of the sawteeth <strong>and</strong> of the soft x-ray emission indicates that for the overdense<br />
discharges ECH takes place near the plasma edge. A simplified transport analysis indicates that the electron<br />
thermal transport coefficient decreases by a factor of 2 when the heating is near the edge, while<br />
it increases by a factor of 2.5 when the heating is centrally localized. The transport analysis is confirmed<br />
by the behaviour of the propagation of the heat pulse when ECH is initiated. The edge heating results<br />
in a large improvement in energy confinement over the inner two thirds of the plasma.<br />
INTRODUCTION<br />
Improvement of energy confinement in tokamaks remains a central<br />
objective of the fusion program. Attainment of a mode of improved confinement<br />
(the H-mode) has been associated with changes in the plasma<br />
edge in previous experiments using neutral injection in tokamaks [1]. Experiments<br />
using Electron Cyclotron Heating (ECH) on the Doublet III<br />
tokamak have suggested means of improving confinement through direct<br />
heating of the plasma edge.<br />
In results presented here, Doublet III was run in the exp<strong>and</strong>ed<br />
boundary divertor configuration with elongation of 1.5-1.7. The working<br />
gas was deuterium. The ECH experiments [2] were carried out using a<br />
60 GHz source with power delivered to the plasma in the range 0.5 to 0.7<br />
MW, for pulses of typical duration 250 msec. The frequency corresponds<br />
to a gyromagnetic resonance at a field of 2.14 T. The power was launched<br />
from the vessel inner wall at the plasma midplane, using oblique launch<br />
(30° from the radial at the inner wall) of the extraordinary mode with<br />
better than 90% mode purity [3]. The measured launching pattern of<br />
the elliptically polarized TEoi mode has a divergence of 12° FWHM in<br />
the vertical plane <strong>and</strong> 16° in the horizontal plane.<br />
587
588 PRATER et al.<br />
Ray tracing calculations have been performed for this mode <strong>and</strong> geometry,<br />
using the TORAY code [4] for experimentally determined density<br />
profiles. In these calculations, the ray trajectory is determined using the<br />
cold plasma dispersion relation, <strong>and</strong> the absorption is integrated along<br />
the ray. It is found that the single-pass damping of a group of rays<br />
representing the distribution pattern of the antenna is strong up to a<br />
line-averaged density of n^ = 5.6xlO 19 m~ 3 , at which density the absorption<br />
drops rapidly with increasing density, due to refraction of the<br />
rays away from the plasma center <strong>and</strong> to the decrease of the absorptivity<br />
with density. This critical density constitutes an effective cutoff density.<br />
The maximum local density at which the dispersion relation permits<br />
propagation of any polarization or angle is 8.8 XlO 19 m~ 3 at 60 GHz.<br />
EXPERIMENTAL RESULTS<br />
In order to experimentally test the anticipated cutoff density, the<br />
plasma density was scanned over a wide range, 1 < fie < 11 XlO 19 m~ 3 ,<br />
with ECH power in the range of 0.5-0.7 MW <strong>and</strong> with the gyroresonance<br />
near the plasma axis. The central electron temperature determined from<br />
Thomson scattering, Fig. la, shows the largest increase at low density<br />
near 2XlO 19 m~ 3 , where ATe « 2 keV. As the density increases, ATe<br />
decreases to about 0.3 keV near the critical density, but at densities<br />
above the critical density ("overdense") the temperature increase remains<br />
constant at that value.<br />
Similarly, the total plasma energy W, Fig. lb, increases by about<br />
20 kJ for all densities above 2x 10 19 m~ 3 , with no change as the critical<br />
density is exceeded. The plasma energy is determined from MHD equilibrium<br />
analysis,using signals from magnetic flux loops <strong>and</strong> probes. The<br />
error in this analysis is estimated to be about 0.1 in f3p, or about 15%<br />
in the ECH case. The values for W generated from measurements of<br />
plasma diamagnetism agree with those from MHD analysis within 20%.<br />
The energy confinement time T^, determined simply from the expression<br />
TE = W/(POH + PECH)> also shows no degradation as the critical<br />
density is exceeded. This behavior is shown in Fig. Id. In this<br />
calculation of TE the conservative assumption is made that all power<br />
incident on the plasma is absorbed, <strong>and</strong> therefore the plotted T& value is<br />
its lower bound. At the highest densities, the drop in loop voltage during<br />
the ECH phase generates a decrease in the ohmic input power which<br />
is comparable to the ECH power. For these discharges the incremental<br />
confinement time rinc = AW/AP is divergent.
2<br />
UJ<br />
OHMIC<br />
<strong>IAEA</strong>-CN-47/F-III-3<br />
RESONANCE<br />
INACCESSIBLE<br />
120<br />
80<br />
40<br />
(b)<br />
ECH •<br />
RESONANCE<br />
INACCESSIBLE<br />
• •<br />
OHMIC<br />
0 2 4 6 8 10 12 0 2 4 6 8 10 12<br />
(c)<br />
•<br />
OHMIC<br />
•<br />
r ECH *'<br />
6 8 10 12<br />
9 rrf 3 )<br />
fie (10 19 m" 3 )<br />
6 8 10 12<br />
FIG. 1. (a) Central electron temperature from Thomson scattering, (b) total plasma energy from MHD<br />
equilibrium analysis, (c) loop voltage on the plasma, <strong>and</strong> (d) gross energy confinement time, as a Junction<br />
of line averaged density. The hollow circles are taken from ohmic times <strong>and</strong> the filled circles are<br />
from ECH times. The toroidal field is 2.1 T <strong>and</strong> the plasma current is 500 kA.<br />
The improvement in confinement time over the ohmic confinement<br />
time for the overdense heating case may not be significant, since the<br />
ohmic phase of the discharge is rather unusual. In particular, it is characterized<br />
by the presence of a volume of very high density (a "Marfe"<br />
[5]) at the inner wall of the plasma chamber. This high density region<br />
can be clearly identified in the radiated power signals from the bolometer,<br />
which examines 21 chords in a plane of constant toroidal azimuth<br />
from the outside midplane. The Marfe appears to have a crucial role in<br />
the development of the ohmic discharge <strong>and</strong> in the attainment of densities<br />
nearly a factor two beyond the usual experimental density limit for<br />
Doublet III of ne(10 19 m~ 3 ) < 27 x BT/Rq (in MKS units), but it also<br />
589
590 PRATER et al.<br />
seems to cause a reduction in confinement similar in magnitude to that<br />
of a transition from divertor to limiter configuration [6]. The Da radiation<br />
from the top of the plasma is also similar in magnitude to<br />
that found near a limiter in normal limiter discharges. When the ECH<br />
is applied, the Marfe moves rapidly downwards into the divertor region<br />
where it dissipates [7], <strong>and</strong> within 6 msec from the start of the ECH the<br />
discharge has evolved into a normal well-behaved divertor configuration,<br />
except that it has unusually high density.<br />
An immediate question arises regarding the overdense heating case:<br />
does the ECH power get absorbed near the plasma center where the gyroresonance<br />
lies, but where the dispersion relation forbids propagation,<br />
or is the power absorbed at some other location where the resonance<br />
condition is met but the density is lower?<br />
One way to address this question is to examine the behavior of the<br />
sawteeth when ECH is applied. At densities low enough that refraction<br />
is not important, the ECH power can be concentrated within a few cm<br />
of the magnetic resonance. When the gyroresonance is located near the<br />
plasma center the ECH power density can be much larger than the ohmic<br />
power density, with the result that the power applied to the volume<br />
within the q=l surface increases <strong>and</strong> that the gradient of the electron<br />
temperature evaluated at the q=l surface tends to increase. Both of<br />
these effects may be expected to decrease the sawtooth period rst [8].<br />
Similarly, placing the ECH power outside the q= 1 surface by shifting the<br />
location of the resonance reduces the power input within that surface<br />
20<br />
17<br />
o 14<br />
(a) 3£ne
5<br />
m<br />
780<br />
<strong>IAEA</strong>-CN-47/F-III-3 591<br />
FIG. 3. SXR emission temporal response along three chords. The ECH is initiated at 800 msec.<br />
The toroidal field is 2.2 T, the plasma current is 350 kA, <strong>and</strong> the density is ne = 5.5 x 10 19 m~ 3 .<br />
since the loop voltage drops when the ECH is added. It also tends<br />
to flatten the electron temperature profile near the q=l surface. This<br />
should result in an increase in the sawtooth period. These effects are<br />
observed in ECH experiments in moderate density plasmas when the<br />
resonance is scanned across the plasma, Fig. 2a. Placing the resonance<br />
within the q=l surface results in a decrease in rst, <strong>and</strong> placing the<br />
resonance outside the q=l surface results in an increase in rst.<br />
When the resonance is maintained near the plasma center <strong>and</strong> the<br />
density is scanned, r6t displays the expected decrease from the ohmic<br />
phase to the ECH phase consistent with central heating when the density<br />
lies below the critical density, as shown in Fig. 2b. But above the critical<br />
density the sawtooth period exhibits an increase of a factor five when<br />
ECH is added. This suggests that when the critical density is exceeded,<br />
the radius of power deposition shifts from the plasma center to much<br />
further out on the temperature profile.<br />
Evidence of a more direct nature comes from the soft x-ray (SXR)<br />
emission behavior of the plasma when ECH is initiated. Propagation<br />
of the ECH-generated heat pulse through the plasma can be followed<br />
by plotting the delay in the first appearance of increase in the SXR<br />
emission on the various chords. This method has also been used in ECH<br />
experiments on T-10 [9].<br />
820
592 PRATER et al.<br />
to<br />
(a) UNDERDENSE<br />
- 3.5x10 19 m~ 3<br />
20 r<br />
10 -<br />
6 -<br />
(b) OVERDENSE<br />
OH^-v.<br />
f<br />
-RESONANCE<br />
} >-*<br />
1.0 0.2 0.4 0.6 0.8 10 0.0 0.2 0.4 0.6 0.8 1.0<br />
r/a r/a<br />
FIG. 4. SXR delay time Td (defined in Fig. 2) plotted against relative minor radius: (a) underdense<br />
discharge (ne = 3.5 x W' 9 m~ 3 ) from Fig. 2, <strong>and</strong> (b) overdense discharge (ne = 1.0 X 10 20 m~ 3 ,<br />
ne(0) = 1.6 x 10 20 m~ 3 ), with BT = 2.1 T <strong>and</strong> IP = 500 kA. The dashed lines show the results from<br />
a transport model for various values of xe- Also shown is the assumed location (shaded area) of the<br />
input ECH power used in the model.<br />
I<br />
I!<br />
n<br />
x<br />
e - 1.0X10 20 n1-3<br />
p - 500 KA<br />
I<br />
I<br />
I<br />
MODEL<br />
ECH POWER<br />
INPUT<br />
I<br />
1<br />
1<br />
I iiIrn j<br />
An example of SXR data from a discharge with density well below<br />
the critical density (fie ss 3.0 X10 19 m~ 3 ) <strong>and</strong> with centrally located resonance<br />
is shown in Fig. 3. The 32 SXR chords, which lie in a plane of<br />
constant azimuth, are parameterized by the relative minor radius r/a<br />
of the flux surfaces to which they are tangent. The increase in SXR<br />
emission is prompt from chords with r/a < 0.15 but delayed for chords<br />
away from center, <strong>and</strong> the delay increases with distance. Outside of<br />
about r/a w 0.7 the signal-to-noise ratio becomes too small for this type<br />
of analysis.<br />
The direction <strong>and</strong> magnitude of the propagation speed of the heat<br />
pulse can be determined from a plot of the SXR delay Td as a function of<br />
minor radius. Figure 4a shows ra for the same low density discharge as<br />
Fig. 3, <strong>and</strong> Fig. 4b shows data from an overdense discharge. It is clear<br />
from Fig. 4 that in the underdense case the heat propagates radially<br />
outward from the center, while for the overdense case the heat propagates<br />
in an inward direction, at least for r/a < 0.7. It may be concluded
<strong>IAEA</strong>-CN-47/F-III-3 593<br />
from this that for the underdense case the ECH power is being deposited<br />
within a radius of 0.15 while for the overdense case the ECH power is<br />
deposited somewhere outside of r/a=0.7.<br />
Modeling<br />
The ONETWO transport code [10] has been used to model transport<br />
in ECH discharges in Doublet III. The inputs to the code include<br />
the directly measured quantities, such as the toroidal field, the plasma<br />
current, the plasma geometry from the MHD equilibrium analysis, the<br />
electron temperature profile, the density profile, <strong>and</strong> the radiated power<br />
profile. The electron temperature profile is measured using second harmonic<br />
electron cyclotron emission, <strong>and</strong> the density profile is determined<br />
by unfolding data from a three-channel interferometer, using the actual<br />
flux surface geometry to determine chordal path lengths. The radiated<br />
power profile is measured by the 21-channel bolometer. For these sawtoothing<br />
discharges, the central q(0) is input as 1. The impurity density<br />
is assumed to be oxygen, <strong>and</strong> it is adjusted in an iterative manner to<br />
obtain q(0)=l given the loop voltage V/. Further inputs are the ECH<br />
power profile as calculated by TORAY <strong>and</strong> the assumption that the ion<br />
thermal conductivity is neoclassical [11]. The time-dependent electron<br />
<strong>and</strong> ion heat equations <strong>and</strong> the current density diffusion equation using<br />
Spitzer conductivity are solved, keeping the density profiles constant.<br />
Code outputs are Xe(r)» Ti(r), V*, plasma kinetic energy W, <strong>and</strong> global<br />
energy confinement time TE, which are compared with the experimental<br />
data.<br />
Analysis of discharge #44055, from which data in Fig. 2 was taken,<br />
showed that a good fit to Te(r), V^ <strong>and</strong> W was obtained with Xe<br />
nearly constant across the profile, for the ECH power deposited within<br />
r/a=0.15. The value of Xt so determined during the ECH steady state<br />
phase is 0.8 m 2 /sec, about 2.5 times its value during ohmic heating in<br />
the same discharge, which accounts for the observed decrease in gross<br />
energy confinement time from 100 msec before ECH to 54 msec during<br />
ECH. The change in the global confinement time when ECH is added<br />
represents the transition from the ohmic scaling to the scaling for discharges<br />
dominated by auxiliary heating, which is obtained whether the<br />
auxiliary heating is ECH or neutral beam injection [12].<br />
An alternative way to determine Xo is to follow the propagation of<br />
the heat pulse at the onset of ECH. The ONETWO code calculates the
594 PRATER et al.<br />
SXR emission along the chords corresponding to the SXR diode array<br />
geometry, <strong>and</strong> the delay between the application of ECH <strong>and</strong> the start<br />
of the rise of the calculated emission can be compared with experiment.<br />
This delay rj is plotted for two values of Xe as the dashed lines in Fig. 4a.<br />
It is clear from the figure that rj is sensitive to the value of Xe used in<br />
the calculation, <strong>and</strong> that the value for Xe of 2.5 times that of the ohmic<br />
heating phase is a good fit to the data. This implies that the magnitude<br />
of the thermal conductivity as determined by heat pulse propagation is<br />
close to that determined by analysis of the final steady state, <strong>and</strong> that<br />
the increase in Xe from ohmic to ECH occurs throughout the plasma on<br />
the time-scale of the heat pulse propagation.<br />
The overdense ECH discharges have also been analyzed using the<br />
ONETWO code, although Te profiles from electron cyclotron emission<br />
are not available, due to cutoff of the 2wce radiation. In order to proceed<br />
with analysis, the thermal conductivity is assumed to be spatially constant<br />
<strong>and</strong> the Te profile is calculated (assuming a boundary temperature<br />
Teb). Following the conclusion from Fig. 4b that the heat propagates inward,<br />
the ECH power is modeled as being deposited near r/a=0.8. The<br />
requirement that the central temperature <strong>and</strong> the total plasma energy<br />
match the experiment places a constraint on the Te(r) shape, with the<br />
principal uncertainty coming from the ion transport (mainly through the<br />
assumed value of Xi) <strong>and</strong> from the uncertainty in Teb- If the calculated<br />
electron temperature profile is parameterized for convenience of discussion<br />
as Te(r) = (Te0 - Teb)(l - r 2 /a 2 ) QT + Teb, <strong>and</strong> assuming Teb=0.2<br />
keV, this constraint places the limits 2.0 < ax < 2.5 on the profile parameter,<br />
which means that the Te profile remains rather peaked during<br />
the ECH. Lower Teb produces fits with smaller ax, but even Teb = 0<br />
implies that ax > 1.5, in order for the plasma energy to match experiment.<br />
The conclusion that the electron temperature profile remains<br />
rather peaked is also consistent with the determination of the internal<br />
inductance, £i « 1.5, which doesn't change much during the ECH.<br />
The value of the average Xe determined from this simplified treatment<br />
is about 1 m 2 /sec during ohmic heating, <strong>and</strong> during ECH it decreases<br />
a factor two to 0.5 m 2 /sec. Although Fig. 4b clearly shows propagation<br />
of the heat pulse toward the plasma center, comparison with the<br />
model is considerably complicated by the process of the dissipation of<br />
the Marfe, which takes about 6 msec. In addition, for the model the determination<br />
of Td for locations near the plasma center is ambiguous, due<br />
to smearing out of the leading edge of the heat pulse. Nevertheless, it<br />
may be concluded from Fig. 4b that the thermal diffusivity determined<br />
from heat propagation is not larger than that during the ohmic phase.
DISCUSSION AND SUMMARY<br />
<strong>IAEA</strong>-CN-47/F-III-3 595<br />
In the overdense heating case, the central energy confinement time<br />
improves dramatically. The behavior of both the sawtooth period <strong>and</strong><br />
the SXR emission imply that the ECH power is not being deposited<br />
near the resonance at the plasma center, in violation of the dispersion<br />
relation, but rather that the plasma edge is being heated. The drop in<br />
the loop voltage from 2 V prior to ECH to 0.8 V during ECH, Fig. lc,<br />
indicates that the ohmic power decreases at the plasma center; however,<br />
the classical skin time is longer than the ECH pulse length, <strong>and</strong> the<br />
plasma modeling for this case indicates that a central voltage drop to<br />
1.3 V takes place at the plasma center during ECH. But the measured<br />
central density is constant <strong>and</strong> the central electron temperature increases<br />
from about 0.5 keV to 0.8 keV. These observations imply that the central<br />
energy confinement time increases from 70 msec before ECH to 190 msec<br />
during ECH.<br />
A similar conclusion may be reached concerning the plasma within<br />
r/a=0.7: the confinement time for this volume of plasma increases by a<br />
factor 2 to 2.5, with the caveat that the electron temperature profile is<br />
only inferred from the measurement of central temperature <strong>and</strong> of total<br />
plasma energy. The conclusion that confinement strongly improves is<br />
not very sensitive to the details of the electron temperature profile, but<br />
depends mainly on the absence of ECH power within r/a=0.7 [7].<br />
Shifting the location of the resonance by changing Bx for underdense<br />
plasma produces a similar effect. Over the range 1.8 < Bx < 2.5 T,<br />
for which the resonance moves from r/a = —0.5 to +0.5, the global energy<br />
confinement is constant [2]. (This result has also been seen in T-10<br />
ECH experiments [13].) This implies improvement in the central energy<br />
confinement as the heating is moved off axis. Neutral beam heating<br />
experiments on TFTR [14] <strong>and</strong> ASDEX [15] have also shown similar<br />
results when the depth of the neutral beam penetration is reduced by<br />
operating with high plasma density or reduced beam energy. In those<br />
cases, a very long energy confinement time near the axis was observed.<br />
The high density heating case reported here with power deposition at<br />
r/a > 0.7 may correspond to an extreme case of these results.<br />
The physical bases behind these observations are not well understood.<br />
It is possible that a heat diffusivity which is dependent on the<br />
gradient in Te may account for this behavior. A heat diffusivity which<br />
is proportional to (VTe) 2 has been derived [16], <strong>and</strong> this strong dependence<br />
on the profile could result in the observed independence of the<br />
increase in stored energy on the profile of the heating/ At the same<br />
time, it is observed that the transition to H-mode is closely associated
596 PRATER et al.<br />
with changes in the plasma edge. It may be that direct edge heating<br />
is an important ingredient in the mix of conditions that produces the<br />
H-mode. Experiments aimed at edge heating in DIII-D at low density<br />
using second harmonic ECH are planned to try to clarify this.<br />
ACKNOWLEDGMENT<br />
This work was supported jointly by the U.S. Department of Energy<br />
<strong>and</strong> by the Japanese Atomic Energy Research Institute under Contract<br />
Nos. DE-AT03-84ER51044 <strong>and</strong> DE-AT03-80SF11512. We would like<br />
to thank T. Ohkawa <strong>and</strong> D. Overskei for their encouragement during<br />
this work. ECH engineering support from D. Remsen <strong>and</strong> D. Bell <strong>and</strong><br />
operational support from R. Callis <strong>and</strong> his group are also gratefully<br />
acknowledged.<br />
REFERENCES<br />
[1] WAGNER, F., et al., Phys. Rev. Letters 49 (1983) 1408.<br />
[2] PRATER, R., BURRELL, K.H., EJIMA, S., JAHNS, G.L., LIN, S.H.,<br />
MOELLER, C.P., Summary of Electron Cyclotron Heating Physics Results<br />
from the Doublet III Tokamak, GA Technologies Report GA-<br />
A17939 (1985).<br />
[3] MOELLER, C.P., PRATER, R., LIN, S.H., The 60 GHz Transmission<br />
System for the Doublet HI ECH Experiment, GA Technologies Report<br />
GA-A16979 (1983).<br />
[4] KRITZ, A.H., HSUAN, H., GOLDFINGER, R.C., BATCHELOR,<br />
D.B., Proc. 3rd Joint Varenna-Grenoble International Symposium on<br />
Heating in Toroidal Plasmas, Grenoble (Euratom Report EUR7979 EN),<br />
v. H (1982) 707.<br />
[5] LIPSHULTZ, B., LABOMBARD, B., MARMAR, E.S., PICKRELL,<br />
M.M., TERRY, J.L., et al., Nud. Fusion 24 (1984) 977.<br />
[6] OHYABU, N., BURRELL, K.H., DeBOO, J., EJIMA, S., GROEB-<br />
NER, R., et al., Nucl. Fusion 25 (1985) 49.<br />
[7] EJLMA, S., PRATER, R., Interpretation of Electron Cyclotron Heating<br />
Results in Overdense Plasma in Doublet III, GA Technologies Report<br />
GA-A18535 (1986), submitted to <strong>Nuclear</strong> Fusion.<br />
[8] McGUIRE, K., ROBINSON, D.C., Nucl. Fusion 19 (1979) 505.<br />
[9] ALIKAEV, V.V., RAZUMOVA, K.A., in Course <strong>and</strong> Workshop on<br />
<strong>Applications</strong> of RF Waves to Tokamak Plasmas (International School of<br />
Plasma Physics, Italy EUR 10333 EN), v. I (1985) 377.<br />
[10] PFEIFFER, W., et al., GA Technologies Report GA-A16178 (1980).
<strong>IAEA</strong>-CN-47/F-III-3 597<br />
[11] CHANG, C.S., HINTON, F.L., Phys. Fluids 25 (1982) 1493.<br />
[12] BURRELL, K.H., PRATER, R., EJIMA, S., et al., in Plasma<br />
Physics <strong>and</strong> Controlled <strong>Nuclear</strong> Fusion Research (Proc. 10th Int. Conf.<br />
London, 1984), <strong>IAEA</strong>, Vienna, v. I (1985) 131.<br />
[13] ALIKAEV, V.V., ARSENTIEV, Yu.L, BAGDASAROV, A.A., BERE-<br />
ZOVSKIJ, E.L., BORSHEGOVSKIJ, A.A., et al., in Plasma Physics<br />
<strong>and</strong> Controlled <strong>Nuclear</strong> Fusion Research (Proc. 10th Int. Conf. London,<br />
1984), <strong>IAEA</strong>, Vienna, v. I (1985) 419.<br />
[14] MURAKAMI, M., ARUNASALEM, V., BELL, J.D., BELL, M.G.,<br />
BITTER, M., et al., Plasma Physics <strong>and</strong> Controlled Fusion 28 (1986)<br />
17.<br />
[15] WAGNER, F., GRUBER, O., LACKNER, K., MURMANN, H.D.,<br />
SPETH, E., et al., Phys. Rev. Letters 56 (1986) 2187.<br />
[16] GUZDAR, P.N., LIU, C.S., DONG, J.Q., LEE, Y.C., Bull. Am.<br />
Phys. Soc. 31 (1986) 1100.<br />
DISCUSSION<br />
R.J. GOLDSTON: There is an inductive term in the power balance of the form<br />
V4 Ip(d/dt)Lj. L, can be measured from MHD fitting, or from a combination of<br />
MHD fitting <strong>and</strong> diamagnetism in a high density isotropic plasma. Could you comment<br />
on the size of this inductive term?<br />
R. PRATER: This term is quite small since very little change is found in the<br />
internal inductance during ECH, even with off-axis heating.
<strong>IAEA</strong>-CN-47/F-III-4<br />
ELECTRON CYCLOTRON HEATING ON TFR<br />
H.P.L. DE ESCH, J.A. HOEKZEMA, W.J. SCHRADER,<br />
E. WESTERHOF, W. KOOIJMAN, R.W. POLMAN, T.J. SCHEP<br />
Association Euratom-FOM,<br />
FOM Instituut voor Plasmafysica,<br />
Rijnhuizen, Nieuwegein, Netherl<strong>and</strong>s<br />
EQUIPE TFR<br />
Association Euratom-CEA sur la fusion,<br />
CEA, Centre d'etudes nucle'aires de Cadarache,<br />
Saint-Paul-lez-Durance, France<br />
Presented by M.A. Dubois<br />
Abstract<br />
ELECTRON CYCLOTRON HEATING ON TFR.<br />
Results are presented of the joint Euratom-CEA, Euratom-FOM electron cyclotron heating<br />
experiments on TFR (March 1985 to June 1986). Up to 500 kW of 60 GHz power was launched into<br />
TFR; with central heating, a central electron temperature up to 5 keV was obtained.<br />
1. INTRODUCTION<br />
The ECRH facility on TFR comprised three 60 GHz gyrotrons,<br />
each delivering over 200 kW for 100 ms in the TEQ2-mode.<br />
In the three transmission lines conversion to TE-| -| was realized<br />
with an efficiency of approximately 70$ (0-mode into TFR over<br />
gyrotron output) [1]. The open oversized waveguide antennae<br />
were located in the same poloidal cross-section, in the horizontal<br />
plane <strong>and</strong> at + <strong>and</strong> -15°, <strong>and</strong> were aimed at the toroidal<br />
axis [1]. The full 3 dB beam width on axis was about 3 cm.<br />
Facing two of the antennae was a concave corrugated reflector<br />
(10° oblique), converting transmitted power into the extraordinary<br />
mode at 20° off the meridian plane. The third, upper,<br />
antenna had a 16° angle with the meridian plane.<br />
Experiments began in March 1985 with one gyrotron at<br />
100 kW, 30 ms with a smooth, concave, roof-top-shaped reflector<br />
(angles ± 10°) on the inboard torus wall [2]. Full power<br />
(500 kW into TFR for 100 ms) experiments were done between<br />
September 1985 <strong>and</strong> June 1986 [3,4,5]. TFR was operated with<br />
carbon limiters. The parameters in the ohmic regime varied over<br />
the range:<br />
B(0) = 1.8 to 2.7 T; ne(0) = (1 to 5)*10 1 9 m~3; Ip = no to 160 kA<br />
599
600 DE ESCH et al.<br />
Under iron-free plasma conditions, two ohmic regimes<br />
were obtained: At low plasma current ('L.C : Ip < 105 kA) no<br />
MHD activity was observed <strong>and</strong> TE > 8 ms, while at high current<br />
('H.C: Ip > 105 kA) strong saturated MHD activity coincided<br />
with ig 1 5 ms. When iron was present (due to a calorimeter in<br />
the shadow of the limiter), the iron-dominated regime OLD. 1 )<br />
showed no such clearcut differences with Ip, <strong>and</strong> MHD, when<br />
present, tended to be erratic or explosive.<br />
2. HEATING<br />
When the resonance is located near the magnetic axis,<br />
for average ohmic plasma parameters 60-70? of the power should<br />
theoretically be absorbed in the first pass. Because of Te<br />
increase during ECRH, this figure should rise over 90?. Measurements<br />
of the transmitted power, using small holes in the<br />
mirror, indicate that at least the expected absorption takes<br />
place. For the -rE-calculation, we have assumed that the total<br />
injected power is absorbed. This is probably slightly pessimistic<br />
since over 10? of the power is injected in the X-mode.<br />
When the resonance is set off-centre, a large fraction of the<br />
power is transmitted through the plasma. Especially at low<br />
densities, the reflected, X-mode power is mostly absorbed by<br />
suprathermal electrons, for which confinement can be completely<br />
different from that of the bulk. Experimentally it is found<br />
that the increase of plasma energy (not counting a possible<br />
suprathermal population) has a maximum around central heating<br />
<strong>and</strong> falls abruptly when the resonance is displaced off-centre<br />
by more than a/3. This is illustrated in Fig. 1, which is valid<br />
irrespective of the regime (although in the I.D. regime the<br />
off-centre displacement was limited to +_ a/3 due to disruptions<br />
[4]).<br />
For central heating, the degradation of confinement with<br />
ECRH power in the different regimes is shown in Fig. 2 for<br />
intermediate density. It is clear that in the L.C. regime the<br />
confinement is substantially degraded even with a small amount<br />
of additional heating; with ECRH, the difference between the<br />
regimes disappears. At lower density, the degradation of energy<br />
confinement is much less (apart from the disappearance of the<br />
L.C. regime): confinement may even improve, while at higher<br />
densities the degradation is worse. This is due for a large<br />
part to density behaviour: at high density, a strong pump-out<br />
is observed in the centre, while at low density an increase of<br />
density is seen. Combining discharges at different densities in<br />
the ohmic phase to obtain the Tg-value at constant density for<br />
different power levels, we find only a limited reduction of Tg<br />
(Fig. 2).
800<br />
BOO -<br />
400<br />
°- 200 -<br />
<strong>IAEA</strong>-CN-47/F-III-4 601<br />
-0.2 0.0 0.2<br />
R ECRH- R o<br />
FIG. 1. Plasma kinetic energy (Te from Thomson scattering) as a Junction of resonance layer position<br />
/ = 90 kA, nJO) - 2 x 10 19 m~ 3 , PECRH = 250 kW, Pa = 110 kW (without ECRH).<br />
10<br />
4<br />
6 -<br />
]'r—<br />
2 -<br />
i<br />
i<br />
i<br />
= \<br />
^ ^<br />
i<br />
i<br />
—B— ——.<br />
i<br />
—<br />
i<br />
i<br />
—Q<br />
0 1 2 3 4 5 6 7<br />
*" P ERCH<br />
FIG. 2. Energy confinement time as a function of centrally deposited ECRH power in three different<br />
regimes, at ne - (1-1.5) x 10 19 m~ 3 :<br />
• L.C., Ip = lOOkA<br />
v H.C., lp = 115 kA<br />
o ID.<br />
• ID. at constant central density: ne(0) = 2.8 X 10 19 m~ 3 .<br />
i<br />
O<br />
1<br />
'-i<br />
-
602 DE ESCH et al.<br />
Transport simulations using the MAKOKOT code were<br />
presented [4,5] with the conclusions that with ECRH, Xe~ scalln 8<br />
is proportional to rTe'2/(n.q ) <strong>and</strong> that the pump-out can be<br />
explained by a combination of the rTg'Wn.q.) dependence of the<br />
diffusion coefficient, the decrease of the neoclassical pinch<br />
velocity, <strong>and</strong> enhanced recycling. Besides, the energy confinement<br />
time dependence with injected power is well described by<br />
this scaling. Simulations with the ICARUS code have also been<br />
performed, <strong>and</strong> a very good agreement is obtained both at high<br />
<strong>and</strong> low density in the I.D. regime for<br />
see Fig. 3- This Xe~P r °fil e i- s ver> y close to twice the value<br />
proposed by TANG [6].<br />
At low density where diffraction of the ECRH beam in the<br />
plasma is weak, a very high central temperature (Te up to 5 keV<br />
as measured by Thomson scattering <strong>and</strong> ECE) is obtained in a<br />
narrow central spike, too narrow for the ECE spatial resolution.<br />
Using discharges with the resonance on the magnetic axis<br />
but at slightly different horizontal positions, a fine central<br />
Te-profile was obtained from the central channel of Thomson<br />
scattering: Fig. 1.<br />
The width of the central Te-spike (3 cm) is in agreement<br />
with the antenna pattern. The height of the spike indicates<br />
that confinement inside q=1 is degraded but, despite the very<br />
large VTe, not dramatically. The inequality R'VTe S 13 keV is<br />
fulfilled outside q=1 , as proposed in [7], but much larger<br />
gradients can be obtained inside q=1. This is a strong incentive<br />
to stabilize sawteeth on larger machines where the energy<br />
content inside q=1 is considerable.<br />
In our experiment, although gradients inside q=1 can<br />
reach very high values, sawteeth are not very conspicuous: even<br />
when Te(0) is larger than 3 keV, the sawtooth drop 6Te(0) is<br />
less than 700 eV: the temperature is not flattened completely<br />
inside q=1. When heating is applied outside q=1, sawteeth are<br />
not affected. When heating is applied in the centre, sawteeth<br />
are also unaffected, except at high density, in which case the<br />
period decreases. More interesting is sawtooth behaviour when<br />
the ECRH layer is at the radius of the surface q=1: in those<br />
conditions, an increase of the sawtooth period is observed,<br />
corresponding to a larger delay between m=1 growth <strong>and</strong> internal<br />
disruption: the crash is triggered for a larger isl<strong>and</strong> size<br />
than in ohmic regimes. At high density, sawteeth can disappear,<br />
replaced by a saturated m=1 mode. This behaviour can be attributed<br />
to a local modification of the Te(r)- (<strong>and</strong> hence j(r)-)<br />
profile. It is a direct effect on the sawtooth trigger <strong>and</strong> not<br />
a mere modification of the regeneration slope as in other<br />
experiments.
2.0<br />
<strong>IAEA</strong>-CN-47/F-III-4 603<br />
0.0<br />
0.00 0.05 0.10 0.15 0.20<br />
>• r (m)<br />
FIG. 3. Electron temperature profiles in the Ohmic regime <strong>and</strong> witkfitll ECRH power at high density<br />
(ne = 2.2 x lO 19 m~ 3 ) in the I.D. regime <strong>and</strong> resonance located at the centre:<br />
—ECE<br />
Thomson scattering<br />
profiles from transport code simulation (ICARUS).<br />
0.00<br />
FIG. 4. Thomson scattering Te profile (for a low-density discharge (ne = 0.8 x 10 19 m 3 ) at full<br />
central ECRH (o) <strong>and</strong> with ohmic heating only (+).
604 DE ESCH et al.<br />
An estimate of the ECRH deposition profile can be<br />
obtained from a measurement of the immediate change of the<br />
local Te after ECRH switch-on. The soft X-ray emission profile<br />
was used to determine this profile <strong>and</strong> confirms the localization,<br />
in case of central heating, mainly within a radius of<br />
2 cm. Analysis of heat pulse propagation experiments is not yet<br />
completed <strong>and</strong> will be published later on.<br />
3- IMPURITY BEHAVIOUR<br />
With central heating, no deleterious effect in impurity<br />
production is observed during ECRH. A slight enhancement of<br />
metal production is suspected from preliminary numerical<br />
simulations, but lower than 50$. Highly ionized ion lines (e.g.<br />
Fe XXIII) appear during ECRH, indicating increased ionization<br />
degree as a consequence of the strong electron heating. When<br />
the ECRH layer is far off-centre, B - 1 .8 T or B - 2.4 T<br />
(2.14 T = central heating) strong increase of line radiances is<br />
observed implying increased central ion densities by a factor<br />
of - 2 for light impurities <strong>and</strong> - 2 to 3 for metal impurities,<br />
probably as a result of transmitted power.<br />
4. STABILIZATION<br />
In the H.C. regime, where in the ohmic regime saturated<br />
m=2 modes are present, application of microwave power has been<br />
shown able to suppress the q=2 tearing mode in two different<br />
situations:<br />
- when the resonance is applied on the magnetic axis: energy<br />
increase leads to an outward shift <strong>and</strong>, contact with the<br />
inner llmiter being reduced, the q=2 mode disappears as qa<br />
increases. In some cases where low-power ECRH was applied in<br />
comb-like pulses, stabilization was obtained without a marked<br />
outward shift, but coincided with a better horizontal position<br />
regulation induced by ECRH: here also, interaction with<br />
the limiter was reduced.<br />
- when the power is applied just outside the q=2 surface [2,3].<br />
the mode is also suppressed. The absorbed power is very small<br />
<strong>and</strong> does not directly explain an outward shift. Two explanations<br />
are then possible: 1) local temperature gradient<br />
modification leads to a j(r) change <strong>and</strong>, hence, to tearingmode<br />
stabilization. The subsequent confinement improvement<br />
allows ohmic heating to increase the particle <strong>and</strong> energy<br />
content, leading to outward shift; 2) the non-absorbed power<br />
falls on the vacuum vessel, causing enhanced degassing <strong>and</strong>,<br />
consequently, a density <strong>and</strong> energy increase, which leads to<br />
an outward shift <strong>and</strong> subsequent stabilization. A careful<br />
analysis shows that m=2 activity starts to decrease as soon
<strong>IAEA</strong>-CN-47/F-III-4 605<br />
as qa rises above a critical value (- 3.3) <strong>and</strong> rises again<br />
when qa drops below a sometimes different value (3.1 to 3.3).<br />
If the current is too high, the change of qa induced by ECRH<br />
is too small to cross this value, <strong>and</strong> MHD activity persists.<br />
So, although stabilization has been routinely achieved with<br />
ECRH, <strong>and</strong> even with a feedback loop C3], we are led to<br />
conclude that at least when the mode-converting mirror was in<br />
use, the first mechanism is occulted by the second, which is<br />
of less physical interest. A better prospect will be open<br />
with larger machines at higher densities <strong>and</strong> temperatures.<br />
5. SUPRATHERMAL GENERATION AND PELLET ABLATION<br />
Creation of suprathermal electrons has been demonstrated<br />
at low densities. As previously mentioned, they outlast the<br />
ECRH pulse [2], showing the good quality of confinement inside<br />
q=1. In low-density regimes, even a short ECRH pulse can<br />
trigger the discharge to a suprathermal 2wce emission regime.<br />
For ne(0) below 1.5x1O 1 9 m"3, the ECE is completely dominated<br />
by suprathermals; between 1.5 <strong>and</strong> 2.5x10 l 9 m~3 ECE profiles<br />
show an asymmetry which is most likely due to suprathermal<br />
trapped electrons. Above, the ECE <strong>and</strong> Thomson-scattering<br />
Te-profiles are similar.<br />
A natural step was to try current-drive experiments with<br />
ECRH. The result [3] is negative: all the effects observed<br />
between 2.14 <strong>and</strong> 2.40 T are explainable by the resistivity<br />
decrease due to bulk heating. At higher fields, no effect is<br />
observed. As has been explained previously [5] this negative<br />
result is likely to be due to a depletion effect of the electron<br />
distribution function when the resonance is applied far<br />
from the bulk of the maxwellian. This depletion effect at<br />
intermediate energies, seen on the SiLi diagnostic <strong>and</strong> confirmed<br />
in numerical simulations, is accompanied by population<br />
increase at higher energies, mainly in the perpendicular<br />
direction, which is responsible for the suprathermal 2u)ce<br />
emission. A direct evidence for this very energetic tail is the<br />
behaviour of deuterium pellets injected into ECRH-heated<br />
plasmas: they are sublimated differently than in normal ablation<br />
cases, <strong>and</strong> the radius at which they are sublimated is<br />
directly linked to the ECRH layer.<br />
ACKNOWLEDGEMENT<br />
The Netherl<strong>and</strong>s' contribution to this work was performed<br />
under the Euratom-FOM association agreement with financial<br />
support from ZWO <strong>and</strong> Euratom.
606 DE ESCH et al.<br />
REFERENCES<br />
[1] VAN DER GEER, C.A.J., et al., <strong>and</strong> CRENN, J.P., et al., in Fusion Technology (Proc. 14th<br />
Symp. Avignon, 1986), Pergamon Press, Oxford (1987).<br />
[2] FOM-ECRH TEAM <strong>and</strong> TFR GROUP, in Controlled Fusion <strong>and</strong> Plasma Physics (Proc. 12th<br />
Europ. Conf. Budapest, 1985), Vol. 9F-II, European Physical Society (1985) 60.<br />
[3] TFR-GROUP, HOEKZEMA, J.A., et al., in Electron Cyclotron Emission <strong>and</strong> Electron Cyclotron<br />
Resonance Heating (Proc. 5th Int. Workshop San Diego, CA, 1985) 154.<br />
[4] TFR-GROUP <strong>and</strong> FOM-ECRH-TEAM, in Controlled Fusion <strong>and</strong> Plasma Heating (Proc. 13th<br />
Europ. Conf. Schliersee, 1986), Vol. 2, European Physical Society (1986) 207.<br />
[5] JACQUET, L, PAIN, M., ibid., p. 215.<br />
[6] TANG, W.M., Microinstabilities Based Confinement Model for Enhanced Transport, Rep.<br />
PPPL-2311, Princeton Plasma Physics Laboratory (1986).<br />
[7] TFR GROUP, Plasma Phys. Controll. Fusion 28 (1986) 85.<br />
DISCUSSION<br />
A. GIBSON: Is there any threshold power for the sawtooth stabilization which<br />
you describe, <strong>and</strong> are you able to compare the power required for stabilization with<br />
any theoretical expectation?<br />
M.A. DUBOIS: A strong effect was observed even when one gyrotron only was<br />
used with ECRH on q = 1 (power ~ 150 kW). We did not try to use a lower power<br />
level. I do not expect any threshold, but rather a linear relationship at low power,<br />
namely, the increase in the sawtooth period is approximately equal to the ECRH<br />
power.<br />
A.C. RIVIERE: In connection with the observation of a narrow high peak in<br />
Te for central resonance, how far did you have to move the resonance off axis so<br />
that this steep narrow peak in Te disappeared? Further, how important were the<br />
sawtooth oscillations for these measurements?<br />
M.A. DUBOIS: The peak was maximum <strong>and</strong> narrowest for central heating, but<br />
a really visible peak existed as long as ECRH was applied inside q = 1.<br />
With regard to your second question, the maximum amplitude we observed was<br />
less than 600-700 eV, <strong>and</strong> usually it was much less. A considerable peak subsisted<br />
after the sawtooth crash, showing that the flattening of the temperature profile was<br />
far from being complete.
<strong>IAEA</strong>-CN-47/F-III-5<br />
INVESTIGATION OF PLASMA FORMATION<br />
REGIMES FOR ICRF HEATING EXPERIMENTS<br />
IN THE TUMAN-3 TOKAMAK<br />
WITH MAGNETIC COMPRESSION<br />
L.G. ASKINASI, N.E. BOGDANOVA, V.E. GOLANT,<br />
S.G. GONCHAROV, M.P. GRYAZNEVICH,<br />
V.V. D'YACHENKO, A. IZVOZCHIKOV, E.R. ITS,<br />
S.V. KRIKUNOV, S.V. LEBEDEV, B.M. LIPIN, I.P. PAVLOV,<br />
G.T. RAZDOBARIN, V.V. ROZHDESTVENSKIJ,<br />
N.V. SAKHAROV, M.A. KHALILOV, F.V. CHERNYSHEV,<br />
K.G. SHAKHOVETS, O.N. SHCHERBIN1N<br />
A.F. Ioffe Physico-Technical Institute,<br />
Leningrad<br />
S.E. BENDER, Yu.A. KOSTSOV, R.N. LITUNOVSKIJ,<br />
O.A. MINYAEV, E.N. RUMYANTSEV, P.P. TEPLOV<br />
D.V. Efremov Scientific Research Institute<br />
of Electrophysical Apparatus,<br />
Leningrad<br />
Union of Soviet Socialist Republics<br />
Presented by O.S. Pavlichenko<br />
Abstract<br />
INVESTIGATION OF PLASMA FORMATION REGIMES FOR ICRF HEATING EXPERIMENTS<br />
IN THE TUMAN-3 TOKAMAK WITH MAGNETIC COMPRESSION.<br />
The effect of fast current increase on the plasma parameters is studied. A remarkable increase<br />
in the peripheral density <strong>and</strong> a growth of MHD activity are observed. During the current rise period<br />
for a low magnetic field, Thomson scattering measurements yield hollow electron temperature distributions,<br />
which are rapidly transformed into a peaked distribution just after the current maximum. The<br />
method of plasma formation studied leads to stable discharges with a low safety factor, q(a) = 2.<br />
Experimental data on ICR heating with P < 0.5 MW in a plasma formed by a fast current rise are<br />
reported. A simultaneous increase in the ion temperature by a factor of 1.4 <strong>and</strong> in the density by a factor<br />
of 1.7 are recorded during the RF pulse.<br />
607
608 ASKINASI et al.<br />
1. INTRODUCTION<br />
The first experiments on fast current increase after magnetic compression were<br />
carried out in the TUMAN-3 tokamak in 1983 [1]. The experiments were mainly<br />
devoted to an evaluation of the time needed for the current to penetrate into the<br />
plasma core, but the conclusion that anomalously quick skin current dissipation takes<br />
place could not be considered to be very reliable without any detailed measurements<br />
of the electron temperature. In contrast to our data, later TFTR [2] <strong>and</strong> JET [3]<br />
results have shown that the rate of current density redistribution corresponds to the<br />
classical Spitzer resistivity. The experiments [1] have also demonstrated the influence<br />
fast current input has on the main plasma characteristics. For example, the ion<br />
temperature was 1.5 times higher than the temperature measured in a quasi-stationary<br />
Ohmic discharge with the same values of Ip, BT, <strong>and</strong> n [4].<br />
The new set of measurements described in this paper aimed at studying the<br />
mechanism of additional current penetration <strong>and</strong> the time evolution of the electron<br />
temperature profiles during current rise. A plasma column that was separated from<br />
the wall was formed by a rapid shift along the major radius (R-compression) [5],<br />
whereas, in previous experiments, minor radius compression had been used. The<br />
plasma obtained in this way is supposed to be used as an initial plasma in ICRF<br />
heating experiments.<br />
2. EXPERIMENT<br />
The main diagnostics used for recording the plasma parameters are as follows:<br />
a microwave interferometer (X = 2 mm) 'looking' through the plasma along ten<br />
vertical chords, a Thomson scattering apparatus including ruby laser <strong>and</strong> polychromator<br />
with four space points, five energy channel neutral particle analysers<br />
capable of recording charge exchange fluxes within +16 cm from the equatorial<br />
plane. In addition, measurements of soft X-rays, vacuum spectral line intensities,<br />
radiation losses <strong>and</strong> several electromagnetic parameters were performed.<br />
The time behaviour of the plasma parameters in a discharge with fast current<br />
increase is shown in Fig. 1. At the initial stage, the plasma is formed near the outer<br />
chamber wall. According to the magnetic flux measurements, the discharge axis is<br />
at R = 61cm (Fig. l(b)). The low field side limiter is placed at the radius<br />
R = 75 cm, the high field side limiter at the radius R = 31 cm. The plasma current<br />
Ip = 43 kA (Fig. l(a)), the average density n = 0.6 X 10 l3 cur 3 (Fig. l(d)), the<br />
ion temperature Ts(0) = 100 eV (Fig. l(e)). At 25 ms, a specially programmed<br />
equilibrium control system moves the plasma column to the radius R = 53 cm,<br />
during 1.5 ms. At 25.5 ms, switching on an additional capacitor battery provides a<br />
plasma current rise up to 120 kA during 4 ms. Then, the current decreases at a rate<br />
that corresponds approximately to the decay of the toroidal field (Fig. l(c)). The<br />
evolution of the plasma parameters was studied for two values of the toroidal field:<br />
BT(0) = 5 kG (Fig. 1) <strong>and</strong> BT(0) = 7 kG (Fig. 2).
so<br />
55<br />
50<br />
100<br />
Tt(el/)<br />
<strong>IAEA</strong>-CN-47/F-m-5 609<br />
BT = 5 kG<br />
/0 40 50 t(ms)<br />
FIG. I. Time behaviour of different plasma parameters in discharge with fast shift <strong>and</strong> current rise at<br />
BT(0) = 5 kG.<br />
The interferometer data yield the chord distributions of the plasma density<br />
at different times (Fig. 3). A comparison between the positions of the n,i(R)<br />
maxima <strong>and</strong> the values of the major radius R obtained from magnetic measurements<br />
demonstrates sufficient accuracy of the electromagnetic diagnostics, even for a<br />
significant column shift. This enables the use of electromagnetic diagnostics in the<br />
equilibrium control system.<br />
3. RESULTS<br />
The current rise disturbs the plasma parameters substantially. During the time<br />
interval from 25 to 32 ms, the total number of particles, N, increases by a factor of<br />
1.7 in discharges with BT(0) = 5 kG <strong>and</strong> by a factor of 1.4 in discharges with
610<br />
ss<br />
so<br />
55<br />
a<br />
s<br />
t<br />
2<br />
e<br />
4<br />
z<br />
200<br />
ISO<br />
{00<br />
50<br />
H(cm)<br />
nel(/0"cm'*)<br />
ASKINASI et al.<br />
BT = 7 kG<br />
(0 30 40 SO SO tfms)<br />
FIG. 2. Time behaviour of different plasma parameters in discharge with fast shift <strong>and</strong> current rise at<br />
BT(0) = 7kG.<br />
\\ BT = 5 kG<br />
35 «5 SS 65 75 a (cm) SS *S 55 65 75<br />
FIG. 3. Chord distributions of density during current rise at Bj(0) = 5 kG <strong>and</strong> B-rfO) = 7 kG.<br />
Curve 1: 25 ms, curve 2: 32 ms, curve 3: 41 ms, curve 4: 32 ms of discharge with major radius<br />
compression without current rise.
10<br />
1.6<br />
1,2<br />
0,i<br />
0,4<br />
BT = 5 kG<br />
<strong>IAEA</strong>-CN-47/F-III-5 611<br />
lo<br />
1.6<br />
a<br />
0,6<br />
OA<br />
BT = 7 kG<br />
20 r(cm) 10 IS 20 p(cm)<br />
FIG. 4. Radial distributions of density, obtained by Abel inversion of profiles in Fig. 3. Curve a:<br />
25 ms, curve b: 32 ms, curve c: 32 ms of discharge with major radius compression without current rise.<br />
BT(0) = 7 kG (Fig. 3). For the sake of comparison, curve 4 (Fig. 3) presents the<br />
chord distribution of the density in the plasma after major radius compression without<br />
current rise. N is only 15% higher than at the initial stage. It should be noted that<br />
the increase in the total number of particles is mainly due to an increase in the<br />
peripheral density (see the radial profile in Fig. 4). The ion temperature also<br />
increases during the current rise as is shown by curves e in Figs 1 <strong>and</strong> 2. Particularly<br />
fast ion heating was observed in the case of low magnetic field.<br />
Of great interest is the time evolution of the electron temperature profiles,<br />
which can yield the localization of the heat source in the plasma <strong>and</strong>, therefore,<br />
provides indirect information on the current distribution. Figure 5 shows electron<br />
temperature profiles measured in a discharge with BT(0) = 5 kG at different times.<br />
The most striking feature of the profiles obtained on the current front at 1 <strong>and</strong> 3 ms<br />
after the start is the noticeable rise in Te at medium radius, whereas the central<br />
temperature is virtually the same as at the initial stage. Then, the Te profile is<br />
flattened (t = 6 ms <strong>and</strong> t = 11 ms) <strong>and</strong> later on becomes-peaked (t = 16 ms). The<br />
evolution of Te(r) at BT(0) = 7 kG does not show any hollow distributions (Fig. 6).<br />
The fact of a weaker plasma disturbance, in this case, is also confirmed by a lower<br />
loop voltage: Up (B = 7 kG) = 2.5-3 V, Up (B = 5 kG) = 3.0-4.0 V.<br />
4. DISCUSSION<br />
The experiments have demonstrated the possibility of rapid current input into<br />
a tokamak (dl/dt = 25 MA-s" 1 ). The current rise time (4 ms) is substantially<br />
shorter than the classical time of current penetration into the central part of the plasma
612<br />
ASKINASI et al.<br />
3 10 IS 10 rfcm)<br />
BT = 5 kG<br />
FIG. 5. Evolution of electron temperature profile during current rise at BT = 5 kG.<br />
too<br />
BT = 7 kG<br />
5 10
IS 10<br />
<strong>IAEA</strong>-CN-47/F-III-5 613<br />
FIG. 7. Radial profile of ion temperature during current rise at BT = 5 kG.<br />
column. In spite of strong MHD activity during the front of current rise, it is possible<br />
to obtain a stable plasma with a low safety factor. At maximum current,<br />
Ip = 127 kA, major radius R = 53 cm, toroidal field BT(0) = 5 kG, the value of q<br />
at the limiter was equal to 1.7, without toroidal correction. With the correction<br />
included, we find q(a) = 2.<br />
The data show that a narrow electron temperature profile with cold periphery<br />
is necessary for a current rise to take place. Profiles of this kind may be obtained<br />
by minor radius compression [1] or by major radius compression such as in the recent<br />
experiments. This conclusion is confirmed by the fact that attempts to increase the<br />
current in the plasma after a smaller shift or without any shift have ended with disruptions<br />
in virtually all cases. A more detailed analysis is needed to underst<strong>and</strong> the<br />
mechanism of current density profile redistribution. An MHD stability analysis of the<br />
current density profiles obtained from a neo (r) as well as from transport simulation is<br />
in progress now.<br />
As was mentioned above, discharges at a stronger longitudinal field,<br />
BT(0) = 7 kG, are disturbed by current rise to a lesser extent than at<br />
BT(0) = 5 kG. Only 10% of the discharges ended with a large disruption near the<br />
current maximum, whereas at BT(0) = 5 kG disruptions occurred in 50% of the<br />
cases. The radial distributions of i^ (Fig. 4) <strong>and</strong> Te (Figs 5 <strong>and</strong> 6) show that the<br />
disturbances are substantially higher at lower toroidal fields. Large disturbances of<br />
ne(r) <strong>and</strong> Te(r) <strong>and</strong> higher amplitudes of MHD oscillations at BT(0) = 5 kG may be<br />
due to a flattening of the current density distribution.<br />
A fast increase in the ion temperature following plasma shift <strong>and</strong> current rise<br />
was observed in part of the discharges (see Figs l(e) <strong>and</strong> 7). The ion temperature
614<br />
up<br />
100<br />
ASKUVASI et al.<br />
without Rf<br />
10 20 3D so eg tfmsj<br />
FIG. 8. Time behaviour of different plasma parameters during ICRF heating (P < 200 kW) in<br />
discharge with fast shift <strong>and</strong> current rise.<br />
increased by a factor of two, during 3 to 4 ms. Transport simulation <strong>and</strong> experiment<br />
[1] show that classical energy transfer from electrons to ions <strong>and</strong> neoclassical<br />
ion heat conductivity cannot provide such fast heating, typical times of the Tj<br />
increase being, in these cases, 10-15 ms. Some turbulent mechanism seems to be<br />
responsible for fast ion heating during the current rise.<br />
5. ION CYCLOTRON HEATING<br />
Experimental results on ion cyclotron heating of a plasma in the quasi-stationary<br />
Ohmic heating regime are presented in [5]. At an RF power of P < 200 kW<br />
launched into the plasma by a low field side loop antenna, maximum increase in the<br />
ion temperature, AT, = 80 eV, was recorded. Pulse duration <strong>and</strong> power level were<br />
limited by disruptions due to an increase in density during RF heating.
<strong>IAEA</strong>-CN-47/F-III-5 615<br />
Preliminary experiments on ICH of the plasma formed by shift <strong>and</strong> fast current<br />
rise were performed. The plasma was more stable; disruptions during RF heating<br />
were practically absent, in contrast to the previous set of experiments. A maximum<br />
density of % = (3-3.5) x 10 13 cm" 3 at a plasma current of Ip = 120 kA was<br />
reached (Fig. 8). At an RF power of P < 200 kW, an ion temperature increase of<br />
AT; = 60-80 eV was observed. The value of AT; is consistent with previous<br />
results. Now, a special coating of antenna <strong>and</strong> electrostatic shield is being designed<br />
in order to decrease the impurity <strong>and</strong> hydrogen fluxes originating during the<br />
RF pulse.<br />
REFERENCES<br />
[1] BENDER, S.E., et al., in Controlled Fusion <strong>and</strong> Plasma Physics (Proc. 11th Europ. Conf.<br />
Aachen, 1983), Vol. 1, European Physical Society (1983) 111.<br />
[2] FREDRICKSON, E., et al., in Controlled Fusion <strong>and</strong> Plasma Heating (Proc. 13th Europ. Conf.<br />
Schliersee, 1986), Vol. 1, European Physical Society (1986) 148.<br />
[3] TANGA, A., et al., ibid., p. 264.<br />
[4] BULYGINSKY, D.G., et al., in Heating in Toroidal Plasmas (Proc. 4th Int. Symp. Rome,<br />
1984), Vol. 2, Int. School of Plasma Physics, Varenna (1984) 961.<br />
[5] ASKINASI, L.G., et al., in Controlled Fusion <strong>and</strong> Plasma Physics (Proc. 12th Europ. Conf.<br />
Budapest, 1985), Vol. 9F, Part I, European Physical Society (1985) 363.<br />
DISCUSSION<br />
J.-M. NOTERDAEME: You mentioned that there was need to coat the ICRH<br />
antenna. What type of coating are you using?<br />
O.S. PAVLICHENKO: To the best of my knowledge it is a titanium nitride<br />
coating.
<strong>IAEA</strong>-CN-47/F-III-6<br />
ALFVEN WAVE HEATING AND<br />
CURRENT PROFILE MODIFICATION IN TCA<br />
G. BESSON, G.A. COLLINS 1 , B.P. DUVAL,<br />
C. HOLLENSTEIN, A.A. HOWLING, B. JOYE, J.B. LISTER,<br />
J.-M. MORET, F. RYTER, C.W. SIMM, H. WEISEN<br />
Centre de recherches en physique des plasmas,<br />
Association Euratom-Conf&ie'ration Suisse,<br />
Ecole polytechnique fedeYale de Lausanne,<br />
Lausanne, Switzerl<strong>and</strong><br />
Abstract<br />
ALFVEN WAVE HEATING AND CURRENT PROFILE MODIFICATION IN TCA.<br />
The increase in electron temperature observed during Alfven wave heating under optimal conditions,<br />
near the threshold of the (n, m) = (2, 0) continuum, leads to a large increase in the sawtooth<br />
ramp rate (~ 3 W/cm 3 ) <strong>and</strong> to a reduction in the loop voltage for several confinement times. The<br />
increase in electron density during the pulse moves the resonance surfaces outwards, which probably<br />
reduces the heating efficiency. Then, both the temperature increase <strong>and</strong> the voltage drop disappear. As<br />
the rf power is increased, this process becomes more rapid, <strong>and</strong> the reduction in the loop voltage lasts<br />
for only a few milliseconds. The ion temperature increase from 300 to 600 eV can mostly be attributed<br />
to the increased electron density, although in some conditions it can precede the density increase, implying<br />
some direct ion heating. Besides bulk plasma heating there is evidence of changes in the current<br />
profile which are triggered by the appearance of the resonant surfaces. Both increases <strong>and</strong> decreases<br />
of the internal inductance have been produced with frequency programming.<br />
1. INTRODUCTION<br />
The paper describes some of the recent results obtained<br />
during Alfven Wave Heating (AWH) experiments on the TCA tokamak<br />
(R,a = 0.61, 0.18 m, B$ = 1.5 T, Ip < 170 kA) using the full<br />
set of eight unshielded antenna groups described in detail elsewhere<br />
[1,2]. One set of carbon limiters was used for the experiments<br />
described. The quasi-cylindrical condition for the Shear<br />
Alfven Wave resonance is given by:<br />
w 2 (r) = (n+m/q(r)) 2 •(B^/MOPWR 2 ) • (1-u) 2 /(oci 2 )<br />
in which (n,m) are the toroidal <strong>and</strong> poloidal mode numbers, respectively.<br />
For the parameters of TCA this resonance condition stipulates<br />
a frequency in the range 1-5 MHz, <strong>and</strong> the work reported<br />
here was carried out at 2.3 - 2.7 MHz with n = 2.<br />
It has been theoretically predicted that a substantial<br />
fraction of the input rf power should appear as an inwardly<br />
propagating Kinetic Alfven Wave [3]. We have experimentally<br />
Australian Atomic Energy Research Establishment, Lucas Heights, Australia.<br />
617
618 BESSON et al.<br />
1.0r/a<br />
1.ST.D2.qa =3.2<br />
Resonance ^_____<br />
Curves ^<br />
0.5-<br />
l(2rV [(2.0)<br />
n-<br />
Antenna Loading !mM<br />
100-<br />
0-<br />
1 -<br />
1-<br />
n<br />
TT-<br />
6~ip (arb)<br />
DAW<br />
(2.0) \<br />
n"e amplitude<br />
0- 7)e phase \<br />
-n-<br />
C1<br />
2<br />
A _<br />
((2.1)<br />
A DAW<br />
•rf.. ~-<br />
K.<br />
\\<br />
ne(10^m-3)<br />
— .<br />
_<br />
\<br />
DAW<br />
(2.2)<br />
>v—<br />
i •<br />
FIG. 1. The main features of the Alfv6n wave spectrum excited on TCA.<br />
detected density fluctuations associated with this wave, during<br />
the heating experiments, <strong>and</strong> they exhibit many of the features<br />
predicted [4]. Figure 1 summarises the important features of the<br />
AWH scheme as a function of the electron density: Fig. 1a shows<br />
the calculated positions of the resonance layers for n = 2,<br />
m = 0, +1,2; Fig. 1b shows the individual antenna loading,<br />
varying from 20 - 80 mQ in the continua to 200 mQ for the Shear<br />
Alfven Wave eigenmodes referred to as Discrete Alfven Waves<br />
(DAW); Fig. 1c shows the b^ component of the rf wavefield<br />
measured behind the limiter radius, also showing the continua <strong>and</strong><br />
the eigenmodes; Fig. 1d shows the amplitude of the synchronous<br />
density modulations along a fixed radial chord (r ~a/2) <strong>and</strong><br />
Fig. 1e the phase of the radially propagating Kinetic Alfven Wave<br />
at this position.<br />
Since the first AWH experiments on TCA, it has been clear<br />
that the excited spectrum strongly affects the macroscopic plasma<br />
behaviour during the rf pulse. The fact that the resonance condition<br />
depends on the plasma density, which increases substantially<br />
during the rf pulse, has enabled us to make very detailed spectral<br />
scans during the rf pulse. However, it has also limited the<br />
high power study to a power level of 570kW in the (n,m)=(-2,-1)<br />
(a)<br />
(b)<br />
(c)<br />
(d)<br />
(e)
<strong>IAEA</strong>-CN-47/F-III-6 619<br />
continuum [2]. Even at power levels below this, we observe a<br />
power limitation near the AW mode thresholds which are crossed as<br />
a result of the density increase.<br />
2. PLASMA HEATING<br />
The flow of energy into the Kinetic Alfven Wave was predicted<br />
to heat the electrons via L<strong>and</strong>au damping. Experimental<br />
evidence for heating of the electrons is obtained on TCA from two<br />
separate measurements: a reduction in the loop voltage <strong>and</strong> an<br />
increase in the axial electron temperature sawtooth amplitude.<br />
Figure 2 shows a summary of the sawtooth modulation results [5].<br />
We obtained a rate of increase of stored energy on axis,<br />
3/2«e«ne(0)dTe(0)/dt, up to 3 W/cm 3 , equal to 5-8 times the<br />
volume averaged rf power, suggesting that the electron power<br />
deposition profile must be peaked on axis. The increase in<br />
central heating rate is maintained at ~4.5x, even in the<br />
higher density case, n^O) ~10 20 m~ 3 .<br />
Figure 3 shows the evolution of the loop resistance during a<br />
pulse in which the rf power increases to 200kW, Prf/Poh~70%.<br />
(arb)'<br />
Te(0)<br />
(eV)<br />
1000-<br />
900soo-<br />
700-<br />
SOO-<br />
700-<br />
eoo:<br />
BOO-<br />
700-<br />
"-<br />
Soft X-ray flux ^ ^ - ^ ~<br />
ne(0)=4.9*10 13 cm~ 3<br />
y^ \ OH<br />
12.0) continuum<br />
df- 1.6 ms<br />
Prf-150 kW<br />
Wg(0h2.65W-cm' 3<br />
(Prf)=0.37W-cm~ 3<br />
nef0J=10.4»!0 !3 cm~ 3 , (2,11 continuum<br />
^ ^ • ^ \<br />
p rC 255 kW<br />
\ ^ ^ \ OH Wet0h3.0 Wcrn 3<br />
^~^
620 BESSON et al.<br />
Te (OllkeVl<br />
40 50 60 70 80 90 100 110<br />
time Cms]<br />
FIG. 3. Increase of electron temperature <strong>and</strong> reduction of loop resistance<br />
with a modest level of rf power.<br />
The density at the start of the rf pulse is chosen so as to<br />
maximise the drop in the loop voltage <strong>and</strong> corresponds to the<br />
onset of the toroidal ly coupled (n,m) = (2,0) continuum<br />
(rig = 2 x 10 19 m~ 3 , D2, 2.5 MHz). The 300 eV increase in<br />
Te(0), measured by single-point Thomson scattering triggered at<br />
the middle of the sawtooth period, leads to a reduction of<br />
0.45 V (25%) in the resistive loop voltage, calculated as<br />
VL - Lpdlp/dt. The dashed line through the resistance curve<br />
is proportional to Te(0)~ 3 / 2 . The initial voltage increase<br />
observed corresponds to a transient inductive effect, due to<br />
d(p + li/2)/dt. After 17 msec the resistance returns to the<br />
target plasma value <strong>and</strong> even increases, consistent with the<br />
measured increase in Te(0)~ 3 / 2 . The electron confinement time,<br />
T Ee ~3.5 msec, is short compared with the timescale of this<br />
evolution. The electron density rises throughout the rf pulse,<br />
forcing the resonance layers towards the outside, as seen in<br />
Fig. 1, possibly explaining the decrease in Te(0). The<br />
appearance of the next continuum threshold (-2,-1) does not<br />
produce a pronounced drop in the loop voltage. This may in part
<strong>IAEA</strong>-CN-47/F-ffl-6 621<br />
50 60 70 80 90 100 110<br />
time Ims)<br />
FIG. 4. Prolonged voltage reduction obtained during frequency pre-programming.<br />
be due to the new surface sharing the rf power with the old<br />
surface, <strong>and</strong> partly due to the centrally flat resonance frequency<br />
profile of the (-2,-1) continuum.<br />
1 Previously, it was assumed that the increase in Praa<br />
(Fig. 3) was responsible for the temperature drop towards the end<br />
of the rf pulse. The fractional radiated power has now been<br />
reduced to an acceptable level, with Prad/( p oh +p rf)~50~ 60%<br />
up to (Poh+Prf)=0.95MW. It is now difficult to assess whether<br />
the increase in the radiated power is due to more than the<br />
increased plasma density <strong>and</strong> the reduction in electron<br />
temperature. Measurements of the plasma mass also indicates that<br />
most of the increase in plasma density is hydrogenic.<br />
It is noteworthy that if both An^/ne' <strong>and</strong> APTOT/POH<br />
are of the order of unity then a curious situation arises. A<br />
scaling law leading to a progressive decrease in confinement time<br />
with additional heating [6], when combined with this large<br />
density increase, would predict a decrease in
622 BESSON et al.<br />
Figure 4 shows such a result, in which the spectral position,<br />
given roughly by f 2 ne, has been partly stabilised by ramping<br />
down the frequency at a rate of 17 kHz/msec to compensate for the<br />
density rise. The plasma current, vertical field current <strong>and</strong><br />
plasma current position are quite stable. During this period the<br />
error in the loop voltage due to these currents will be small,<br />
confirming the reduction, 22% in this case.<br />
As the rf power is increased, the density ramps faster <strong>and</strong><br />
reduces the time during which d(ngf 2 )/dt is small enough to<br />
stabilise the evolution of the spectrum around the optimal<br />
region. This explains why the most convincing electron heatinq<br />
results have been obtained at the 100-200 kW level whereas the rf<br />
generator has delivered up to 570 kW to the plasma. Work is<br />
currently underway to increase the useful frequency sweep range<br />
of the rf generator to resolve this question.<br />
An underst<strong>and</strong>ing of the increase in electron density is,<br />
therefore, still of extreme importance. The magnitude of the<br />
increase is relatively insensitive to the excited mode structure,<br />
or to the number of active antennas <strong>and</strong> hence also to the antenna<br />
voltages, but it remains a linear function of the total delivered<br />
rf power. It also has an almost linear dependence on the plasma<br />
current. Detailed analysis of its time evolution using a<br />
zero-dimensional model, dN/dt = S-NAeff, shows that the cause<br />
of the increase, a change in either S or teff, remains<br />
unchanged when the plasma current is reduced. The recycling or<br />
pump-out term, which defines the new steady state, increases as<br />
the current is reduced, leading to a smaller density increase but<br />
with a shorter rise time. The Ha + Da emission generally<br />
decreases at the start of the rf pulse at high current <strong>and</strong><br />
remains below the "ohmic" value throughout, suggesting an<br />
increase in particle confinement. This decrease disappears as the<br />
plasma current is reduced, <strong>and</strong> we even observe a small increase<br />
in Ha + Da for qa > 6.<br />
In the conditions described, we still observe a large<br />
increase in the ion temperature during the rf pulse, typically<br />
from 300-600 eV with ~200kW of rf power. In some conditions,<br />
preceding a continuum threshold, we observe a fast increase in<br />
Ti which indicates direct ion heating. However, even at the<br />
highest powers, the ion temperature never exceeds the electron<br />
temperature, suggesting that this direct ion heatinq must be<br />
small. To summarise, the newest results with naked antennas, carbon<br />
limiters <strong>and</strong> active frequency control have provided further proof<br />
of electron heating using Alfven Waves, by prolonging the period<br />
of reduced plasma loop voltage.<br />
3. CURRENT PROFILE CHANGES<br />
The predicted local power deposition to the electrons<br />
suggests that AWH might be able to modify the current profile, if<br />
at all possible. Several experimental results from TCA suggest<br />
that this is the case <strong>and</strong> they are listed below.
1.25-<br />
<strong>IAEA</strong>-CN-47/F-IH-6 623<br />
75 100<br />
time I ms I<br />
FIG. 5. Evolution of (Sdia <strong>and</strong> /3 + 1/2 during an rf pulse.<br />
IQOkA-<br />
700mA-<br />
0 50 WO 150<br />
t Cms]<br />
-100kW<br />
FIG. 6. Reduction in % following the (2, 0) threshold, deduced from /3 + 1/2.
624 BESSON et al.<br />
0.2-<br />
-0.2-<br />
-0.4-<br />
-0.6-<br />
Aneig with respect to the (n,m)=(2.0) threshold density<br />
n o u a _<br />
a Loop voltage<br />
decreases<br />
o MHO activity<br />
destabilised<br />
3.0 3.2 3.4 3.6 qla)<br />
FIG. 7. Occurrence of the voltage drop <strong>and</strong> onset ofMirnov activity with respect to the (2, 0) threshold<br />
density, as the plasma current is varied.<br />
The very rapid rise in P + lj/2 compared with the diamagnetic<br />
signal {Fig. 5) suggests a sudden increase in 1^/2 (current<br />
peaking) when the rf pulse is first applied. For a given rf<br />
power, this increase in 1^/2 depends on the position in the<br />
spectrum, being generally larger when the resonance surfaces are<br />
in the outer region of the plasma.<br />
The value of P + 1^2 can also decrease during the rf pulse,<br />
also seen in Fig. 5. A case is shown in Fig. 6, clearly<br />
indicating a reduction in li by more than the value of (3 in the<br />
original target plasma. The magnitude of the decrease is<br />
estimated assuming different ohmic scaling laws for the increased<br />
density plasma, from which the several curves on the figure are<br />
derived. Values in the range -Al^~0.4-0.6 are obtained.<br />
There is a disruption power limit at fixed points in the<br />
spectrum, near the thresholds of the continua, when the increase<br />
in m=2 activity at these points exceeds a critical value. The<br />
increase in m=2 is attributed to a change in the current profile<br />
near the q=2 surface.<br />
There is a change in the details of the DAW spectrum excited,<br />
showing up as a hysteresis when the generator frequency is<br />
varied L2J. This has been explained by the dependence on q(r) in<br />
the resonance condition.<br />
The origins of these changes are still not fully understood,<br />
but it now seems that both the thresholds of the continua <strong>and</strong> the<br />
next outermost surface must play a role.<br />
Figure 7 shows the density difference between the occurrence<br />
of the (n,m) = (2,0) CftW, <strong>and</strong> a) the occurrence of the drop in<br />
loop resistance <strong>and</strong> b) the increase in m=2 Mirnov activity. The<br />
figure shows that, as the plasma current is varied, the loop<br />
resistance drop always occurs shortly after the appearance of the<br />
(2,0) threshold, whereas the onset of the destabilization of the<br />
MHD activity varies with respect to this threshold. Calculations<br />
using assumed plasma current profiles show that the increase in
<strong>IAEA</strong>-CN-47/F-III-6 625<br />
MHD activity in fact coincides with the approach of the outer<br />
resonance surface (2,1) to the estimated position of the q=2 surface,<br />
illustrated in Fig. 1.<br />
All these observations indicate that the radial positions of<br />
the Shear Alfven Wave resonance surfaces influence the current<br />
profile. Much of the discontinuous behaviour observed during the<br />
AWH pulse, <strong>and</strong> documented in detail elsewhere, could be attributed<br />
to these profile changes.<br />
ACKNOWLEDGEMENTS: We gratefully note the continued interest of<br />
Professor F. Troyon in our work, as well as the support of the<br />
whole TCA team. This work was partly funded by the Fonds National<br />
Suisse de la Recherche Scientifique.<br />
REFERENCES<br />
[1] COLLINS, G.A., et al., Phys. Fluids 29 (1986) 2260.<br />
[2] BESSON, G., et al., Plasma Phys. Controll. Fusion 28 (1986) 1291.<br />
[3] HASEGAWA, A., CHEN, L., Phys. Rev. Lett. 35 (1975) 370.<br />
[4] BEHN, R., COLLINS, G.A., LISTER, J.B., WEISEN, H., Plasma Phys. Controll. Fusion 29<br />
(1987) 75.<br />
[5] JOYE, B., et al., Phys. Rev. Lett. 56 (1986) 2481.<br />
[6] GOLDSTON, R.J., Plasma Phys. Controll. Fusion 26 (1984) 87.<br />
DISCUSSION<br />
M. ONO: What is the ion temperature behaviour during the regime of large<br />
density increase?<br />
J.B. LISTER: The ion temperature increases typically by 300-400 eV, as we<br />
have always reported. The question is really whether this is due only to the increase<br />
in density, via an increase in Pei, or whether the RF delivers power directly to the<br />
ions. At the 11th European Conference in 1983 we reported a value of Tj greater<br />
than the Ohrnic value, <strong>and</strong> at the 12th European Conference in 1985 we reported<br />
values of dW;(0)/dt > Pei(0). The errors in these analyses are large, however, <strong>and</strong><br />
we consider the question of direct ion heating an open one.
ANALYSIS OF ICRF HEATING<br />
AND CURRENT DRIVE IN TOKAMAKS<br />
A. FUKUYAMA, T. MORISHITA<br />
Department of Electronics,<br />
Okayama University,<br />
Okayama<br />
Y. KISHIMOTO, K. HAMAMATSU<br />
Japan Atomic Energy Research Institute,<br />
Naka-machi, Naka-gun, Ibaraki-ken<br />
S.-I. ITOH<br />
Institute for Fusion Theory,<br />
Hiroshima University,<br />
Hiroshima<br />
K. ITOH<br />
Plasma Physics Laboratory,<br />
Kyoto University,<br />
Uji, Kyoto<br />
Japan<br />
Abstract<br />
<strong>IAEA</strong>-CN-47/F-IV-l<br />
ANALYSIS OF ICRF HEATING AND CURRENT DRIVE IN TOKAMAKS.<br />
To analyse ICRF heating <strong>and</strong> current drive processes in tokamak plasmas, a theoretical model<br />
<strong>and</strong> computational codes are developed. Wave excitation, propagation <strong>and</strong> absorption, high energy tail<br />
formation, thermalization of the absorbed power, <strong>and</strong> current generation are analysed simultaneously,<br />
<strong>and</strong> the temporal <strong>and</strong> spatial evolutions of bulk plasma parameters are calculated in a consistent manner<br />
<strong>and</strong> in a realistic geometry. This wave thermalization transport analysis enables a comparison of<br />
modelling with experimental results. Through the kinetic treatment of the wave in the ICRF heated<br />
plasma, the good accessibility, the controllability of the deposition profile, the sustainment of the high<br />
energy particles in the core region, <strong>and</strong> the current drive ability in the high density regime are<br />
confirmed. A study on confinement time <strong>and</strong> MHD stability is presented. It is found that localized,<br />
intensive heating increases the central pressure <strong>and</strong> invalidates the stability criterion of the internal kink<br />
mode.<br />
1. INTRODUCTION<br />
Ion cyclotron range of frequency (ICRF) waves have been extensively used<br />
as a reliable heating tool <strong>and</strong> have become a promising c<strong>and</strong>idate for current drive<br />
in tokamaks. Analysis of their properties is substantial for an explanation of<br />
experimental results <strong>and</strong> for designing future programmes. To analyse the heating<br />
627
628 FUKUYAMA et al.<br />
<strong>and</strong> current drive processes, we have developed a theoretical model <strong>and</strong> the computational<br />
codes associated with it. Three stages: (1) wave propagation <strong>and</strong> absorption,<br />
(2) relaxation in a velocity space, <strong>and</strong> (3) spatial transport are systematically<br />
analysed according to different time-scales. For given launching conditions, wave<br />
field structure, high energy particle generation, power deposition profile, time evolution<br />
of temperature profiles <strong>and</strong> driven current are evaluated in a consistent manner.<br />
We examine the confinement characteristics (e.g. the confinement time <strong>and</strong><br />
attainable temperature), the stability of the internal kink mode <strong>and</strong> the optimum<br />
conditions for the current drive.<br />
2. WAVE EXCITATION AND PROPAGATION<br />
We solve Maxwell's equations, using the kinetic conductivity of an<br />
inhomogeneous <strong>and</strong> multicomponent plasma [1, 2]. The following linear processes<br />
are described simultaneously: coupling to finite size antennas, wave propagation<br />
(reflection, refraction <strong>and</strong> tunnelling through evanescent layers), mode conversion to<br />
ion Bernstein waves, cyclotron damping up to second harmonics, L<strong>and</strong>au damping<br />
as well as transit time magnetic pumping (TTMP). Figure 1 shows the poloidal structures<br />
of the wave field (a) <strong>and</strong> the power deposition profile (b) for two ion hybrid<br />
resonance heating in JET (D majority, H minority) [3]. We observe that good accessibility<br />
to the central region is obtained, <strong>and</strong> that 80% of the injected power is<br />
absorbed near the plasma centre (r S 0.2 m). When a high energy tail component<br />
of the minority ion exists, the deposition profile broadens as is shown in (c).<br />
(a) (c)<br />
FIG. 1. Poloidal structure for two-ion hybrid resonance heating in JET (B, = 2.04 T,<br />
o>/2w = 29.8 MHz, ne0 = 2.94 x 1Q 19 m' 3 , To = 2.5 keV, nH/nD = 0.1, monopole antenna),<br />
(a) Wave electric field, Im Ey(r,8); (b) power deposition profile to protons; (c) power deposition<br />
profile in the presence of a high energy tail component near plasma centre, r £ 0.3 m.
1.13x10'<br />
0<br />
[kW/m 3 ]<br />
r<br />
T Ht<br />
Pe/2 :C0NPUTED<br />
. Pe EXPERIMENT<br />
<strong>IAEA</strong>-CN-47/F-IV-l 629<br />
(a)<br />
(b)<br />
' P. :COMPUTED WITH<br />
f \ V ' .SPATIAL TRANSPORT<br />
[m] 0.6<br />
[kev]<br />
[kW/m 3 ]<br />
FIG. 2. (a) Radial profiles of nHl <strong>and</strong> TH, of hot component at power level of 0.66 MW.<br />
n H^ n D = 0.04; other parameters are the same as in Fig. 1; (b) radial profiles of power absorbed by<br />
electrons: calculated in the wave thermalization analysis (solid line), computed by coupling with 1-D<br />
transport code (dashed line), evaluated from temperature rise in JET (solid circles); (c) Bo dependence<br />
of the absorbed power density. Arrows indicate positions of fundamental cyclotron resonance of proton.<br />
3. MODIFICATION OF THE VELOCITY DISTRIBUTION<br />
The velocity distribution of the resonant particles in a heated region is strongly<br />
modified, <strong>and</strong> this modification affects wave propagation <strong>and</strong> absorption. We<br />
describe the time evolution of the local velocity distribution, taking account of the<br />
change in the wave structure. The Fokker-Planck analysis [4], including collisional<br />
<strong>and</strong> quasi-linear diffusion, is combined with the 1-D ICRF wave code [1]. We calculate<br />
tail formation <strong>and</strong> power partition through collisional relaxation [5]. In the case<br />
of two ion hybrid resonance heating, a high energy tail of the minority ion velocity<br />
distribution appears first near the cyclotron resonance. The density nH, <strong>and</strong> the<br />
temperature THt of the hot component of the minority ions increase, <strong>and</strong> the width<br />
of the heated region broadens in a collisional time-scale. Figure 2(a) shows the radial<br />
profiles of nHt <strong>and</strong> THt, together with the minority density nH, for the JET heating<br />
experiment. The power deposition profile in Fig. l(c) is computed on the basis of<br />
the distribution of the hot component. The power transferred to electrons through<br />
collisions is enhanced near the plasma centre with the increase of the hot component.<br />
The spatial profile of the power absorbed by electrons is shown in Fig. 2(b). Solid<br />
circles denote the value derived from the temperature rise in JET [3]. The dashed line<br />
indicates the initial temperature increment computed by coupling with the 1-D transport<br />
code, which is in good agreement with the experiment. Deposition control by<br />
frequency change is illustrated in Fig. 2(c) for fixed RF power. As the cyclotron<br />
resonance shifts from the plasma centre, the absorbed power density <strong>and</strong> the tail<br />
temperature decrease <strong>and</strong> the power partition changes.
630 FUKUYAMA et al.<br />
FIG. 3. (a) Temporal evolution of central temperatures, Te0 <strong>and</strong> T^, proton energy content, WH, <strong>and</strong><br />
growth rate of internal kink mode, y. Bo, na, co are the same as in Fig. 1, nH/nD = 0.04 <strong>and</strong><br />
Pxr = 3 MW; (b) electron temperature profile at 0 ms, 100 ms <strong>and</strong> 1800 ms.<br />
4. SPATIAL TRANSPORT<br />
To study the long time development of plasma profiles, the power deposition<br />
is linked to the 1-D transport code. For a given density profile, Te(r,t), TD(r,t) <strong>and</strong><br />
poloidal magnetic field Bp(r,t) are computed. An electron energy diffusion coefficient<br />
of the ALCATOR-INTOR form (xe = 1 X 10 19 n^ 1 m 2 -s~') is employed.<br />
As for the ion energy diffusion coefficient, we use Xi — 0.5 [m^s" 1 ] + XCH after<br />
Doublet III results [6], where XCH is the neoclassical value calculated [7]. Neoclassical<br />
resistivity is employed <strong>and</strong> Zeff = 2.29. These coefficients are chosen to<br />
reproduce the Ohmic plasma in JET. Figure 3(a) shows the time evolution of the<br />
central temperatures, T^ <strong>and</strong> TDQ, <strong>and</strong> the minority energy content WH, in the case<br />
of 3 MW ICRF input with Ip = 2 MA. The Te profiles in the Ohmic phase, in the<br />
initial phase of RF heating <strong>and</strong> in the saturation phase, are shown in Fig. 3(b). In the<br />
initial phase, Te increases mainly in the central region (r :£ 0.3 m). The ratio of<br />
central to average temperature is about 3.4 for t > 250 ms. The confinement time<br />
in the saturation phase is 625 ms, which is comparable to that of the Ohmic phase.<br />
5. MHD ACTIVITY<br />
The MHD stability is affected by the localized energy deposition <strong>and</strong> by the fast<br />
ions due to the ICRF heating. We study the stability of the m/n = 1/1 internal kink<br />
[m]
<strong>IAEA</strong>-CN-47/F-IV-l 631<br />
mode (m/n: poloidal/toroidal mode numbers). We employ the simplified stability<br />
criterion, 5WT > 0 [8], where<br />
with<br />
5WT = 3v Aq {13/48(K+4) - 0P [(rj/r,)'- 4 - l]/(»—4)}<br />
0P m -Prt/Bj (r,)] l" (r/r,) 2 (dp/dr) dr<br />
J o<br />
q(r,) = 1 <strong>and</strong> q(r2) = 2<br />
The safety factor is fitted as q(r) ~ 1 - Aq [l-(r/r,)*] near the axis.<br />
The time evolution of 5WT is given by the wave thermalization transport calculation.<br />
With the injected power of 3 MW, we find that j8p increases rapidly <strong>and</strong> that<br />
the mode becomes unstable with a delay time of 35 ms after the onset of RF heating<br />
(see Fig. 3(a)). The growth rate y is about 10 4 s" 1 . This pressure driven internal<br />
kink instability may be the origin of the rapid internal disruption which is not<br />
accompanied by the precursor oscillations. This delay time seems to be shorter than<br />
the experimentally observed period of the giant sawtooth. If we include the finite<br />
gyroradius stabilization effects of the tail ions [9], the critical /3P value increases,<br />
<strong>and</strong> the delay time may be longer by a factor of two. We note that the critical j3p<br />
value depends weakly on nH/ne. If we assume that Te(r) is limited by this instability,<br />
the energy confinement time reduces to the order of 100 ms for the parameters<br />
of Fig. 3.<br />
6. CURRENT DRIVE IN HIGH DENSITY PLASMA<br />
The current drive by using the phase shifted antenna array in the toroidal direction<br />
is examined [10]. The Fokker-Planck equation for electrons at each spatial point<br />
is combined with the ICRF 1-D wave code [1]. The stationary distribution function<br />
is given by<br />
F(u) = C exp - u du/(l + Dw/Dc)<br />
L Jo J<br />
where u = v/ve (ve is the electron thermal velocity) <strong>and</strong> Dw <strong>and</strong> Dc are quasi-linear<br />
<strong>and</strong> collisional diffusion coefficients, respectively [10]. The current is driven by<br />
L<strong>and</strong>au damping <strong>and</strong> TTMP. Application to JET plasma is given, assuming that<br />
seven antennas are installed on the low field side. Figure 4(a) shows the induced<br />
current profile <strong>and</strong> the normalized efficiency t\ = (J(x)/Pe(x))(mvev0/nee) [11]
632 FUKUYAMA et al.<br />
[A/m<br />
Ixio'<br />
-1.2<br />
F/G. 4. (a) Induced current profile <strong>and</strong> normalized efficiency. B, = 2.165 T, a/2ir = 43 MHz,<br />
nt0 = 8 X 1O 19 m' 3 , To = lOkeV, nH/ne = O.I; (b) phasing <strong>and</strong> spacing dependence of global<br />
efficiency Va for a/2ir = 33 MHz <strong>and</strong> ne0 = 1O 20 m' 3 . A: hi = 0.126 m, B: Az = 0.188 m,<br />
C: Az = 0.295 m, D: Az = 0.377 m, E: Az = 0.589 m.<br />
(antenna spacing Az = 0.188 m, phase difference A = 2TT/9). At the density of<br />
iieo = 8 x 10 19 m" 3 , the current is driven near the plasma centre. About 85% of<br />
the incident power is absorbed directly by the electrons. The global efficiency<br />
T/G 3 IRJJ/PRF is 0.025 A/W.<br />
Phasing <strong>and</strong> spacing dependences are examined (Fig. 4(b)). It is found that Az<br />
has an upper limit to avoid negative current, which is generated by the subpeaks of<br />
the radiated RF spectrum. Once the spacing is properly chosen (such as the cases<br />
A, B <strong>and</strong> C), the efficiency is insensitive to the number of antennas. The A
<strong>IAEA</strong>-CN-47/F-IV-l 633<br />
ACKNOWLEDGEMENTS<br />
This work was supported by a grant in aid for fusion research <strong>and</strong> scientific<br />
research from the Ministry of Education, Science <strong>and</strong> Culture of Japan.<br />
REFERENCES<br />
[1] FUKUYAMA, A., NISHIYAMA, S., ITOH, S.-I., ITOH, K., Nucl. Fusion 23 (1983) 1005.<br />
[2] FUKUYAMA, A., GOTO, A., ITOH, S.-I., ITOH, K., Jpn. J. Appl. Phys. 23 (1984) L613;<br />
FUKUYAMA, A., ITOH, K., ITOH, S.-I., Computer Phys. Rep. 4 (1986) 137.<br />
[3] JACQUINOT, J., ANDERSON, R., ARBEZ, D., BARTLETT, D., BEAUMONT, B., et al.,<br />
Plasma Phys. Controll. Fusion 28 (1986) 1.<br />
[4] STIX, T.H., Nucl. Fusion 15 (1975) 737.<br />
[5] MORISHITA, T., FUKUYAMA, A., HAMAMATSU, K., ITOH, S.-I., ITOH, K., Analysis<br />
of the Minority Velocity Distribution <strong>and</strong> the Power Deposition Profile in ICRF Heating in<br />
Tokamak, Rep. HIFT-124, Inst. Fusion Theory, Hiroshima (1986).<br />
[6] GROEBNER, R.J., PFEIFFER, W., BLAU, F.P., BURRELL, K.H., FAIRBANKS, E.S., et<br />
al., Nucl. Fusion 26 (1986) 543.<br />
[7] CHANG, C.S., HINTON, F.L., Phys. Fluids 25 (1982) 1493.<br />
[8] BUSSAC, M.N., PELLAT, R., EDERY, D., SOULE, J.L., Phys. Rev. Lett. 35 (1975) 1638.<br />
[9] ITOH, K., ITOH, S.-I., TUDA, T., TOKUDA, S., J. Phys. Soc. Jpn. 53 (1984) 1759.<br />
[10] KISHIMOTO, Y., HAMAMATSU, K., FUKUYAMA, A., ITOH, S.-I., ITOH, K., ICRF<br />
Current Drive by Use of Phase Control of Antennas, Rep. HIFT-120, Inst. Fusion Theory,<br />
Hiroshima (1986).<br />
[11] FISCH, N.J., Phys. Rev. Lett. 41 (1978) 873.
DOUBLE HELIX (] x b) CURRENT DRIVE<br />
IN THE RF TOKAMAK DEVICE RYTHMAC<br />
M.J. DUTCH, A.L. MCCARTHY<br />
School of Physical <strong>Sciences</strong>,<br />
The Flinders University of South Australia,<br />
Bedford Park, South Australia,<br />
Australia<br />
Abstract<br />
<strong>IAEA</strong>-CN-47/F-IV-2<br />
DOUBLE HELIX CURRENT DRIVE IN THE RF TOKAMAK DEVICE RYTHMAC.<br />
Travelling wave fields in m = 1, n = 4 double helix structures surrounding a toroidal plasma<br />
vessel are used to drive toroidal <strong>and</strong> poloidal plasma currents by means of the non-linear Hall effect<br />
technique in high power experiments of short duration at 330 kHz. The evolution of the magnetic<br />
configuration has been studied using magnetic probe data to calculate <strong>and</strong> plot the poloidal flux<br />
function. Contours of equal driven toroidal current extracted from the same probe data reveal negative<br />
toroidal current at a small radius <strong>and</strong> at early times. This observation is consistent with the model<br />
presented. The rapidly rising quasi-steady driven toroidal current distributed over the minor section creates<br />
a changing magnetic flux <strong>and</strong> thus a back electromotive force (emf) observable as the loop voltage.<br />
This emf drives negative current along the path of minimum impedance. The configuration approaches<br />
a steady state where this back emf <strong>and</strong> negative current die away without any evidence of disruptions.<br />
A series of experiments with 40 ms of current drive is planned to study the equilibrium <strong>and</strong> stability<br />
of the configuration on this longer time-scale, beyond the start-up phase studied here. Extension of the<br />
RF current drive technique to an m = +1 <strong>and</strong> — 1 helical mesh antenna which drives purely<br />
toroidal current with no poloidal current is presented. The data for this case are contrasted with those<br />
for the m = +1 double helix antenna <strong>and</strong> the m = — 1 double helix antenna applied separately, <strong>and</strong><br />
a theoretical discussion of the drive by this helical mesh antenna is given.<br />
1. INTRODUCTION<br />
To achieve steady operation of a tokamak reactor it is<br />
necessary to develop continuous toroidal current drive. Many<br />
experimental groups have investigated RF techniques for such<br />
continuous current drive <strong>and</strong> research in this field has been<br />
reviewed recently by Jones [1],<br />
We present here data <strong>and</strong> discussion which gives a detailed<br />
account of the start-up phase of our m =.1 double helix driven<br />
RF tokamak RYTHMAC, shown schematically in figure la, whose<br />
experimental operation <strong>and</strong> theoretical basis in terms of the<br />
nonlinear Hall effect have been previously reported[2,3].<br />
This configuration,which has been reported by Hotta et aL[4] to<br />
drive toroidal current, is shown here to drive toroidal <strong>and</strong><br />
poloidal current; the poloidal current, which interacts with the<br />
635
636 DUTCH <strong>and</strong> MCCARTHY<br />
FIG. 1.<br />
a. Schematic diagram showing the m = 1 double helix structure used to drive toroidal <strong>and</strong> poloidal<br />
currents.<br />
b. Line generator waveforms at 2 us per division, showing phase difference <strong>and</strong> reproducibility.<br />
c. Line generator waveforms, 10 us per division.<br />
d. Rogowski belt measure of toroidal current, 10 us per division, 500 A per division. The spike at<br />
5 y.s is spark gap noise at the time the line generators are triggered. Figures 1b <strong>and</strong> Id have two<br />
shots superposed to show the reproducibility.<br />
e. Loop voltage; the vertical scale is 10 V per division.<br />
f(i), f(ii). Poloidal flux contours at times r, <strong>and</strong> t2 marked in d.<br />
g(i), g(ii). Contours of equal toroidal current density at times t} <strong>and</strong> t2 marked in d. Heavy contours<br />
indicate positive current, light contours negative current. Below are the current profiles in the<br />
median plane,<br />
h. Contours of equal AB+ caused by driven poloidal current.<br />
h.
<strong>IAEA</strong>-CN-47/F-IV-2 637<br />
toroidal field, will take part in the equilibrium <strong>and</strong> stability<br />
<strong>and</strong> may need to be controlled independently of the toroidal<br />
current.<br />
We are led by our detailed study of the m = 1 double helix<br />
current drive experiments to develop a new antenna configuration<br />
which we call the m = + <strong>and</strong> -1 helical mesh antenna, shown<br />
schematically in figure 2 in a cylindrical geometry large<br />
aspect ratio approximation for clarity. We report observations<br />
which demonstrate experimentally that this antenna drives<br />
purely toroidal current without poloidal current as does the<br />
Synchromak configuration but with an m = 0 antenna [5].<br />
In the section entitled model <strong>and</strong> theory we give a resume*<br />
of the technique of current drive for the m = 1 double<br />
helix case. For the m = + <strong>and</strong> -1 helical mesh antenna we<br />
determine the spatial <strong>and</strong> temporal dependence of the vacuum<br />
magnetic fields. The motion of these fields gives insight into<br />
the current drive of this device.<br />
2. MODEL AND THEORY<br />
2.1. m = 1 Double Helix Antenna<br />
To describe the mechanism of steady current drive in our<br />
experiments in the simplest model, the ions are assumed<br />
immobile <strong>and</strong> uniformly distributed, <strong>and</strong> the electrons are<br />
treated as an inertialess, pressureless negatively charged fluid.<br />
We ignore steady applied magnetic fields. " The generalised<br />
Ohm's law is written: 1<br />
E = r|J + — J x B (1)<br />
The RF currents in the helical structure of fig. la induce<br />
screening currents in the plasma which try to exclude the RF<br />
fields of the structure. But finite resistivity permits these<br />
fields to penetrate. The screening currents j follow helical<br />
paths parallel to the structure currents <strong>and</strong> because of resistivity<br />
have phase different from that of the RF magnetic field<br />
b of the structure. There will thus be a nonlinear Hall effect<br />
term consisting of a steady part <strong>and</strong> a part of frequency 2w.<br />
We include the steady parts of these nonlinear Hall effect<br />
terms in the components of Ohm's law, using angular brackets to<br />
denote the time averages:<br />
1<br />
fy $ ne<br />
E e= J B*^ K W ^
638 DUTCH <strong>and</strong> MCCARTHY<br />
FIG. 2.<br />
a. Schematic diagram of them = +1 <strong>and</strong> -1 helical mesh antenna viewed horizontally. The arrows<br />
on the windings show the direction of the RF structure currents at the instant when the current is<br />
maximum in phase 1 <strong>and</strong> zero in phase 2. The symbols © <strong>and</strong> ® in the plasma vessel indicate<br />
the structure of field 6. The nature of the screening currents J induced in the plasma is represented<br />
by the dashed paths.<br />
b. The same structure as in a, one quarter of a period later. Now the RF current is zero in phase 1<br />
<strong>and</strong> maximum in phase 2.<br />
c. Horizontal cut through the minor axis as seen from above, showing the vacuum travelling magnetic<br />
field pattern produced by the helical mesh antenna.<br />
d. Oscillogram data for m = + 1 double helix antenna.<br />
d(i), e(i), f(i). Steady driven toroidal current 1^, recorded at 10 /is per division. The vertical scale is<br />
450 A per division.<br />
d(ii), e(ii), f(ii). Change in the toroidal magnetic field on the minor axis, kB^O, 0), caused by the<br />
driven poloidal current recorded at 10 /is per division. The vertical scale is about 0.004 Tper<br />
division.<br />
e. Data for the m = —1 double helix antenna.<br />
f. Data for the m = +1 <strong>and</strong> —1 helical mesh antenna.
<strong>IAEA</strong>-CN-47/F-IV-2 639<br />
From these equations we see that even in the absence of imposed<br />
electric fields, such as the inductively coupled E§ of the<br />
Tokamak,we would expect the nonlinear Hall effect term to balance<br />
the resistive terms to drive not only toroidal current but also<br />
poloidal current. We have presented a complete treatment of<br />
this problem in helical coordinates, with some analytic <strong>and</strong><br />
some numerical solutions [3].<br />
2.2. m = + <strong>and</strong> -1 Helical Mesh Antenna<br />
We represent the structure currents shown in figures 2a<br />
<strong>and</strong> 2b in the^natural helical coordinate systems (r, x+i £+i<br />
<strong>and</strong> (r, x_p 8_i) for the m = +1 <strong>and</strong> m = -1 conductors,<br />
respectively [3].<br />
6(r-ro)<br />
which can be written in cylindrical coordinates as:<br />
i<br />
J ext<br />
<strong>and</strong><br />
•'ext<br />
- Re<br />
we sum to<br />
I<br />
i(wt+9+kz)<br />
2 "<br />
e<br />
k c r kr<br />
get<br />
'-kr£+z'<br />
k r<br />
, o I<br />
sinCwt+kz] since)<br />
e i(wt-6+kz)<br />
+ 2 e<br />
kr<br />
[<br />
0 + cos(a>t+kz)cosCe)<br />
§+<br />
k r<br />
0<br />
z<br />
1 «Cr-ro)<br />
r 0<br />
Ie measures the strength of the RF currents in the helical<br />
conductors located at radius r0 <strong>and</strong> of pitch length £= 27r /ic;<br />
ko = Ck 2 *^) 2 .<br />
r 2<br />
Maxwell's equations in helical coordinates give the total<br />
structure field<br />
b = Re iB i; ."(kr)'le + e >r<br />
B k<br />
0) O<br />
i(tot+x+1).<br />
- e<br />
r o<br />
o<br />
(4)
640 DUTCH <strong>and</strong> MCCARTHY<br />
where B(0 measures the strength of this RF field at r=0 <strong>and</strong> is<br />
proportional to Ie. Ii(kr) is a modified Bessel function of<br />
order 1.<br />
get:<br />
Expressing this in cylindrical coordinates <strong>and</strong> summing we<br />
b = 2B I'(kr)sin(wt+kz)cos(6) r - —=- sin(urt;+kz)sin(6) G<br />
0)<br />
+ I1(kr)cos(wt+kz)cos(0) z (5)<br />
from which we may note immediately that all three spatial components<br />
of the field progress as a wave on the structure in the axial<br />
direction,as indicated by the sin(wt+kz) dependence, but do not<br />
progress in the poloidal direction 9. Figure 2c shows a<br />
partial representation of b.<br />
Immediately we see from the model of electrons being<br />
entrained to move with the field linesf provided jjp-
<strong>IAEA</strong>-CN-47/F-IV-2 641<br />
agreement. Poloidal current as well as toroidal current is<br />
driven by the double helix antenna structure[3].<br />
In figure lb,c we display the RF line generator waveforms<br />
<strong>and</strong> in figure Id we see the quasi steady driven toroidal current<br />
as measured by the Rogowski belt. It is important to note<br />
that two shots are overlapped in fig. lb,d>which demonstrates<br />
a high degree of reproducibility in the data allowing us to<br />
study the plasma configuration by analysing data from several<br />
hundred shots. The driven toroidal current in fig. Id is<br />
approximately 1.5 kA.<br />
The magnetic configuration has been studied by measuring<br />
the Br <strong>and</strong> Bz components of the magnetic field on a grid of<br />
points in the minor section; from this set of data the<br />
poloidal flux function has been calculated. Flux contours for<br />
the configuration produced are shown in fig.If. The driven<br />
toroidal current extracted from the magnetic probe data shows,<br />
in fig. lg, negative current at small radius at early times.<br />
This is the result of the back emf caused by the flux of the<br />
distributed driven toroidal current driving negative current<br />
on the path of minimum impedance.<br />
A single-turn loop is used to measure the back emf (see<br />
figure le). For a vacuum shot with full RF current drive<br />
applied the loop voltage VL is of course zero,unlike the loop<br />
voltage with a vacuum shot for an inductively driven tokamak.<br />
The loop voltage to be observed for a non-inductively driven<br />
tokamak is a result of the changing flux created by the rapidly<br />
rising driven toroidal current. For a non-inductively driven<br />
tokamak the forward driving term is localised while the back<br />
f -d$R<br />
emf VL = JE.dl = , is not. The spatial distribution of<br />
these terms need not be the same. On the shortest toroidal<br />
-d$R i ~ ~<br />
paths, E. in /E.d£ = can exceed — of equation (2)<br />
<strong>and</strong> negative current will be driven in that part of the<br />
minor section. For inductively driven tokamaks, only the net<br />
. -d$g<br />
flux changes in the core are important <strong>and</strong> JE.dt = < has the<br />
same sign on all toroidal paths within the plasma.<br />
In this experiment the RF is maintained for a relatively<br />
short time because the sources are line generators, <strong>and</strong> the<br />
loop voltage goes to zero as the driven current maximises; the<br />
loop voltage changes sign when the driven current falls. This<br />
back emf driven negative current dies away as the configuration<br />
evolves. If the RF drive were to be maintainedrthis transient<br />
phenomena would cause no problems, but during the start-up<br />
phase the interaction of this current contributes to the forces<br />
which will determine the equilibrium <strong>and</strong> stability.
642 DUTCH <strong>and</strong> McCARTHY<br />
Of more concern for this m = 1 double helix current drive<br />
configuration in determining equilibrium is the role played by<br />
the driven poloidal current. Evidence for the existence of<br />
this current is given in fig. lh as a contour plot of equal<br />
AB^, the change in toroidal field created by the driven<br />
poloidal current. It is important to the discussion that the<br />
measured magnitude of the AEU requires the poloidal current<br />
density Jg to be approximately the same as the driven toroidal<br />
current density JA,as expected from the theoretical analysis[3],<br />
It follows that the interaction of J0 with the imposed B^ is a<br />
very important term in determining equilibrium,giving approximately<br />
three times as large a force as the interaction of the<br />
toroidal current with the appropriate vertical field for<br />
equilibrium in the absence of driven poloidal current. Unlike<br />
the interaction of the negative toroidal current in the startup<br />
phase, the interaction of this driven poloidal current with<br />
the toroidal field provides a term in the equilibrium equations<br />
which is maintained continuously. Accordingly we sought to<br />
control this.<br />
3.2. m = + <strong>and</strong> -1 Helical Mesh Antenna Experiment<br />
For these experiments the RYTHMAC machine <strong>and</strong> plasma conditions<br />
were essentially the same as in 3.1,except that the<br />
m = + <strong>and</strong> -1 helical mesh antenna shown schematically in fig. 2<br />
was built from superposed m = +1 <strong>and</strong> m = -1 double helix<br />
antennas. By making different connections, the windings can<br />
be operated as just an m = +1 or just an m = -1 antenna as well<br />
as the helical mesh antenna. The impedance presented to each<br />
of the RF sources differs in the different configurations, but<br />
we choose the operating conditions such that for all the data<br />
presented the magnitude of the RF currents in the antenna<br />
windings is approximately the same. For the helical mesh<br />
antenna,one line generator phase feeds one pair of the m = +1<br />
coils in series with one pair of the m = -1 coils, while the<br />
other RF source delayed by one quarter of a period feeds the<br />
other pairs similarly.<br />
The data presented compare the results for driven<br />
toroidal <strong>and</strong> poloidal current from the three different antenna<br />
configurations; m = +1 double helix in fig. 2d, m = -1 double<br />
helix in fig. 2e <strong>and</strong> the m = + <strong>and</strong> -1 helical mesh antenna in<br />
fig. 2f. The toroidal current is measured using a calibrated<br />
Rogowski belt. Poloidal current is monitored using an integrated<br />
wirewound probe placed at the centre of the minor section<br />
to measure the change in the toroidal field ABx(0,0).<br />
For all three cases the sign of the toroidal current, I
<strong>IAEA</strong>-CN-47/F-IV-2 643<br />
greater in magnitude. The AB
<strong>IAEA</strong>-CN-47/F-IV-3<br />
DEPENDENCE OF<br />
POWER ABSORBED IN A PLASMA<br />
ON ALFVEN HEATING ANTENNA PARAMETERS<br />
A.G. KIROV, V.P. SIDOROV, A.G. ELFIMOV,<br />
S.N. LOZOVSKIJ, L.F. RUCHKO, K.G. KOMOSHVILI,<br />
V.V. ONISHCHENKO, V.V. DOROKHOV, A.V. SUKACHEV,<br />
V.D. SAMUSHIA, L.Ya. MALYKH, N.L. GULASARYAN,<br />
D.A. VOJTENKO<br />
I.N. Vekua Institute of Physics <strong>and</strong> Technology,<br />
USSR State Committee for Utilization of Atomic Energy,<br />
Sukhumi, Union of Soviet Socialist Republics<br />
Abstract<br />
DEPENDENCE OF POWER ABSORBED IN A PLASMA ON ALFVEN HEATING ANTENNA<br />
PARAMETERS.<br />
The results of theoretical <strong>and</strong> experimental studies on plasma heating by Alfv6n waves are<br />
presented for various types of antennas <strong>and</strong> their parameters. The relation between central <strong>and</strong><br />
peripheral heating is analysed. Analytic expressions are given for slow Alfve'n wave amplitudes on the<br />
plasma edge. The new results of the numerical computations are analysed, <strong>and</strong> conditions for RF power<br />
input into the central plasma region for devices of different sizes are formulated. For the R-O device,<br />
a high heating efficiency of the poloidal antenna is demonstrated, <strong>and</strong> the electric field amplitudes inside<br />
the plasma column are measured.<br />
1. INTRODUCTION<br />
Alfven heating efficiency <strong>and</strong> the possibility of controlling the plasma<br />
parameters by an Alfven wave depend on the ratio between the energy input by the<br />
slow Alfven wave at the plasma edge <strong>and</strong> that by the kinetic Alfve'n wave within the<br />
conversion zone; these properties also depend on the degree of proximity of the<br />
'helical' resonance frequency to the lower boundary of the Alfve'n continuum, when<br />
the RF power input occurs near the plasma centre <strong>and</strong> the active antenna impedance<br />
is highest. These conditions depend strongly upon the antenna parameters (m, n).<br />
These items have already been considered <strong>and</strong> even partially solved, both<br />
theoretically <strong>and</strong> experimentally [1-6]. In this paper, we present our new results on<br />
this subject.<br />
2. ANALYTIC CONSIDERATION<br />
RF fields excited by an antenna with RF currents, ~ exp i(Qt - m
646 KIROV et al.<br />
Bo were determined by means of a technique described in Refs [7, 8]. The assumptions<br />
that are made <strong>and</strong> the notations we apply are the same as in Refs [7, 8]. Except<br />
for a certain region near the conversion point rA, where €| = N? (Nj| = kjC 2 /12 2 ,<br />
kn = kz (1 + m/nq)), n = kzR is the toroidal wavenumber, the amplitudes of the<br />
RF electric field components in the plasma may be represented in the form<br />
Sj = Sj + 8j, where 8/(r) is the 'smooth' part of the field connected with the fast<br />
(MHD) wave <strong>and</strong> determined from the solution of a second order MHD equation<br />
[9, 10], <strong>and</strong> £j(r) is the 'fast alternating' part of the field connected with the slow<br />
Alfven wave of small wavelength \A or damping depth vph),<br />
no(rA) 2m<br />
no(a) m + nq(a)<br />
<strong>IAEA</strong>-CN-47/F-IV-3 647<br />
(no(r) is the plasma density for a hot peripheral plasma, XA/2ira — 8s/a).<br />
We see from Eq. (2) that, for sufficiently low plasma density at the boundary,<br />
the amplitude Sr(a) (but not S^,) may reach high values. This effect is essentially<br />
connected with the stationary current jz <strong>and</strong> disappears when jz(a) = 0.<br />
3. NUMERICAL COMPUTATIONS<br />
The antenna active impedances were calculated in cylindrical geometry within<br />
the kinetic approach, using the one-dimensional numerical code EPSI, analogous<br />
to [3]. It is shown that the maximum impedance <strong>and</strong> the best RF power input localization<br />
occur at |Ic^a] = 2.5 for devices with various aspect ratios: INTOR ( = 4.2;<br />
circular cross-section), TFTR («3.0) <strong>and</strong> T-10 ( = 5.1).<br />
In Ref. [4], the RF power absorption maximum had been found, in the MHD<br />
approach, at |kza| = 2.5 for m = -1. Here, this effect is found for modes with<br />
m = +1, -2, -3, -4. Figure 1 shows an example of the active plasma impedance<br />
versus the position of the local Alfve'n resonance point XA. The computations have<br />
been carried out for INTOR, with the plasma density distributed parabolically <strong>and</strong><br />
the electron temperature profile given by Te(x) = To {1 - [1 - (T,/T0) 1/Y ]x 2 } 1 ',<br />
where 7 = 4/3, Tt/T0 = 0.025, q(a) = 2.19. Figure l(b) shows the impedance<br />
curves for the m = +1 mode. We see that the direction of wave rotation does not<br />
'A p = me/m|<br />
100<br />
50<br />
n= 10 -<br />
12-,<br />
(b)<br />
A-<br />
/ \<br />
J \<br />
K<br />
m<br />
\<br />
=1 •<br />
1.0<br />
1<br />
0 = me/nii<br />
FIG. 1. Plasma impedance versus conversion point position for various INTOR modes (a) for m < 0;<br />
(b) for m > 0.<br />
(2)
648 KIROV et al.<br />
400<br />
200<br />
(a)<br />
m = -1<br />
n = -10 ,<br />
0.03<br />
0.0 0.5 1.0 0.0<br />
FIG. 2. Plasma impedance versus conversion point position for m = —I, n = —10 mode at various<br />
values (a) of plasma current, (b) of shear (y parameter).<br />
0.0<br />
(a) (b)<br />
FIG. 3. Radial distribution of electric field <strong>and</strong> absorbed power in R-O device: (a) for<br />
m = —n = —2; (b) for m = —1, n = 3.<br />
have any substantial effect on the value of the absorption, which is due to small<br />
gyrotropy in INTOR (fi/wci :£ 0.1). The effect of the plasma current on the plasma<br />
impedance properties has been studied. The results shown- in Fig. 2(a) permit the<br />
conclusion that a current value of ~ 5 MA is preferable from the point of view of<br />
absorption level <strong>and</strong> its localization (here, y — 2/3).<br />
As is seen from Fig. 2(b), a shear effect of the magnetic field only occurs in<br />
that part of the plasma where high-Q kinetic resonances are observed. The parameter<br />
7 determines the temperature <strong>and</strong> the current (through Spitzer's conductivity law)<br />
profiles (here, q(a) = 1.44).<br />
The 'global' Alfve'n modes [4, 5, 10] are studied as a function of ll^al, <strong>and</strong> it<br />
is shown that (1) below the Alfve'n continuum threshold, there may exist two <strong>and</strong><br />
more resonances of the 'global' mode <strong>and</strong>, (2) in certain conditions, the 'global'<br />
mode may penetrate into the continuum for Ik^a] < 1 <strong>and</strong> leave it for ll^al > 2.5.
<strong>IAEA</strong>-CN-47/F-IV-3 649<br />
Fields <strong>and</strong> absorbed power have been computed for the devices of the R-O type<br />
(a = 3.5 cm, R = 50 cm, Bo = 2.5 kG, T0(0) = 15 eV, = 2 X 10 13 crrr 3 ).<br />
Figures 3(a,b) show the distributions of the electric fields <strong>and</strong> absorbed power<br />
densities for the m = -2, n = 2 <strong>and</strong> m = — 1, n = 3 modes, respectively. The<br />
conversion point was fixed at XA = 0.65. It is seen that, for the m = — 1, n = 3<br />
mode, the slow Alfv6n wave contribution to the power absorbed at the plasma<br />
boundary is small <strong>and</strong> the main portion of the power is absorbed in the central zone.<br />
Calculations carried out for various conversion point positions <strong>and</strong> for frequencies<br />
below the Alfve'n continuum threshold have shown that the wave amplitudes <strong>and</strong> the<br />
power input at the periphery for the m = — 1, n = 3 mode are always smaller than<br />
for the m = -2, n = 2 mode.<br />
4. EXPERIMENTAL STUDIES<br />
The R-O device [1] is an I = 3 stellarator with a quartz discharge chamber<br />
(R = 50 cm, b = 5 cm, a = 3.5-4 cm, Bo S 8 kG, t S 0.8). The helical <strong>and</strong><br />
poloidal antennas were fed by separate generators with frequencies chosen so as to<br />
satisfy the Alfven resonance condition in radially close regions. For the helical<br />
antenna with m = +2, n = +2, the frequency is f = 1.25 MHz, while for the<br />
poloidal one with m = +1, n = +3, we have f = 2.2 MHz.<br />
FIG. 4. Energy content (I), plasma density (2) <strong>and</strong> absorbed RF power due to helical (3) <strong>and</strong><br />
poloidal (4) antennas: {1,2 — only helical antenna switched on). H2, i0 = 0.4, Bo = 2.6 kG.<br />
t (ms)
650 KIROV et al.<br />
40 (kW)<br />
FIG. 5. Temperature increase for helical (!) <strong>and</strong> poloidal (2) antennas versus absorbed RF power.<br />
H2, ig = 0.4, Bo = 2.6 kG, = 7.5 x JO 13 cm' 3 .<br />
FIG. 6. Radial distribution ofRF-field E component measured at instants of time indicated by arrows<br />
in Fig. 4: 1 - f = 1.25 MHz, helical antenna; 2 - f = 2.15 MHz, poloidal antenna; H2, i0 = 0.4,<br />
Bo = 2.6 kG.<br />
The principal goal of the experiments was to study the dependence of the<br />
relative heating efficiencies <strong>and</strong> the impedances on m, n <strong>and</strong> on the types of antennas.<br />
The discharge oscillograms are shown in Fig. 4. The special generator produced an<br />
initial plasma with fio ~ (1-1.5) x 10 13 cm" 3 <strong>and</strong> Te = 5 eV; then the helical<br />
antenna was switched on <strong>and</strong>, later, the poloidal antenna with m= ±l,n= =F3<br />
was turned on. From the plasma diamagnetism, density <strong>and</strong> absorbed power<br />
measurements, the temperature increase (AT) <strong>and</strong>, hence, the heating efficiency<br />
(•q = (AT/P) n
<strong>IAEA</strong>-CN-47/F-IV-3 651<br />
Estimates of active impedances, Za = 2P/I 2 , for both types of antennas were made,<br />
<strong>and</strong> it was found that they depend weakly on the level of power input.<br />
Figure 6 shows the distributions of the electric fields in the plasma (measured<br />
by a double electrical probe), excited by helical <strong>and</strong> poloidal antennas. We see that,<br />
for the helical antenna, the electric field amplitudes at the plasma boundary (the<br />
separatrix radius is rs = 3.5 cm) are much larger than in the region of r = 2.5 cm,<br />
which was identified as a conversion zone. For the poloidal antenna, the field<br />
amplitudes in these regions are comparable. These results indicate that the m = ± 1,<br />
n = =F3 wave heats the central plasma region quite efficiently while the m = ±2,<br />
n = =F 2 wave is absorbed mainly in the boundary region as a result of predominant<br />
excitation of a peripheral slow Alfven wave, which accounts for the low efficiency<br />
heating by the helical antenna, under the given conditions.<br />
The analytic (Eq. (2)) <strong>and</strong> numerical (Fig. 3) computations show that, for the<br />
m = -1, n = 3 mode, the field amplitudes are smaller at the plasma boundary than<br />
in the plasma core, <strong>and</strong> RF power is absorbed mainly in the inner region. In contrast<br />
to this, for the m = — 2, n = 2 mode, the field amplitudes at the boundary are much<br />
larger, <strong>and</strong> power is absorbed predominantly at the periphery.<br />
Thus, the results of the experiments, the numerical <strong>and</strong> the analytic computations<br />
agree qualitatively. The present experiments cannot, however, set forth all<br />
possible merits of the kinds of antennas in question since in our experiments this<br />
possible effect is masked by the strong dependence of wave generation <strong>and</strong> absorption<br />
on m <strong>and</strong> n.<br />
5. CONCLUSIONS<br />
The analytic <strong>and</strong> numerical calculations <strong>and</strong> the experimental results presented<br />
demonstrate, as a whole, that, for efficient plasma heating, modes with large<br />
n/m ratios should be generated. For a wide class of devices (T-10, INTOR), this ratio<br />
varies from 10 to 12. For INTOR, the optimum mode has m = -1, n = -10.<br />
The experiments presented demonstrate a substantial increase in Alfven heating<br />
efficiency, even if one proceeds from n/m = -1 to n/m = -3.<br />
REFERENCES<br />
[1] KIROV, A.G., et al., in Plasma Physics <strong>and</strong> Controlled <strong>Nuclear</strong> Fusion Research 1984 (Proc.<br />
10th Int. Conf. London, 1984), Vol. 1, <strong>IAEA</strong>, Vienna (1985) 643.<br />
[2] KIROV, A.G., et al., in Controlled Fusion <strong>and</strong> Plasma Physics (Proc. 12th Europ. Conf.<br />
Budapest, 1985), Vol. 2, Part 2, European Physical Society (1985) 260.<br />
[3] ROSS, D.W., LI, Y., MAHAJAN, S.M., MICHIE, R.B., Nucl. Fusion 26 (1986) 139.<br />
[4] APPERT, K., VACLAVIK, J., Plasma Phys. 25 (1983) 551.<br />
[5] APPERT, K., VACLAVIK, J., VILLARD, L., Phys. Fluids 27 (1984) 432.<br />
[6] DE CHAMBRIER, A., et al., in Plasma Physics <strong>and</strong> Controlled <strong>Nuclear</strong> Fusion Research 1984<br />
(Proc. 10th Int. Conf. London, 1984), Vol. 1, <strong>IAEA</strong>, Vienna (1985) 531.
652 KIROV et al.<br />
[7] LOZOVSKY, S.N., DOROKHOV, V.V., Jr., Fiz. Plazmy 11 (1985) 539;<br />
ELFIMOV, A.G., Fiz. Plazmy 11 (1985) 550;<br />
ELFIMOV, A.G., in Heating in Toroidal Plasmas (Proc. 2nd Joint Varenna-Grenoble Int. Symp.<br />
Como, 1980), Vol. 2, CEC, Brussels (1980) 683.<br />
[8] ELFIMOV, A.G., LOZOVSKY, S.N., DOROKHOV, V.V., Jr., Nucl. Fusion 24 (1984) 609.<br />
[9] SOLOVI'EV, L.S., in Voprosy Teorii Plazmy (LEONTOVICH, M.A., Ed.), Vol. 6, Moscow,<br />
Atomizdat (1972).<br />
[10] ROSS, D.W., CHEN, G.L., MAHAJAN, S.M., Phys. Fluids 25 (1982) 652.
RECENT ADVANCES IN THE THEORY<br />
AND MODELLING OF RF HEATING<br />
IN INHOMOGENEOUS PLASMAS<br />
D.G. SWANSON, S. CHO<br />
Department of Physics,<br />
Auburn University,<br />
Auburn, Alabama<br />
C.K. PHILLIPS<br />
Princeton Plasma Physics Laboratory,<br />
Princeton University,<br />
Princeton, New Jersey<br />
D.Q. HWANG<br />
Department of Applied Science,<br />
University of California, Davis/Livermore,<br />
Livermore, California<br />
W. HOULBERG, L. HIVELY<br />
Oak Ridge National Laboratory,<br />
Oak Ridge, Tennessee<br />
United States of America<br />
Abstract<br />
<strong>IAEA</strong>-CN-47/F-IV-4<br />
RECENT ADVANCES IN THE THEORY AND MODELLING OF RF HEATING IN<br />
INHOMOGENEOUS PLASMAS.<br />
Theoretical <strong>and</strong> numerical modelling of rf heating in inhomogeneous plasmas is discussed.<br />
(1) A case is examined near the lower hybrid resonance where two turning points are encountered near<br />
one another, first from a cold to a warm wave <strong>and</strong> then from the warm wave to an ion Bernstein mode.<br />
This leads to a sixth order equation which is difficult to solve as it has a quadratic coefficient.<br />
(2) Improved asymptotic representations are presented whose accuracy is crucial to the numerical solution<br />
of this type of equation. (3) A new method of exact order reduction for higher order equations with<br />
no approximations permits generation of a numerical Green function by integrating only second order<br />
equations. The differential equation is factored with an asymptotically small source term. The resulting<br />
integral equation is more easily solved. (4) A formalism for determining the 2-D structure of the wave<br />
fields <strong>and</strong> the associated power deposition profiles within the mode conversion-absorption layer has<br />
been developed by applying the parabolic approximation method to the linearized Vlasov-Maxwell<br />
equations. The new method reduces the problem to the solution of one fourth order equation <strong>and</strong> an<br />
associated parabolic diffusion type equation. (5) Time dependent transport simulations of ICRF heated<br />
discharges in tokamaks with circular <strong>and</strong> non-circular cross-sections are presented. The simulations are<br />
obtained by interfacing the WHIST 2-D MHD equilibrium <strong>and</strong> a 1-D flux surface averaged transport<br />
code with a ray tracing algorithm.<br />
653
654 SWANSON et al.<br />
1. Three Wave Mode Conversion Equation<br />
The dispersion relation for lower hybrid waves near ion cyclotron harmonics<br />
is approximately given by[l]<br />
•"<br />
where n is the harmonic number being considered <strong>and</strong> v — -^-.<br />
= 5*i/»£,., f = |y = («/*i«*) 2 , ?» - With themagnetic field<br />
B(x) = Bo/(l + x/R) where R is the major radius (i> — n = nx/R), the dispersion<br />
relation can be further approximated by the cubic equation in A or k\<br />
b4x)k\ + (a2 + b2x + cix i )k\ - [a0 + box) = 0 (2)<br />
which describes the couplings between the incident lower hybrid wave, the ion<br />
plasma wave, <strong>and</strong> the ion Bernstein wave (cold, warm, <strong>and</strong> hot wave, respectively).<br />
To obtain Eq. (2), we exp<strong>and</strong>ed v about n <strong>and</strong> A about Ao(= 2 \ l<br />
the warm wave value. This approximation is compared to eq. (1) in Fig. 1.<br />
FIG. 1. Comparison of dispersion relations (k\ versus v) of Eq. (1) (dark lines) with Eq. (2) (light<br />
lines) near the 45th harmonic for typical PLT parameters.<br />
This is converted into the differential equation<br />
W")"' + + +<br />
with suitable F,- because it has the conserved quantity<br />
(1)<br />
(3)<br />
(4)
<strong>IAEA</strong>-CN-47/F-IV-4 655<br />
rather than replacing k± by »^, since although the simplified coefficients do not<br />
guarantee energy conservation, they do guarantee constant power flow asymptotically<br />
<strong>and</strong> enable one to represent the various amounts of power into various<br />
waves.<br />
2. Numerical Method<br />
Due to the quadratic term in Pi, which is essential to describe couplings<br />
between all three waves, the Laplace transform method is no longer directly<br />
integrable. Thus we use WKBJ approximations <strong>and</strong> numerical integration.<br />
The asymptotic solutions are:<br />
—oo +00<br />
2<br />
where a = [|(64/2) - y/{bt/2)' - c2\\ \ (3 = [[(64/2) + V(64/2)» - c2|J 8 , <strong>and</strong><br />
T = \/^o/c2! w ith 6oj ^4) «2 < 0. Taking the incoming <strong>and</strong> outgoing cold <strong>and</strong><br />
warm waves, <strong>and</strong> the exponentially decaying hot solution as initial conditions as<br />
x —* +oo, we integrate five functions until x —* —00, then find the transfer matrix<br />
by exp<strong>and</strong>ing those functions in terms of six asymptotic solutions. Tunneling <strong>and</strong><br />
reflection coefficients for a specific branch may be found by using any basis of<br />
asymptotic solutions, while conversion coefficients from one branch to another<br />
cannot be found in this way, since the differential equation is homogeneous <strong>and</strong><br />
solutions may be multiplied by an arbitrary constant which must be determined<br />
by a physical quantity we are interested in. Thus, to express conversion of energy<br />
from the cold to the warm wave, we must multiply the energy flux ratio, pcw =<br />
S(ipw)IS{ipc)> associated with two waves in a given basis set, by the conversion<br />
coefficient obtained numerically, where if),, <strong>and</strong> ^m are cold <strong>and</strong> warm asymptotic<br />
solutions as x —* 00.<br />
To improve the accuracy of tunneling, reflection, <strong>and</strong> conversion coefficients,<br />
we include higher order terms such as<br />
) [ ( 5 § )] (5)<br />
Coefficients up to fourth order are found with the help of the symbolic algebra<br />
routine REDUCE. A matrix formulation is being developed to find asymptotic<br />
solutions more accurately <strong>and</strong> efficiently, since the overall accuracy of the coefficients<br />
is directly related to the accuracy of the asymptotic basis set.
656 SWANSON et al.<br />
3. Exact Order Reduction in Mode Conversion<br />
Attempts have been made to eliminate the difficulties associated with a class<br />
of fourth order differential equations with exponentially growing solutions by<br />
reducing the order of the equation[2,3]. While these methods have been successful<br />
in evaluating the transmission, reflection <strong>and</strong> conversion coefficients with<br />
approximate equations <strong>and</strong> no localized absorption, the only successful methods<br />
of including the cyclotron absorption are based on fourth order equations[l,4].<br />
An exact method is described whereby only second order differential equations<br />
need be solved numerically, avoiding approximations <strong>and</strong> growing solutions.<br />
The problem is to solve the fourth order differential equation<br />
y iv + b(x)y"+a{x)y = O (6)<br />
where the generally complex coefficients a(x) <strong>and</strong> b(x) are real <strong>and</strong> asymptotically<br />
constant plus linear. This equation is then factored by using the WKBJ roots of<br />
the equation<br />
d 2 ,,,<br />
where k%(x) = [b(x)±\/b 2 (x) - 4o(a;)]/2; after a variable change so that b -> X 2 z<br />
<strong>and</strong> a —+ \ 2 z+~t asymptotically, the roots are defined in terms of their asymptotic<br />
behavior by the relations k\ wA-1 <strong>and</strong> kl « 1 + (l+i)/\ 2 z. Then Eq. (7),<br />
written as D+D-y = g(x), is an exact representation of Eq. (6) with solution<br />
V>(*)= f°° G(x,z)g(z)dz (8)<br />
J-oo<br />
This is an inhomogeneous integral equation of the second kind, since 5 (z) contains<br />
the unknown 4>[z) <strong>and</strong> its derivative, <strong>and</strong> the factors in Eq. (7) have been carefully<br />
arranged so that the inhomogeneous term vanishes asymptotically at least as fast<br />
as z~ 2 . Now, G(x,z) is a fourth order Green function which must be obtained<br />
numerically, but it is constructed from solutions of second order equations only.<br />
The first two solutions of the adjoint equation D-D+G = 0 are the numerical<br />
solutions of D+* = " + fc+(«)* = 0. The other two solutions are constructed<br />
from the numerical solutions of £>_$ = 0 <strong>and</strong> *i <strong>and</strong> *2 since D+G = 4>, so *3<br />
<strong>and</strong> 4*4 are obtained from a second order Green function constructed from the<br />
first two solutions. Then a fourth order Green function can be constructed to<br />
solve Eq. (7). The integral equation has a well behaved kernel <strong>and</strong> converges by<br />
iteration.<br />
4. 2D Mode Conversion - Parabolic Approximation<br />
During fast magnetosonic wave heating of tokamaks, mode conversion <strong>and</strong><br />
absorption processes are generally important only in a thin layer located about
<strong>IAEA</strong>-CN-47/F-IV-4 657<br />
the cyclotron resonance layer. Within this layer, the parabolic approximation<br />
method[5] has been used to determine the two-dimensional structure of the propagating<br />
finite size wavefronts. The layer may be modeled as a uniform plasma slab<br />
in which x, y,z denote the major radial, vertical, <strong>and</strong> toroidal directions <strong>and</strong> the<br />
equilibrium magnetic field varies as B = Bo(l—x/R), where R is the major radius.<br />
The mode conversion-tunneling equation is derived from the linearized Vlasov-<br />
Maxwell equations by following procedures used by Swanson[6] but explicitly<br />
retaining y-derivatives of perturbed quantities. In the limit me/m,- —+ 0 <strong>and</strong> neglecting<br />
terms of higher order than (kv/kx) 2 <strong>and</strong> (kxpi) 2 , where fc,- denotes the i th<br />
component of the wave vector <strong>and</strong> pi is the ion Larmor radius, the wave equation<br />
reduces to two coupled pde's for Ex <strong>and</strong> Ev, where E denotes the wave electric<br />
field. Using the paraxial propagation constraint that kv & -g^B consists of the neoclassical<br />
coefficient plus an anomalous contribution equal to OAxe- Comparison of the<br />
data with the simulation indicates that the experimental energy confinement is<br />
more favorable than L-mode. Since CIT is designed to operate with a divertor,
658 SWANSON et al.<br />
RFON RFOFF<br />
I t I<br />
500<br />
< I<br />
TIME(msec)<br />
(a)<br />
60<br />
> 40 -<br />
—<br />
20 _<br />
n<br />
1<br />
CIT<br />
4<br />
RFON<br />
I<br />
|<br />
r<br />
-1 /'<br />
f :<br />
RFOFF 1<br />
1000 10 12<br />
TIME(sec)<br />
(b)<br />
j. sim<br />
rsim<br />
'e,o -<br />
FIG. 2. (a) L-mode simulation of PUT ICRF experiments. T" m 0 <strong>and</strong> T" m 0 are the central electron <strong>and</strong><br />
ion temperatures from the code results, while T'fg <strong>and</strong> V* p 0 are the experimental measurements<br />
reported by Mazzucato et al. [9]. hi*'"indicates the extent of the experimentally observed sawtooth<br />
amplitude on Te 0.<br />
(b) H-mode simulation of CIT plasmas [10]. Ignition is achieved in the simulation with a 2 s pulse of<br />
20 MW of ICRF heating at a frequency of 105 MHz in a D-T- 3 He plasma.<br />
H-mode scaling was assumed for Xt while Xi was the same as for PLT. The simulation<br />
indicates that ignition should be possible in CIT with the current design<br />
parameters.<br />
Acknowledgment<br />
This work was supported by the U. S. Department of Energy, Contracts DE-<br />
AC02-76-CHO-3073 <strong>and</strong> DE-AC05-84OR21400,<strong>and</strong> by Grant DE-FG05-ER53206.<br />
REFERENCES<br />
[1] SWANSON, D.G., Phys. Fluids 28 (1985) 2645.<br />
[2] FUCHS, V., KO, K., BERS, A., Phys. Flulids 24 (1981) 1251.<br />
[3] CAIRNS, R.A., LASHMORE-DAVIES, C.N., Phys. Fluids 26 (1983) 1268.<br />
[4] COLESTOCK, P.L., KASHUBA, R.J., Nucl. Fusion 23 (1983) 763.<br />
[5] PHILLIPS, C.K., PERKINS, F.W., HWANG, D.Q., Phys. Fluids 29 (1986) 1608.<br />
[6] SWANSON, D.G., Phys. Fluids 24 (1981) 2035.<br />
[7] HOULBERG, W.A., ATTENBERGER, S.E., LAO, L., in Advances in Mathematical Methods<br />
for the Solution of <strong>Nuclear</strong> Engineering Problems (Proc. Int. Top. Mtg. Karlsruhe, 1981),<br />
Vol. 2, Fachinformationszentrum Energie, Physik, Mathematik GmbH, Karlsruhe (1981) 425.<br />
[8] HWANG, D.Q., et al., Rep. PPPL-1990, Princeton Plasma Physics Lab., Princeton University,<br />
Princeton, NJ (1983).<br />
[9] MAZZUCATO, E., BELL, R., BITTER, M., et al., in Plasma Physics <strong>and</strong> Controlled <strong>Nuclear</strong><br />
Fusion Research 1984 (Proc. 10th Int. Conf. London, 1984), Vol. 1, <strong>IAEA</strong>, Vienna (1985) 433.<br />
[10] SCHMIDT, }., et al., paper <strong>IAEA</strong>-CN^7/H-I-2, these Proceedings, Vol. 3.<br />
[11] KAYE, S.M., GOLDSTON, R.J., Nucl. Fusion 25 (1985) 65.
ELECTRON CYCLOTRON CURRENT DRIVE<br />
AND SUPRA-THERMAL GENERATION<br />
IN LARGE TOKAMAKS<br />
T.J. SCHEP, R.W. POLMAN, E. WESTERHOF, L. KLIEB<br />
Association Euratom-FOM,<br />
FOM Instituut voor Plasmafysica,<br />
Rijnhuizen, Nieuwegein,<br />
Netherl<strong>and</strong>s<br />
Abstract<br />
<strong>IAEA</strong>-CN-47/F-IV-5<br />
ELECTRON CYCLOTRON CURRENT DRIVE AND SUPRA-THERMAL GENERATION IN<br />
LARGE TOKAMAKS.<br />
Top launch of electron cyclotron wave energy into large tokamaks is considered with the aim of<br />
investigating the possibilities of spatially localized power deposition in the far tail of the electron distribution<br />
function. Such an injection scheme is favourable from the point of view of current drive <strong>and</strong><br />
generation of a supra-thermal electron population. Oblique injection of the extraordinary mode with a<br />
frequency below the local cyclotron frequency is most suitable for this purpose.<br />
INTRODUCTION<br />
Recent experiments with strong additional heating on JET [1]<br />
<strong>and</strong> TFTR [2] give evidence of a strong correlation between the<br />
current <strong>and</strong> temperature profiles in tokamak discharges. The de-<br />
coupling of these profiles could clear the way to increase the<br />
energy content of the plasma <strong>and</strong> to improve its confinement.<br />
This could be achieved by driving part of the current non-<br />
inductively or by carrying the current by a supra-thermal elec-<br />
tron population. The noninductive current can be provided by<br />
various methods. The shape of the current profile, however,<br />
might well be the important factor which determines eventually<br />
the efficiency, in terms of plasma energy content <strong>and</strong> confine-<br />
ment time, of the non-inductive current generation [3]. The fa-<br />
vourable feature of electron cyclotron power deposition <strong>and</strong><br />
current drive is its localized character. This could provide<br />
the means for the necessary tailoring of the current profile,<br />
even with modest EC-driven currents.<br />
659
660 SCHEP et al.<br />
In this paper, power deposition, current drive, <strong>and</strong> generation<br />
of supra-thermal electrons by electron cyclotron waves are<br />
discussed for JET <strong>and</strong> TFTR plasmas. In particular, top launch<br />
of RF power in the extraordinary mode is investigated.<br />
ELECTRON CYCLOTRON RESONANCE AND RAY TRACING<br />
The relativistic electron cyclotron resonance condition is<br />
(0 y<br />
Y - — - NM pn/mc = 0, where Y = [1 + pf/m 2 c 2 + p,|/m 2 c 2 ] 2<br />
u II II 1 II<br />
<strong>and</strong> N,| is the parallel refractive index. All other quantities<br />
have their usual meaning. In the Pn"^ plane the resonance<br />
condition is represented by the straight line Y-1 = A+NH PM /me,<br />
where A =
<strong>IAEA</strong>-CN-47/F-IV-5 661<br />
~ be<br />
temperature profile are given by ne(^) = (no-riL,)[1 -an if n ] n +n ,<br />
T(*) = (T -T )[1-a * b T] c T+T, where ^ 2 = (¥-*„)/| 1>,-*J , *<br />
6 U L i l LI O LI U<br />
being the poloidal flux function <strong>and</strong> \|> its value at the<br />
Lt t O<br />
limiter <strong>and</strong> magnetic axis respectively, with suitable choices<br />
for the coefficients n . <strong>and</strong> T . .<br />
o,L o,L<br />
POWER DEPOSITION IN REAL AND MOMENTUM SPACE<br />
Power deposition in JET along rays that are injected under a<br />
variety of angles from several positions into medium (n<br />
5*10 19 m" 3 ) <strong>and</strong> high (n = 10 20 m" 3 ) density Maxwellian plasmas<br />
with central temperatures of 5 <strong>and</strong> 10 keV has been extensively<br />
investigated for various equilibria, density profiles, <strong>and</strong> fre-<br />
quencies [8], With the proper choice of frequencies the results<br />
for JET <strong>and</strong> TFTR are analogous for st<strong>and</strong>ard discharges. In the<br />
case of TFTR we have investigated super-shot 23260 because of<br />
its broad T -profile <strong>and</strong> its large shift of the magnetic axis<br />
6<br />
[9]. The special features of this shot lead to interesting results<br />
even at the relatively low frequency of 90 GHz.<br />
The direction of the injected rays is specified by the<br />
angles 9 <strong>and</strong> , where 9 is the angle between the ray <strong>and</strong> the<br />
vertical direction, <strong>and</strong> is the angle between the projection<br />
of the ray on the equatorial plane <strong>and</strong> the major radius. The<br />
dependence of the ray trajectories <strong>and</strong> of the power deposition<br />
on the injection angles is analyzed by scanning in at fixed 9<br />
<strong>and</strong> vice versa. With a proper choice of frequency <strong>and</strong> launching<br />
angles, complete power absorption with good spatial localization<br />
can be obtained in both medium <strong>and</strong> high density plasmas<br />
with central temperatures in the range 5-10 keV. Figures 1 <strong>and</strong><br />
2 show typical results of a e-scan at = -80° in JET <strong>and</strong> TFTR<br />
for a Maxwellian plasma. The projections of the ray paths on<br />
the poloidal plane are depicted in Figs. 1a <strong>and</strong> 2a. In Figs. 1b<br />
<strong>and</strong> 2b the b<strong>and</strong>s, in terms of ty <strong>and</strong> E~, within which the intensity<br />
drops from 90% to "\0% of the injected value, are plotted<br />
versus 9. Similar features as in a 9-scan are shown by -scans.<br />
The study yields the following results [8]. The density has<br />
only a weak influence on the position where the wave power is<br />
absorbed up to densities close to the cut-off value. Only minor<br />
changes in the results are found for density profiles with<br />
strongly different peaking factors. For higher temperatures the
662<br />
Cm)<br />
z<br />
0 -1.0 0.0 1.0<br />
Cm)<br />
SCHEP et al.<br />
1.25<br />
1.00<br />
0.75<br />
0.50<br />
0.25<br />
position<br />
0 = -80°<br />
BO<br />
0.00<br />
120 130 140 150 160 170<br />
FIG. 1. Results of a scan in 6 (at = -80°) in JET (70 GHz). The rays are launched from<br />
R = 3.0 m, Z = 1.95 m). The equilibrium corresponds to JET-3901 with n0 = 5 x lO 19 m~ 3 ,<br />
To = 5 keV (&„, T = 1, bn, r = 2, cn_ T = 1) <strong>and</strong> B = 3.4 Tat R = 2.96 m. 6 = 125° (1), 135° (2),<br />
145° (3), 155° (4), 165° (5), 175° (6).<br />
FIG. 2. Results of a scan in 6 (at = -80°) in TFTR (90 GHz). The rays are launched from<br />
R = 2.55 m, Z = 1.00 m. Equilibrium <strong>and</strong> profiles as in TFTR-23260: R = 2.46 m, a = 0.80 m,<br />
B = 5T,no= 7 x lO 19 m~ 3 (nL= 7 x 1O IS m' 3 , an = 1, bn = 1.5, cn = 4) <strong>and</strong> To = 7 keV<br />
(TL = 30 eV, aT =l.bT = 2, cT = 1). d = 155° (1), 145° (2), 135° (3), 125° (4), 115° (5).<br />
CkeV)<br />
CkeV)<br />
deposition b<strong>and</strong> narrows somewhat <strong>and</strong> shifts to higher values of<br />
to /io <strong>and</strong> rays directed more towards the centre <strong>and</strong> towards the<br />
inboard side show increased absorption. Results for power injection<br />
from several positions in a top-port show that rays can<br />
be injected more steeply <strong>and</strong> more towards the high-field side<br />
when injected from positions with larger major radii. With a<br />
E"
1.0<br />
• °- a<br />
0.6 -<br />
0.4 -<br />
_ energy<br />
0.2 -<br />
1<br />
position<br />
><br />
i<br />
• = -80°<br />
\<br />
L<br />
<strong>IAEA</strong>-CN-47/F-IV-5 663<br />
' 1<br />
//<br />
1:<br />
(a)<br />
i i<br />
, energy<br />
" position<br />
0.0<br />
i i 1 i<br />
t i<br />
1 1<br />
125 135 145 155 165 175-120-110-100 -90 -80 -70 -60<br />
Cb)<br />
9= 155°<br />
^ ^<br />
*• 8 *• «<br />
200<br />
- 160<br />
FIG. 3. Ray tracing results in the presence of a supra-thermal population. The dashed b<strong>and</strong>s correspond<br />
to a purely Maxwellian plasma, a) a scan in 6 at = —80°, b) a scan in at 9 = 155°.<br />
proper choice of the injection angles for each launching posi-<br />
tion, the power can be deposited around the same flux surface<br />
<strong>and</strong> be absorbed by particles in the same energy range. For<br />
larger values of to /u (i.e., lower frequency or higher B-val-<br />
120<br />
-80<br />
-40<br />
CkeV)<br />
ues) the absorption decreases. Also in paramagnetic equilibria<br />
(i.e. higher B) the absorption will be lower. Typical values<br />
for the resonant energies are given in the Table for near-<br />
centre deposition in JET-3901. Similar results are found for<br />
TFTR.<br />
In the presence of a supra-thermal electron population the ab-<br />
sorption behaviour changes strongly. This is illustrated in<br />
Fig. 3 for a paramagnetic equilibrium (the low-q JET shot 777*1,<br />
rescaled to B = 3-43 T at R = 2.96 m). For a 10 keV, no=<br />
5*10 l9 m" 3 Maxwellian plasma full absorption is obtained up to<br />
6 = 155° (at = -80°) <strong>and</strong> for > -90° (at 8 = 155°) with particle<br />
energies around 50 keV. We assume that the power in these rays<br />
produces a supra-thermal population with ns = 5*10 l7 m~ 3 , T =<br />
50 keV <strong>and</strong> < v,, > = 0.331 c inside the surface ty = 0.6 (this<br />
value of < Vii > is not realistic from the point of view of<br />
supra-thermal current, but, here, we consider power absorp-<br />
tion). Then, the range in 9 <strong>and</strong>
664 SCHEP et al.<br />
CURRENT DRIVE EFFICIENCY<br />
The non-inductive current I, generated by a point spectrum of<br />
electron cyclotron waves, is discussed in Ref. [10]. According<br />
to this theory, the current that can be carried by relativistlc<br />
particles with energy mc z (Y-1) <strong>and</strong> parallel momentum P|| is<br />
J A/W<br />
2TTR P . R(m)n2 P<br />
d u n<br />
where R is the major radius, n20 the density in 10 20 m" 3 , W the RF<br />
power <strong>and</strong> (j/P ) the normalized efficiency [10]. For the ener-<br />
gies under consideration we have I/W = [6/(5+Z „„)] (I/W)z f.P_i •<br />
61 X 61 X — I<br />
From Table I <strong>and</strong> Eq. (1), the following rough estimate is obtained<br />
for the efficiency of current drive with near-central<br />
power deposition T (10" eV)<br />
o<br />
= a -^j—, A/W (2)<br />
R(m) n 20<br />
where a = 0.15-0.30 for the temperatures <strong>and</strong> densities under<br />
consideration. Here, we have assumed that all the wave power is<br />
absorbed by resonant particles with the lowest energy E~.<br />
The profiles of power deposition <strong>and</strong> current drive for a<br />
modelled launching system are given in Fig. 4. In Fig.4a a mag-<br />
netic equilibrium similar to JET-777 1 * has been investigated<br />
with n =0.5'10 2 ° m~ 3 <strong>and</strong> T =5 keV. The toroidal field has been<br />
o o<br />
rescaled to B = 3.2 T at R = 2.96 m, which optimizes the ab-<br />
sorption around the q=1 surface (r = 45 cm). In Fig. 4b the<br />
equilibrium <strong>and</strong> plasma parameters are chosen to represent TFTR-<br />
23260. The large shift of the magnetic axis in this particular<br />
discharge does allow for central power deposition <strong>and</strong> current<br />
drive (cf. Fig. 2). The calculations show that j(r) = P(r) which<br />
yields an overall efficiency I/W £ 0.05 A/W in agreement with (2).<br />
TABLE I. E" FOR NEAR CENTRE DEPOSITION<br />
T0(keV)<br />
5<br />
5<br />
noOn "')<br />
0.5 x<br />
1 X<br />
10 20<br />
10 20<br />
E"(keV)<br />
25-35<br />
10-25<br />
T0(keV)<br />
10<br />
10<br />
no(m<br />
0.5 x<br />
1 X<br />
10 20<br />
10 20<br />
E"(keV)<br />
60-80<br />
35-55
0.00 0.0<br />
0.0 0.4 0.8 1.2<br />
>• r Cm)<br />
<strong>IAEA</strong>-CN-47/F-IV-5 665<br />
I<br />
F/G. 4. a) Power deposition <strong>and</strong> current profile in JET 7774 (70 GHz). Two Gaussian beams (halfwidth<br />
5°) of 0.5 MW are launched at R = 2.94 <strong>and</strong> 3.06. The injection angles of the beam centres are<br />
6 = 150°, = -80° <strong>and</strong> 6 = 155°, = -80°. b) Power deposition <strong>and</strong> current profile in TFTR<br />
23260 (90 GHz). 1 MWis launched in a Gaussian beam (half-width 5°) from the top of the TFTR vessel<br />
(R = 2.55). The injection angles of the beam centre are 0 = 145°, 4> = -80°.<br />
The widths of the profiles are mainly due to the assumed angu-<br />
lar spread of 5° of each beam, <strong>and</strong> are to a lesser extend the<br />
result of the different absorption lengths along the indiviual<br />
rays. Hence, the localization of the power deposition <strong>and</strong> of<br />
the driven current depends to a large extend on the qualities<br />
of an actual launching system.<br />
SUPRA-THERMAL ELECTRON GENERATION<br />
The power deposition <strong>and</strong> the current drive efficiency are cal-<br />
culated under the assumption that the RF power is absorbed by<br />
high-energetic, resonant particles without distorting the tail<br />
of the Maxwellian. A necessary condition for the validity of<br />
these results is, thus, that collisions are sufficiently fre-<br />
quent so that the RF power can be transferred to the bulk of<br />
the distribution function by collisional energy loss of reso-<br />
nant particles. When this condition is not fulfilled, resonant<br />
particles will run away in momentum space <strong>and</strong> strong non-Max-<br />
wellian effects are expected [11].<br />
The power lost per unit volume by high energetic particles<br />
with density n due to collisions with bulk particles is<br />
p coll - ns f 2 vc(v) = 6.10 3 asn= MW-nT where v =<br />
pe In AMimv3 is the collision frequency (X,nA = 15 has been
666 SCHEP et al.<br />
taken), <strong>and</strong> a is the fraction of resonant particles. Estimats<br />
ing a for a Maxwellian plasma we arrive at<br />
s<br />
-E/T (AE)<br />
p coii = °- 4 ' 103 i y —~ n » MW
<strong>IAEA</strong>-CN-47/F-IV-5 667<br />
the q=1 surface). The overall current drive efficiency is pre-<br />
dicted to be >0.O5 A/W in both cases.<br />
Supra-thermal effects are expected for a few MW of RF power.<br />
The creation of suprathermals will drastically alter the ab-<br />
sorption by the plasma, <strong>and</strong> will allow the interaction with<br />
higher energetic particles in the tail of the supra-thermal<br />
distribution, leading to an increased current drive efficiency.<br />
Thus EC wave injection at down-shifted frequencies from a<br />
top-port in a large tokamak (e.g. 70 GHz for B =3.4T (JET) or<br />
90 GHz for B = 5 T (TFTR)) is an attractive tool for current<br />
profile control.<br />
ACKNOWLEDGEMENTS<br />
Fruitful discussions with Prof.Dr. F. Engelmann are gratefully<br />
acknowledged. This work was performed under the Euratom-FOM<br />
association agreement with financial support from ZWO <strong>and</strong><br />
Euratom <strong>and</strong> in part under JET Article 14 Contract no. JJ5/9007.<br />
REFERENCES<br />
[1] REBUT, P.H., BRUSATI, M., Plasma Phys. Controll. Fusion 28 (1986) 113.<br />
[2] MURAKAMI, M., et al., Plasma Phys. Controll. Fusion 28 (1986) 17.<br />
[3] FURTH, H.P., Plasma Phys. Controll. Fusion 28 (1986) 1305.<br />
[4] MAZZUCATO, E., FIDONE, I., GIRUZZI, G., KRIVENSKI, V., Nucl. Fusion 26 (1986) 3.<br />
[5] KRITZ, A.H., HSUAN, H., GOLDFINGER, R.C., BATCHELOR, D.B., Ray-Tracing Study<br />
of Electron-Cyclotron Heating in Toroidal Geometry, Rep. PPPL-1980, Princeton Plasma<br />
Physics Laboratory (1983).<br />
[6] BORNATICI, B., CANO, R., De BARBIERI, O., ENGELMANN, F., Nucl. Fusion 23 (1983)<br />
1153.<br />
[7] BORNATICI, M., RUFFINA, U., WESTERHOF, E., Plasma Phys. Controll. Fusion 28 (1986)<br />
629.<br />
[8] POLMAN, R.W., SCHEP, T.J., WESTERHOF, E., KLIEB, L., in Report on JET, Article 14,<br />
Contract No. JJ5/9007.<br />
[9] GREK, B., JOHNSON, D., private communication.<br />
[10] FISCH, N.J., Phys. Rev., A 24 6 (1981) 3245.<br />
[11] DEMEIO, L., ENGELMANN, F., in Mathematical Aspects of Fluids <strong>and</strong> Plasma Dynamics<br />
(Proc. Workshop Trieste, 1984) (1984) 201.
Session A-I<br />
Session A-II<br />
Session A-III<br />
Session A-IV<br />
Session A-V<br />
Session A-VI<br />
Session F-I<br />
Session F-II<br />
Session F-III<br />
Secientific<br />
Secretaries:<br />
Administrative<br />
Secretary:<br />
Editors:<br />
CHAIRMEN OF SESSIONS<br />
S. MORI<br />
D.M. MEADE<br />
J.B. LISTER<br />
M. KEILHACKER<br />
R.A. GROSS<br />
L.E. ZAKHAROV<br />
Volume 1<br />
O.S. PAVLICHENKO<br />
R.R. PARKER<br />
F.G. PREVOT<br />
Japan<br />
USA<br />
Switzerl<strong>and</strong><br />
JET<br />
USA<br />
USSR<br />
USSR<br />
USA<br />
France<br />
SECRETARIAT OF THE CONFERENCE<br />
M. LEISER<br />
A.A. SHURYGIN<br />
Edith PILLER<br />
J.W. WEIL<br />
Maria DEMIR<br />
Division of Research <strong>and</strong><br />
Laboratories, <strong>IAEA</strong><br />
Division of External<br />
Relations, <strong>IAEA</strong><br />
Division of Publications,<br />
<strong>IAEA</strong><br />
Records Officer: J. RICHARDSON Division of Languages,<br />
<strong>IAEA</strong><br />
669
HOW TO ORDER <strong>IAEA</strong> PUBLICATIONS<br />
An exclusive sales agent for <strong>IAEA</strong> publications, to whom all orders<br />
<strong>and</strong> inquiries should be addressed, has been appointed<br />
in the following country:<br />
UNITED STATES OF AMERICA BERNAN - UNIPUB, 4611-F Assembly Drive, Lanham, MD 20706-4391<br />
In the following countries <strong>IAEA</strong> publications may be purchased from the<br />
sales agents or booksellers listed or through<br />
major local booksellers. Payment can be made in local<br />
currency or with UNESCO coupons.<br />
ARGENTINA<br />
AUSTRALIA<br />
BELGIUM<br />
CHILE<br />
CHINA<br />
CZECHOSLOVAKIA<br />
FRANCE<br />
HUNGARY<br />
INDIA<br />
ISRAEL<br />
ITALY<br />
JAPAN<br />
PAKISTAN<br />
POLAND<br />
ROMANIA<br />
SOUTH AFRICA<br />
SPAIN<br />
SWEDEN<br />
UNITED KINGDOM<br />
USSR<br />
YUGOSLAVIA<br />
Comision Nacional de Energi'a Atomica, Av/enida del Libertador 8250,<br />
RA-1429 8uenos Aires<br />
Hunter Publications, 58 AGipps Street, Collingwood, Victoria 3066<br />
Service Courrier UNESCO, 202, Avenue du Roi, B-1060 Brussels<br />
Comisi6n Chilena de Energi'a <strong>Nuclear</strong>, Venta de Publicaciones,<br />
Amunategui 95, Casilla 188-D, Santiago<br />
<strong>IAEA</strong> Publications in Chinese:<br />
China <strong>Nuclear</strong> Energy Industry Corporation, Translation Section,<br />
P.O. Box 2103, Beijing<br />
<strong>IAEA</strong> Publications other than in Chinese:<br />
China National Publications Import & Export Corporation,<br />
Deutsche Abteilung, P.O. Box 88, Beijing<br />
S.N.T.L., Mikul<strong>and</strong>ska4,CS-116 86 Prague 1<br />
Alfa, Publishers, Hurbanovo namestie 3.CS-815 89 Bratislava<br />
Office International de Documentation et Librairie,48, rue Gay-Lussac,<br />
F-75240 Paris Cedex 05<br />
Kultura, Hungarian Foreign Trading Company,<br />
P.O. Box 149, H-1389 Budapest 62<br />
Oxford Book <strong>and</strong> Stationery Co., 17, Park Street, Calcutta-700 016<br />
Oxford Book <strong>and</strong> Stationery Co.,Scindia House, New Delhi-110 001<br />
Heiliger <strong>and</strong> Co., Ltd,Scientific <strong>and</strong> Medical Books,<br />
3, Nathan Strauss Street, Jerusalem 94227<br />
Libreria Scientifica, Dott. Lucio de Biasio "aeiou",<br />
Via Meravigli 16, 1-20123 Milan<br />
Maruzen Company, Ltd, P.O. Box 5050,100-31 Tokyo International<br />
Mirza Book Agency, 65, Shahrah Quaid-e-Azam, P.O. Box 729, Lahore 3<br />
Ars Poiona-Ruch, Centrala H<strong>and</strong>lu Zagranicznego,<br />
Krakowskie Przedmiescie 7, PL-00-068 Warsaw<br />
llexim, P O. Box 136-137, Bucharest<br />
Van Schaik Bookstore (Pty) Ltd, P.O. Box 724, Pretoria 0001<br />
Diaz de Santos, Lagasca 95, E-28006 Madrid<br />
Diaz de Santos, Balmes 417, E-08022 Barcelona<br />
AB Fritzes Kungl. Hovbokh<strong>and</strong>el, Fredsgatan 2, P.O. Box 16356,<br />
S-103 27 Stockholm<br />
Her Majesty's Stationery Office, Publications Centre, Agency Section,<br />
51 Nine Elms Lane, London SW8 5DR<br />
Mezhdunarodnaya Kniga,Smolenskaya-Sennaya 32-34, Moscow G-200<br />
Jugoslovenska Knjiga, Terazije 27, P.O. Box 36, YU-11001 Belgrade<br />
Orders from countries where sales agents have not yet been appointed <strong>and</strong><br />
requests for information should be addressed directly to:<br />
Division of Publications<br />
International Atomic Energy Agency<br />
Wagramerstrasse 5, P.O. Box 100, A-1400 Vienna, Austria
INTERNATIONAL<br />
ATOMIC ENERGY AGENCY<br />
VIENNA, 1987<br />
SUBJECT GROUP: III<br />
Physics/Plasma Physics, Fusion<br />
PRICE: Austrian Schillings 1400,-