Hydrolife Canada February/March 2017
It is amazing how an event from almost 20 years ago can remain fresh in the mind. It certainly doesn’t seem that long ago that Canadian Ross Rebagliati rocketed down Nagano’s Olympic giant slalom snowboard course, ripping through the finish line to claim the first-ever Olympic men’s snowboarding gold medal despite starting the final run in eighth position. Since then, Rebagliati has become a cultural phenomenon and advocate of marijuana use, and it is no coincidence that since that foggy day on Mount Yakebitai near Nagano, how we perceive the use of marijuana in society has changed for the better. Hydrolife recently caught up with Rebagliati to talk about Nagano, his thoughts on marijuana, and the launch of Ross’ Gold.
It is amazing how an event from almost 20 years ago can remain fresh in the mind. It certainly doesn’t seem that long ago that Canadian Ross Rebagliati rocketed down Nagano’s Olympic giant slalom snowboard course, ripping through the finish line to claim the first-ever Olympic men’s snowboarding gold medal despite starting the final run in eighth position. Since then, Rebagliati has become a cultural phenomenon and advocate of marijuana
use, and it is no coincidence that since that foggy day on Mount Yakebitai near Nagano, how we perceive the use of marijuana in society has changed for the better. Hydrolife recently caught up with Rebagliati to talk about Nagano, his thoughts on marijuana, and the launch of Ross’ Gold.

You also want an ePaper? Increase the reach of your titles
YUMPU automatically turns print PDFs into web optimized ePapers that Google loves.
enjoy<br />
COMPREHENDING YOUR<br />
CANNABIS TEST RESULTS<br />
BY JODI MCDONALD<br />
No matter the reason<br />
you tested your<br />
cannabis plants, the<br />
lab results are useless<br />
if you don’t know how<br />
to read the report.<br />
Jodi McDonald gives<br />
us the lowdown on<br />
cannabinoid potency<br />
reports and how to get<br />
the most out of them.<br />
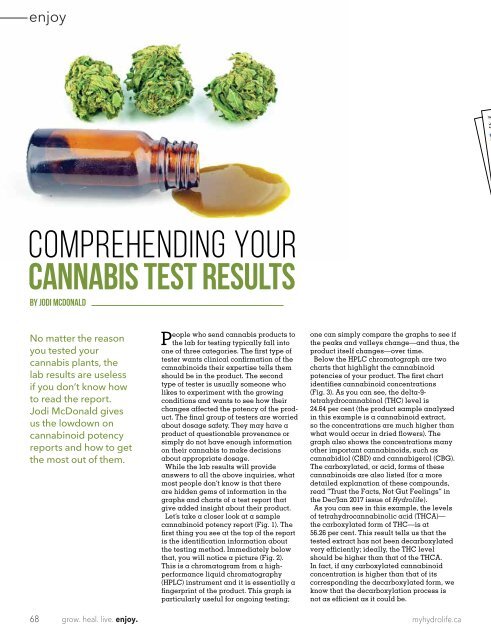
People who send cannabis products to<br />
the lab for testing typically fall into<br />
one of three categories. The first type of<br />
tester wants clinical confirmation of the<br />
cannabinoids their expertise tells them<br />
should be in the product. The second<br />
type of tester is usually someone who<br />
likes to experiment with the growing<br />
conditions and wants to see how their<br />
changes affected the potency of the product.<br />
The final group of testers are worried<br />
about dosage safety. They may have a<br />
product of questionable provenance or<br />
simply do not have enough information<br />
on their cannabis to make decisions<br />
about appropriate dosage.<br />
While the lab results will provide<br />
answers to all the above inquiries, what<br />
most people don’t know is that there<br />
are hidden gems of information in the<br />
graphs and charts of a test report that<br />
give added insight about their product.<br />
Let’s take a closer look at a sample<br />
cannabinoid potency report (Fig. 1). The<br />
first thing you see at the top of the report<br />
is the identification information about<br />
the testing method. Immediately below<br />
that, you will notice a picture (Fig. 2).<br />
This is a chromatogram from a highperformance<br />
liquid chromatography<br />
(HPLC) instrument and it is essentially a<br />
fingerprint of the product. This graph is<br />
particularly useful for ongoing testing;<br />
one can simply compare the graphs to see if<br />
the peaks and valleys change—and thus, the<br />
product itself changes—over time.<br />
Below the HPLC chromatograph are two<br />
charts that highlight the cannabinoid<br />
potencies of your product. The first chart<br />
identifies cannabinoid concentrations<br />
(Fig. 3). As you can see, the delta-9-<br />
tetrahydrocannabinol (THC) level is<br />
24.64 per cent (the product sample analyzed<br />
in this example is a cannabinoid extract,<br />
so the concentrations are much higher than<br />
what would occur in dried flowers). The<br />
graph also shows the concentrations many<br />
other important cannabinoids, such as<br />
cannabidiol (CBD) and cannabigerol (CBG).<br />
The carboxylated, or acid, forms of these<br />
cannabinoids are also listed (for a more<br />
detailed explanation of these compounds,<br />
read “Trust the Facts, Not Gut Feelings” in<br />
the Dec/Jan <strong>2017</strong> issue of <strong>Hydrolife</strong>).<br />
As you can see in this example, the levels<br />
of tetrahydrocannabinolic acid (THCA)—<br />
the carboxylated form of THC—is at<br />
56.26 per cent. This result tells us that the<br />
tested extract has not been decarboxylated<br />
very efficiently; ideally, the THC level<br />
should be higher than that of the THCA.<br />
In fact, if any carboxylated cannabinoid<br />
concentration is higher than that of its<br />
corresponding the decarboxylated form, we<br />
know that the decarboxylation process is<br />
not as efficient as it could be.<br />
68<br />
grow. heal. live. enjoy.<br />
myhydrolife.ca
![Hydrolife Magazine December 2017/January 2018 [CANADIAN EDITION]](https://img.yumpu.com/59790088/1/190x247/hydrolife-magazine-december-2017-january-2018-canadian-edition.jpg?quality=85)
![Hydrolife Magazine December 2017/January 2018 [USA EDITION]](https://img.yumpu.com/59790042/1/190x247/hydrolife-magazine-december-2017-january-2018-usa-edition.jpg?quality=85)
![Hydrolife Magazine October/November 2017 [Canada Edition]](https://img.yumpu.com/59493562/1/190x247/hydrolife-magazine-october-november-2017-canada-edition.jpg?quality=85)
![Hydrolife Magazine October/November 2017 [USA Edition]](https://img.yumpu.com/59493548/1/190x247/hydrolife-magazine-october-november-2017-usa-edition.jpg?quality=85)
![Hydrolife Magazine August/September 2017 [USA Edition]](https://img.yumpu.com/59236656/1/190x247/hydrolife-magazine-august-september-2017-usa-edition.jpg?quality=85)