Biology - College of Science - University of Notre Dame
Biology - College of Science - University of Notre Dame
Biology - College of Science - University of Notre Dame

Create successful ePaper yourself
Turn your PDF publications into a flip-book with our unique Google optimized e-Paper software.
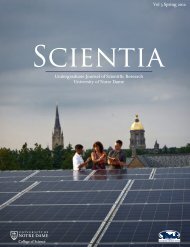
Scientia<br />
Undergraduate Research Journal for the <strong>Science</strong>s<br />
<strong>University</strong> <strong>of</strong> <strong>Notre</strong> <strong>Dame</strong><br />
Vol 2 Spring 2011<br />
Charles Edison Fund
A Letter From Dean Crawford<br />
The <strong>College</strong> <strong>of</strong> <strong>Science</strong> at <strong>Notre</strong> <strong>Dame</strong> has every reason to be proud <strong>of</strong> its undergraduate researchers. The<br />
quality <strong>of</strong> the work they perform in labs and the quality <strong>of</strong> their publications give me confidence that they<br />
will go on to excel in their respective disciplines after they graduate from this <strong>University</strong>.<br />
The pages <strong>of</strong> this journal <strong>of</strong>fer glimpses into the many fascinating topics <strong>of</strong> research in the fields <strong>of</strong> mathematics,<br />
chemistry and biochemistry, biological sciences, and physics carried out by our undergraduate students.<br />
In discussing their research, they highlight various novel facilities and initiatives around campus, such<br />
as the Digital Visualization Theater, the new particle accelerator, the “green” approach to chemistry and even<br />
the Department <strong>of</strong> Applied and Computational Mathematics and Statistics.<br />
The Scientia students join me in expressing gratitude to the Charles Edison Fund for supporting the printing<br />
<strong>of</strong> this publication. Many thanks to all the researchers for their hard work, and many thanks, likewise, to the<br />
team that has fashioned the results <strong>of</strong> the research into this attractive and informative publication.<br />
Yours in <strong>Notre</strong> <strong>Dame</strong>,<br />
Gregory P. Crawford, Ph.D.,<br />
William K. Warren II Foundation Dean <strong>of</strong> the <strong>College</strong> <strong>of</strong> <strong>Science</strong><br />
The Charles Edison Fund has generously supported the printing <strong>of</strong> this journal. The Fund is an extension <strong>of</strong> the benefactions<br />
and aspirations <strong>of</strong> its founder, Charles Edison, the son <strong>of</strong> Thomas Alva Edison, a man <strong>of</strong> discerning foresight,<br />
rare achievement and background.
Physics Reviewers<br />
Ching-Ting Hwang Section Editor<br />
Nancy Paul<br />
Biological <strong>Science</strong>s Reviewers<br />
Donna Cerabonna Section Editor<br />
Paul Baranay<br />
Allie Colaco<br />
Rachel Cotton<br />
Allan Joseph<br />
Lauren Krickl<br />
Joe Mackel<br />
Jessica Spiewak<br />
News Writers<br />
Robert Burkett Section Editor<br />
Brooke Conti<br />
Henry Gens<br />
Yuko Gruber<br />
Ricky Hennessey<br />
Elizabeth Huschke<br />
Editors-in-Chief<br />
Paul Baranay Nancy Paul<br />
Editorial Board 2010-2011<br />
Chemistry & Biochemistry Reviewers<br />
James Rudl<strong>of</strong>f Section Editor<br />
Mathematics Reviewers<br />
John Pardo Section Editor<br />
Paul Baranay<br />
Nancy Paul<br />
Prepr<strong>of</strong>essional Studies Reviewers<br />
Anjelica Nguyen Section Editor<br />
David Yang<br />
Layout, Design, & Publishing<br />
Rebecca Marton Section Editor<br />
Kate Augustine<br />
Rachel Cotton<br />
Megan Para<br />
Robert Burkett<br />
Acknowledgments: Scientia, comprised <strong>of</strong> exclusively undergraduate work, is sincerely thankful to<br />
the students who have submitted their research. Additionally, the Editorial Board expresses its gratitude<br />
for the dedication and guidance <strong>of</strong> our faculty advisor, Dominic Chaloner, Ph.D.; the Dean <strong>of</strong><br />
the <strong>College</strong> <strong>of</strong> <strong>Science</strong>, Gregory Crawford, Ph.D., for his inspiration, enthusiasm, and support for<br />
our mission; Marissa Gebhard for helping us through the publication process; and the <strong>College</strong> <strong>of</strong><br />
<strong>Science</strong>, and the Charles Edison Fund for their financial support.<br />
1
2<br />
From the Editors<br />
We are pleased to present the second edition <strong>of</strong> Scientia, the journal <strong>of</strong> undergraduate science research<br />
at the <strong>University</strong> <strong>of</strong> <strong>Notre</strong> <strong>Dame</strong>. The journal brings together, over the course <strong>of</strong> the academic year, a<br />
dynamic group <strong>of</strong> undergraduates from every department in the <strong>College</strong> <strong>of</strong> <strong>Science</strong> to organize and<br />
edit the research <strong>of</strong> their peers.<br />
With this issue, we hope to spotlight some <strong>of</strong> the scientific research being conducted by <strong>Notre</strong> <strong>Dame</strong><br />
undergraduate students. From the mathematics <strong>of</strong> knots to malaria, leaf decomposition to supernovae,<br />
Scientia gives you a taste <strong>of</strong> the rich and diverse work <strong>of</strong> <strong>Notre</strong> <strong>Dame</strong> students. Additionally, our news<br />
articles spotlight just a few <strong>of</strong> the many exciting new developments in the <strong>College</strong> <strong>of</strong> <strong>Science</strong>, such<br />
as the construction <strong>of</strong> a second particle accelerator in Nieuwland Hall and the creation <strong>of</strong> the Department<br />
<strong>of</strong> Applied and Computational Mathematics and Statistics.<br />
Beyond the publication, the 2010-2011 academic year has been a time <strong>of</strong> significant growth for the journal.<br />
In the Fall, we instituted a new meeting format that combined discussions <strong>of</strong> journal business with<br />
presentations from undergraduate and faculty researchers. These public meetings were conceived as<br />
an opportunity for <strong>Notre</strong> <strong>Dame</strong> students to come together as a research community founded on dialogue<br />
and discussion. The meetings’ informal atmosphere—as embodied by our poster slogan, which<br />
invites students to come to the meetings and “Talk <strong>Science</strong>!”—has been met with great enthusiasm.<br />
The speakers covered a diverse range <strong>of</strong> topics, as featured on page 39. We look forward to continuing<br />
these dynamic meetings in Fall 2011 with additional faculty and undergraduate speakers.<br />
Also <strong>of</strong> note, this year we gained a new funding source for the journal. Since the creation <strong>of</strong> the<br />
journal, the <strong>College</strong> <strong>of</strong> the <strong>Science</strong> and several other donors have been very supportive <strong>of</strong> Scientia’s<br />
activities. However, finding a permanent donor was always a concern <strong>of</strong> the journal staff. In December<br />
2010, thanks to the efforts <strong>of</strong> the Deans Office <strong>of</strong> the <strong>College</strong> <strong>of</strong> <strong>Science</strong>, the Charles Edison Fund<br />
agreed to provide Scientia’s publication costs each year. This generous grant will greatly ease our<br />
financial burdens, not only for next year, but the foreseeable future.<br />
To close, we thank all <strong>of</strong> the people whose efforts have made Scientia possible. This includes especially<br />
Dr. Gregory Crawford, Dean <strong>of</strong> the <strong>College</strong> <strong>of</strong> <strong>Science</strong>; the Staff <strong>of</strong> the Dean’s Office; Dr. Dominic<br />
Chaloner, our faculty advisor; and the tireless enthusiasm <strong>of</strong> our phenomenal editors, reviewers, and<br />
layout team.<br />
In <strong>Notre</strong> <strong>Dame</strong>,<br />
Nancy Paul Paul Baranay<br />
Scientia Co-Editors-in-Chief
News<br />
4 Digital Visualization Theater<br />
Elizabeth Huschke<br />
5 New Applied Math Department<br />
Robert Burkett<br />
6 A Brighter Future: Novel Application <strong>of</strong><br />
NIR Imaging Dyes in Fluorescence<br />
Guided Surgery - Patrick Kramer, Ricky<br />
Hennessey, and Brooke Conti<br />
8 New Accelerator’s Construction in<br />
Progress - Henry Gens<br />
9 The Growth <strong>of</strong> Green Chemistry<br />
Yuko Gruber<br />
Math<br />
10 Random Knot Games<br />
John Pardo, Eva Forneaus, and Alex Leaf<br />
Scientia<br />
Undergraduate Research Journal for the <strong>Science</strong>s<br />
<strong>University</strong> <strong>of</strong> <strong>Notre</strong> <strong>Dame</strong><br />
Contents<br />
Vol 2 Spring 2011<br />
Charles Edison Fund<br />
<strong>Biology</strong><br />
17 Differences Between Native and<br />
Non-Native Leaf Decomposition in<br />
Juday Creek - Katherine Baglini, Adam<br />
Lamm, and Kevin Towle<br />
22 Inconsistency <strong>of</strong> Conferred Immunity<br />
in P. Falciparum Malaria Hotspots and<br />
Implications for Immunization<br />
Development - Annette Marie Ruth<br />
Physics<br />
30 A Compound Method for Finding a<br />
Pattern in the Progenitor Systems <strong>of</strong><br />
Type 1a Supernovae - Julie Cass<br />
36 An Examination <strong>of</strong> Possible Gravitational<br />
Pertubations in the Transit Timing<br />
Variations <strong>of</strong> Exoplanet WASP-3b<br />
Colin Littlefield<br />
On the Cover<br />
An image taken with the Hubble Space<br />
Telescope <strong>of</strong> planetary nebula NGC 2818.<br />
The nebula is the outer remains <strong>of</strong> an exploded<br />
star, NGC 2818 is located in the open<br />
star cluster Messier 46. Credit: NASA, ESA,<br />
and the Hubble Heritage Team. Hubble-<br />
Site News Center image STScI-2009-05 .<br />
On the Back Cover<br />
Lensing Galaxy Cluster Abell 383. Credit:<br />
NASA, ESA, J.Richard and J.P. Kneib. Hubble-Site<br />
News Center Image STScI-2011-12<br />
3
news News<br />
4<br />
Digital Visualization Theater<br />
By: Elizabeth Huschke<br />
For many students, <strong>Notre</strong> <strong>Dame</strong>’s<br />
Philosophy <strong>of</strong> Cosmology class is the<br />
closest thing to time travel they will<br />
ever experience. They get the opportunity<br />
to step inside the minds <strong>of</strong><br />
people from pre-Galilean times and<br />
literally see the cosmos in an entirely<br />
new perspective. Best <strong>of</strong> all, they can<br />
do it without leaving the comfort <strong>of</strong><br />
the <strong>Notre</strong> <strong>Dame</strong> campus.<br />
The “time machine” that makes<br />
this experience possible is the Digital<br />
Visualization Theater (the DVT<br />
for short), which director Keith Davis<br />
calls, “the most sophisticated<br />
classroom on campus.” The DVT is<br />
a fifty-foot diameter dome housed in<br />
Jordan Hall <strong>of</strong> <strong>Science</strong> that seats 136<br />
students. It is a descendant <strong>of</strong> planetarium<br />
technology, but its founders<br />
intentionally avoided the word “planetarium”<br />
because they saw how the<br />
facility could enhance learning across<br />
the disciplines and did not want its<br />
use to be limited to astronomy and<br />
astrophysics.<br />
The Philosophy <strong>of</strong> Cosmology<br />
class uses the DVT to illustrate the<br />
pre-Galilean view <strong>of</strong> the universe and<br />
then to simulate Galileo’s observations.<br />
Later, when the class moves on<br />
to studying Kepler, the DVT is used<br />
again to present an interactive 3-D<br />
version <strong>of</strong> Kepler’s model <strong>of</strong> the cosmos.<br />
As its founders wished, the DVT’s<br />
use has not merely been limited to displaying<br />
the cosmos. <strong>Biology</strong>, chemistry,<br />
theology, music, and art are just<br />
some <strong>of</strong> the diverse disciplines that<br />
have begun incorporating the DVT into the learning process.<br />
Today, five years after its opening, classroom use<br />
remains the DVT’s number one priority. This fact makes<br />
the DVT unique among similar facilities throughout the<br />
nation - and even the world - that <strong>of</strong>ten emphasize research<br />
above teaching.<br />
The DVT’s power as a learning tool, Davis says,<br />
comes from the immersive feeling that its 360 degree<br />
dome provides. “Rather than simply looking at some-<br />
Source: <strong>Notre</strong> <strong>Dame</strong> <strong>College</strong> <strong>of</strong> <strong>Science</strong><br />
thing, you are inside <strong>of</strong> that thing,” he says. The DVT<br />
also has specialized s<strong>of</strong>tware that allows presenters to<br />
interact with 3-D objects in real time. This means that<br />
pr<strong>of</strong>essors can adapt their presentation on the spot in response<br />
to student questions or reactions.<br />
A DVT lesson usually begins when a pr<strong>of</strong>essor comes<br />
to Davis with an idea. Davis works with the pr<strong>of</strong>essor to<br />
adapt the idea to the DVT’s capabilities, and then he and<br />
a group <strong>of</strong> undergraduates do most <strong>of</strong> the actual program-<br />
scientia.nd.edu SCIENTIA Vol 2 - Spring 2011
ming. Depending on the complexity, a lecture can take<br />
anywhere from one week to two years to put together.<br />
The DVT has a successful past, and Davis has even<br />
grander visions for its future. He is working with the Center<br />
for Research Computing to get a plug-in that will make<br />
it easier to get research into the DVT. This will allow pr<strong>of</strong>essors<br />
to incorporate research data and images into the<br />
scientia.nd.edu SCIENTIA Vol 2 - Spring 2011<br />
News<br />
classroom. Davis, who was heavily involved in the local<br />
planetarium during his college years, also sees the DVT<br />
as a source <strong>of</strong> innovation that can be shared with other<br />
planetariums. With all these exciting new plans, the future<br />
<strong>of</strong> the DVT looks almost as bright as the stars and<br />
galaxies it so dazzlingly displays.<br />
New Applied Math Department<br />
By: Robert Burkett<br />
One <strong>of</strong> the most exciting developments in the <strong>College</strong><br />
<strong>of</strong> <strong>Science</strong> this year was the opening <strong>of</strong> the Department<br />
<strong>of</strong> Applied and Computational Mathematics and Statistics<br />
to undergraduates. Whereas the current mathematics degrees<br />
<strong>of</strong>fered in the <strong>College</strong> <strong>of</strong> <strong>Science</strong> and the <strong>College</strong> <strong>of</strong><br />
Arts and Letters focus on pure math—that is, math done<br />
solely for the purpose <strong>of</strong> advancing mathematical knowledge—applied<br />
math takes a more holistic approach. Applied<br />
math seeks to integrate mathematical knowledge<br />
with other subject areas, ranging from business to the<br />
hard sciences and social sciences, in order to solve problems<br />
in the real world. It is for these practical reasons<br />
that the website The Chronicle <strong>of</strong> Higher Education has<br />
ranked computational science in its top five fastest growing<br />
majors.<br />
Under the direction <strong>of</strong> Dr. Steven Buechler, the two<br />
fields were separated to allow for the development <strong>of</strong> a<br />
good statistics department. While there is some overlap<br />
between the mathematics and applied mathematics curriculums,<br />
the applied mathematics curriculum focuses<br />
more on the problem-solving aspect <strong>of</strong> math instead <strong>of</strong><br />
writing formal pro<strong>of</strong>s. Furthermore, the curriculum can<br />
be adjusted to better fit a student’s interests; students can<br />
choose a concentration in biology, economics or sociology.<br />
A supplementary major is also <strong>of</strong>fered, which is a<br />
beneficial choice for students majoring in accounting or<br />
finance due to the strong background that statistics provides<br />
for actuarial science and financial risk analysis.<br />
Applied mathematics and statistics also prepare students<br />
for a number <strong>of</strong> other jobs, including those in engineering<br />
firms and pharmaceutical and medical device companies.<br />
Besides the varied and interdisciplinary career opportunities<br />
open to students who pursue a degree in applied<br />
mathematics and statistics, another important career<br />
path is applied mathematics research. One <strong>of</strong> Dr.<br />
Buechler’s latest research projects involved the creation<br />
<strong>of</strong> a mathematical model to aid in the treatment <strong>of</strong> breast<br />
cancer. Patients diagnosed with breast cancer can choose<br />
from several treatments, yet current tests are unable to<br />
determine the necessity <strong>of</strong> chemotherapy. By examining<br />
gene expression in cancerous tumors with the help<br />
<strong>of</strong> microrays, doctors can determine if chemotherapy is<br />
unnecessary or required. While chemotherapy kills cancerous<br />
cells, the heavy toll it takes on healthy cells causes<br />
many to choose to go without it, which is <strong>of</strong>ten a fatal<br />
decision. Dr. Buechler remedied this problem through the<br />
analysis <strong>of</strong> microray data <strong>of</strong> breast cancer patients over a<br />
ten year period, eventually creating an algorithm that connected<br />
gene expression with chemotherapy effectiveness,<br />
thereby making it possible to select the most critical genes<br />
causing metastasis. If the cancer metastasizes, or spreads<br />
to other parts <strong>of</strong> the body, the result is usually fatal.<br />
In a recent interview, Dr. Buechler expressed his vision<br />
for the department and its current progress. The program<br />
<strong>of</strong>fers both an undergraduate degree and a doctorate in<br />
Applied and Computational Mathematics and Statistics.<br />
Currently there are nine faculty in the department, but<br />
Buechler would like to see that number grow to somewhere<br />
between fifteen and twenty. He also hopes to see<br />
significant developments in the department connected to<br />
the fields <strong>of</strong> biology, medicine, social sciences and engineering.<br />
Finally, he hopes to enlarge the graduate program<br />
and all educational programs within the department.<br />
The department is already in the process <strong>of</strong> reaching these<br />
goals; while <strong>Notre</strong> <strong>Dame</strong> currently has no statisticians,<br />
three will soon be hired. Furthermore, the department<br />
is developing a concentration in statistics which will be<br />
available soon, possibly at the beginning <strong>of</strong> next year.<br />
Source: <strong>Notre</strong> <strong>Dame</strong> <strong>College</strong> <strong>of</strong> <strong>Science</strong><br />
5
news News<br />
6<br />
A Brighter Future: Novel Application <strong>of</strong> NIR<br />
imaging dyes in fluorescence guided surgery<br />
By: Patrick Kramer, Ricky Hennessey, and Brooke Conti<br />
Introduction<br />
Cancer remains a central health risk in the 21st century,<br />
responsible for 13% <strong>of</strong> all deaths worldwide and affecting<br />
people <strong>of</strong> all ages, ethnicities, and genders [1]. Breast<br />
cancer, the third most common cancer, is generally unavoidable,<br />
as genetics play a larger role in the onset <strong>of</strong><br />
the disease than personal life choices. According to the<br />
American Cancer Society, in 2010 over 200,000 women<br />
were diagnosed with breast cancer, affecting one in every<br />
eight American women [2].<br />
Surgery is considered the first line <strong>of</strong> attack against<br />
breast cancer. Two current surgical procedures, mastectomies<br />
and lumpectomies, are readily available. Mastectomies<br />
involve the removal <strong>of</strong> the entire breast. It is a<br />
crude but usually successful option, although they are<br />
very extensive procedures and also require further surgeries<br />
to reconstruct the breast. The alternative surgery,<br />
a lumpectomy, preserves the appearance and sensation<br />
<strong>of</strong> the breast by only removing the tumor, but there remains<br />
a need for radiation therapy. In addition, there is a<br />
higher risk <strong>of</strong> developing a local recurrence <strong>of</strong> the cancer.<br />
Lumpectomies are less invasive, providing for a short recovery<br />
time, along with the ability to keep one’s breast<br />
generally intact. A surgical technique known as fluorescence-guided<br />
surgery has the potential to greatly improve<br />
lumpectomies. The surgery uses dyes to target particular<br />
biomarkers in tumors, which glow when exposed to nearinfrared<br />
light. In conjunction with a video display device,<br />
the tumors are illuminated on an LCD screen, allowing<br />
the surgeon to easily detect and extract malignant cells effectively<br />
and efficiently. Current products, such as methylene<br />
blue (MB) and indocyanine green (ICG), limit fluorescence-guided<br />
surgery because they are not effective<br />
at binding the cancerous cells, leaving the surgeon unsure<br />
as to whether the glowing regions seen on the monitor accurately<br />
represent the cancerous tissue [3]. This significantly<br />
increases the chances that the patient experiences a<br />
recurrent cancer, posing even more potential harm to the<br />
woman in question. Furthermore, these dyes reduce the<br />
effectiveness and the applications <strong>of</strong> fluorescence-guided<br />
surgery, keeping the “flashy” technology very impractical<br />
for large-scale implementation.<br />
Dr. Bradley Smith, Pr<strong>of</strong>essor <strong>of</strong> Chemistry and Biochemistry,<br />
is overcoming current imaging shortcomings<br />
<strong>of</strong> lumpectomies through the creation <strong>of</strong> brighter and<br />
more stable molecules that can be modified to be sited<br />
in specific surgical procedures [4]. One particular dye,<br />
named PSS-794, has great potential, as it is sixteen-times<br />
more effective at binding to specific tissues than ICG<br />
(Figure 1).<br />
Fluorescence-guided surgery using Dr. Smith’s dyes<br />
has the opportunity to affect many different cancerous<br />
markets. The initial market, breast cancer, presents great<br />
opportunities for the use <strong>of</strong> this technique due to its large<br />
size and public awareness. Practical and effective fluorescent<br />
surgery for breast cancer will allow women to opt<br />
for lumpectomies instead <strong>of</strong> mastectomies more <strong>of</strong>ten.<br />
The worries <strong>of</strong> unnecessary breast removal, radiation, or<br />
chemotherapy will be drastically minimized, as surgeons<br />
will be absolutely sure <strong>of</strong> the location and presence <strong>of</strong> any<br />
stray tumor cells. Initial reports indicate that these nearinfrared<br />
(NIR) dyes are also superior to existing products<br />
when used in imaging prostate tumors. [4]<br />
Figure 1. Comparison <strong>of</strong> PSS-794 with popular dyes.<br />
PSS-794 is more than twice as accurate when attacking<br />
tumor cells. It also fluoresces at a much higher rate,<br />
nearly 16 times that <strong>of</strong> normal ICG.<br />
Image-guided Surgery<br />
Imaging methods are crucial to optimizing surgical<br />
procedures, particularly oncological operations. However,<br />
the two most common techniques, basic ultrasound<br />
and x-ray fluoroscopy, are saddled with limitations. Ultr-<br />
scientia.nd.edu SCIENTIA Vol 2 - Spring 2011
asound requires direct contact with body tissue, while<br />
x-rays expose the patient and doctors to radiation. A recent<br />
push in medicine to expand usage beyond these two<br />
techniques has led to a growing movement towards use <strong>of</strong><br />
near-infrared (NIR) light techniques (wavelength range <strong>of</strong><br />
700 to 900 nm)<br />
Currently, there are only two clinically available NIR<br />
fluorophores: ICG and MB. Attempts have been made<br />
to both improve and expand this field, as photobleaching<br />
(loss <strong>of</strong> fluorescence over time) and limited fluorescence<br />
excitation fluence rates (brightness) <strong>of</strong> these two dyes<br />
restrict full application <strong>of</strong> imaging techniques. The dye<br />
developed by Dr. Smith and his team at the <strong>University</strong> <strong>of</strong><br />
<strong>Notre</strong> <strong>Dame</strong> has a distinctive ligand (secondary group)<br />
bonded to the base structure utilized in the indocyanine<br />
green probe that allows it to selectively target cells found<br />
in tumors better than the current options. They fluoresce<br />
in the near-infrared (NIR) spectrum (~775-2500 nm),<br />
which is advantageous because it allows for “minimal aut<strong>of</strong>luorescence,<br />
less scatter, and high optical contrast” as<br />
opposed to regular fluorophores [4].<br />
Anionic phospholipids, which are absent from the<br />
external leaflet <strong>of</strong> the plasma membrane <strong>of</strong> mammalian<br />
cells under normal conditions, become exposed on the<br />
outer surface <strong>of</strong> the cell in the event <strong>of</strong> cell death or damage.<br />
When the loss <strong>of</strong> asymmetry due to activation <strong>of</strong> the<br />
floppase enzyme occurs, the cell essentially flips. The<br />
probe, with the corresponding Zinc (II)-Dipicolylamine<br />
(Zn-DPA) ligand, targets these cells, which now contain<br />
exposed anionic phosphatidylserine (PS) molecules as the<br />
membrane no longer restricts the chemical from remaining<br />
in the interior, cytosolic part <strong>of</strong> the membrane. These<br />
dead and dying cells are found in most if not all tumor<br />
tissue. The two chemicals then associate, and, when the<br />
molecules are exposed to a near-infrared light (specifically<br />
at 794 nm), electrons are excited and fluorescence<br />
can be observed by appropriate equipment (i.e. cameras)<br />
at the source. This is known as PSS-794.<br />
Market<br />
The 50,000 women who opt for lumpectomies annually<br />
are excellent candidates for fluorescence-guided surgery<br />
utilizing Dr. Smith’s new and improved dyes. According<br />
to the National Institute <strong>of</strong> Health, “molecular imaging<br />
will become a powerful tool for biomedical research and<br />
will be synergistic component <strong>of</strong> research in molecular<br />
medicine that promises landmark improvements in clinical<br />
care” [5].<br />
Methods utilizing fluorescence-guided surgery are most<br />
advanced in procedures involving gliomas in the brain.<br />
When compared to regular operations, 65% patients in a<br />
study assigned with the fluorescing compound had their<br />
tumors completely resected, compared with 36% <strong>of</strong> pa-<br />
scientia.nd.edu SCIENTIA Vol 2 - Spring 2011<br />
News<br />
tients operated on under white light. This significant<br />
29% boost in success rate has the potential to advance<br />
surgery to new, unforeseen levels <strong>of</strong> accuracy and precision<br />
[6]<br />
It should be noted that no fluorophores have been<br />
FDA-approved for use in either breast cancer removals<br />
or sentinel lymph node mapping. However, with recent<br />
studies producing positive results, as well as the success<br />
<strong>of</strong> fluorescence-guided surgery for other types <strong>of</strong> cancer,<br />
the stage seems to be set for a movement towards developing<br />
and employing these powerful NIR dyes [7].<br />
If a dye such as PSS-794 were to be brought to market,<br />
a series <strong>of</strong> steps would have to take place over many<br />
years, perhaps decades. Initial research would have to be<br />
completed, as issues such as water solubility have yet to<br />
be completely resolved. Then, however, the dyes could<br />
begin pre-FDA trials through tumor imaging in animals.<br />
The human trials are both extensive and expensive, and<br />
the best way to achieve success in this area may be to license<br />
the technology to a larger pharmaceutical company<br />
with the resources and time to complete the many tests.<br />
After those are complete, full scale manufacturing and<br />
sales to hospitals could take place immediately.<br />
Figure 2. Zn-DPA probes selectively image tumors in<br />
a rat. Figure adapted from reference 4.<br />
Conclusion<br />
By reducing guesswork, fluorescence-guided surgery<br />
enhances procedures by making them more cost-effective<br />
for the hospital, more efficient for the patient, and more<br />
exact for the doctor. Improved NIR fluorophores such as<br />
PSS-794 are the keys to making this proposition a reality,<br />
as brighter and more precise dyes are desperately needed.<br />
Acknowledgements<br />
Dr. Bradley Smith, Erin Cole, and the other members<br />
<strong>of</strong> his lab at <strong>Notre</strong> <strong>Dame</strong> were extremely helpful advising<br />
and directing our studies. In addition, special thanks to<br />
Dr. Norbert L. Wiech and Dean Greg Crawford for their<br />
invaluable insights on our project.<br />
7
News news<br />
8<br />
References<br />
[1] Jemal, A; Bray, F, Center, MM, Ferlay, J, Ward, E, Forman, D.<br />
“Global cancer statistics.” CA: A Cancer Journal for Clinicians.<br />
Web. 04 Feb. 2011.<br />
[2] “Cancer Facts & Figures 2010.” American Cancer Society ::<br />
Information and Resources for Cancer: Breast, Colon, Prostate,<br />
Lung, and Other Forms. Web. 05 Dec. 2010.<br />
[3] Troyan et al. The FLARE TM Intraoperative Near-Infrared<br />
Fluorescence Imaging System: A First-in-Human Clinical Trial in<br />
Breast Cancer Sentinel Lymph Node Mapping. Ann Surg Oncol,<br />
2009, 16:2943–2952.<br />
By: Henry Gens<br />
Every five minutes on the website <strong>of</strong> <strong>Notre</strong> <strong>Dame</strong>’s<br />
Institute for Structure and Nuclear Astrophysics one can<br />
view the updated construction progress via webcam <strong>of</strong><br />
the Institute’s newest addition: a vertical nuclear accelerator.<br />
The first component <strong>of</strong> the accelerator, appropriately<br />
named St. GEORGE (Strong Gradient Electro-magnetic<br />
Online Recoil separator for capture Gamma ray Experiments),<br />
arrived on January 4th and will be assembled by<br />
the end <strong>of</strong> 2011. The new accelerator was purchased with<br />
funds obtained from a National <strong>Science</strong> Foundation Major<br />
Research Instrumentation grant given to Dr. Michael<br />
Wiescher <strong>of</strong> the Physics Department in 2009. In all, the<br />
cost <strong>of</strong> the accelerator and the construction on<br />
Nieuwland <strong>Science</strong> Hall to accommodate it will<br />
be roughly $5 million.<br />
St. GEORGE will replace the old horizontal<br />
nuclear accelerator that was given as a gift to the<br />
<strong>University</strong> in 1995, as the old accelerator was becoming<br />
problematically outdated. “A key replacement<br />
part, namely the charging belt, for the existing<br />
4MV single-ended accelerator was becoming<br />
nearly impossible to find,” said Dr. Ed Stech, Associate<br />
Pr<strong>of</strong>essional Specialist <strong>of</strong> the Department<br />
<strong>of</strong> Physics. “Without a good belt, this accelerator<br />
could not reliably provide the proton and alpha<br />
beam intensity needed to continue the nuclear<br />
astrophysics research in the Nuclear <strong>Science</strong><br />
Laboratory.” The new accelerator also allows the<br />
implementation <strong>of</strong> an Electron Cyclotron Resonance<br />
(ECR) source, which enables the researchers<br />
to use highly-charged ions at low velocity.<br />
St. GEORGE will play an integral role in the<br />
future research <strong>of</strong> the Institute. “The new accel-<br />
[4] Smith, B. A. et al. “Optical Imaging <strong>of</strong> Mammary and Prostate<br />
Tumors Using a Near Infrared Zinc(II)-Dipicolylamine Probe for<br />
Anionic Cell Surfaces.” Journal <strong>of</strong> the American Chemical Society,<br />
2010, 132:67-69.<br />
[5] NIH “Roadmap for Medical Research:Physical <strong>Science</strong>s Research.”<br />
FYI Number 130: October 9, 2003.<br />
[6] Jain, Kewal K. The Handbook <strong>of</strong> Biomarkers. New York:<br />
Springer, 2010, p. 111.<br />
[7] http://www.cancer.gov/clinicaltrials/results/summary/2006/<br />
fluorescence-guidedsurgery0506. Web. 13 January 2011.<br />
New Accelerator<br />
Currently in progress<br />
erator will greatly enhance the ability <strong>of</strong> researchers...to<br />
study the nuclear reactions taking place in stars throughout<br />
our universe,” said Dr. Stech. The reactions in stars<br />
take place at a very slow rate, making them difficult to<br />
study. Such reactions create heavier elements and provide<br />
the energy for these stars. St. GEORGE will facilitate the<br />
research <strong>of</strong> these processes with new methods that maintain<br />
the traditional measurement techniques in use by the<br />
Nuclear Structure Laboratory. With such a powerful new<br />
tool on its hands, it is easy to see why completion <strong>of</strong> its<br />
construction is so highly anticipated.<br />
Source: <strong>Notre</strong> <strong>Dame</strong> <strong>College</strong> <strong>of</strong> <strong>Science</strong><br />
scientia.nd.edu SCIENTIA Vol 2 - Spring 2011
The Growth <strong>of</strong> Green Chemistry<br />
By: Yuko Gruber<br />
The push to “go green” is sweeping across<br />
<strong>Notre</strong> <strong>Dame</strong>’s campus, manifesting itself in<br />
the form <strong>of</strong> dorm energy competitions, Waste-<br />
Free Wednesdays in the dining halls, and the<br />
club GreeND. Recently, the trend has spread<br />
from residential life to the laboratory, where<br />
“green chemistry” has transformed from a buzzword<br />
into a multi-faceted initiative changing the<br />
way chemistry is conducted at <strong>Notre</strong> <strong>Dame</strong>.<br />
At its core, green chemistry is an effort<br />
to replace wasteful, hazardous chemical practices<br />
with more sustainable ones. It allows for the creation<br />
<strong>of</strong> the same products and utilizes many <strong>of</strong><br />
the same techniques as more traditional forms <strong>of</strong><br />
chemistry while employing milder reagents and<br />
more efficient reactions to reduce waste products<br />
and minimize the handling <strong>of</strong> noxious chemicals.<br />
Dr. John Warner and Dr. Paul Anastas<br />
coined the phrase “green chemistry” in their<br />
book Green Chemistry: Theory and Practice,<br />
which outlines twelve principles <strong>of</strong> green chemistry.<br />
The principles serve as guidelines for increasing<br />
safety and sustainability in all forms <strong>of</strong><br />
chemistry, from those performed in industrial<br />
plants to elementary school science fairs. Dr. Warner<br />
was invited to campus last fall to participate<br />
in Energy Week, an event sponsored by the <strong>College</strong>s<br />
<strong>of</strong> <strong>Science</strong> and Engineering, where he lectured<br />
to over 175 students in his keynote address.<br />
Dr. Kathleen Peterson is at the forefront <strong>of</strong> the<br />
drive to bring green chemistry from theory to practice in<br />
<strong>Notre</strong> <strong>Dame</strong> laboratories, and began her efforts with her<br />
own students. Dr. Peterson teaches between 450 and 550<br />
organic chemistry students in labs each semester, where<br />
she emphasizes the importance <strong>of</strong> sustainability with<br />
every experiment. “In the organic laboratories students<br />
evaluate the experiments they conduct in terms <strong>of</strong> the<br />
twelve principles <strong>of</strong> green chemistry, looking at which<br />
aspects <strong>of</strong> their procedure align with the principles and<br />
which don’t,” Peterson says. “I also invite them to suggest<br />
improvements to make our labs more sustainable.”<br />
Green chemistry has the potential to revolutionize<br />
the chemical field, simultaneously <strong>of</strong>fering<br />
economic, environmental and health benefits. Reactions<br />
carried out in water rather than in hazardous solvents,<br />
for example, are cheaper to supply, generate less<br />
waste and can significantly reduce the need for expensive<br />
equipment like fume hoods. Most importantly,<br />
they present fewer risks for chemists and consumers.<br />
Source: <strong>Notre</strong> <strong>Dame</strong> <strong>College</strong> <strong>of</strong> <strong>Science</strong><br />
scientia.nd.edu SCIENTIA Vol 2 - Spring 2011<br />
News<br />
A particularly green experiment currently being<br />
conducted by <strong>Notre</strong> <strong>Dame</strong> students in Dr. Peterson’s<br />
laboratory involves the extraction <strong>of</strong> the molecule<br />
limonene from citrus fruits using dry ice. The<br />
same process is used commercially to decaffeinate c<strong>of</strong>fee.<br />
“C<strong>of</strong>fee used to be decaffeinated using methylene<br />
chloride, a chemical now suspected to be a carcinogen.<br />
This is just one <strong>of</strong> many examples <strong>of</strong> how the green<br />
initiative is transforming chemistry,” Peterson says.<br />
In addition to the small improvements made by<br />
students to lab procedures, junior chemistry major Tricia<br />
Stepanek works with Dr. Peterson to specifically research<br />
ways to better align teaching labs with the principles <strong>of</strong><br />
green chemistry. Eventually, Dr. Peterson hopes to build<br />
a whole team <strong>of</strong> students working to develop new green<br />
experiments. Regardless <strong>of</strong> their level <strong>of</strong> involvement,<br />
though, Dr. Peterson aims to raise awareness <strong>of</strong> the implications<br />
<strong>of</strong> sustainability among her students. “I want<br />
them to be ambassadors <strong>of</strong> green chemistry,” she says.<br />
9
Math<br />
10<br />
Random Knot Games<br />
John Pardo 1 , Eva Fornaeus 2 , and Alex Leaf 3<br />
Advisor: Allison Henrich 4<br />
1 <strong>University</strong> <strong>of</strong> <strong>Notre</strong> <strong>Dame</strong>, Department <strong>of</strong> Mathematics;<br />
2 Stanford <strong>University</strong>; 3 Princeton <strong>University</strong>; 4 Seattle<br />
<strong>University</strong><br />
Abstract<br />
Taking a previously developed game involving mathematical<br />
knots, we changed the player who normally has<br />
the winning strategy so that they now play “randomly”.<br />
Using previous results for the class <strong>of</strong> twist knot shadows,<br />
we calculated the probability that the “loser” will win.<br />
Specifically, we found that on a twist knot with n crossings,<br />
if n is odd the knotter has a:<br />
chance to win when going first and a:<br />
chance to win when going second, and if “n” is even the<br />
player going first has a chance to win if they are knotting<br />
and a chance to win if they are unknotting. We will<br />
explain some knot basics, the original game, and our own<br />
results.<br />
Introduction and Knot Basics<br />
One <strong>of</strong> the most effective ways to solve problems in<br />
mathematics is to play with various mathematical ob jects<br />
and see what results from those careless antics. When we<br />
first learned about mathematical knots and what previous<br />
teams had done with them in [2], we immediately started<br />
to play around with knots to see what more we could learn<br />
about them. We ended up playing a variant <strong>of</strong> a knot game<br />
we had learned about, and came up with some interesting<br />
developments. First, we must explain what a knot is to a<br />
mathematician. Since it is <strong>of</strong>ten very important to have a<br />
rigorous and concise definition in mathematics, a knot is<br />
defined as follows:<br />
Definition 1. A knot is any embedding <strong>of</strong> the circle into<br />
3-dimensional space.<br />
Although it is true that this definition is rigorous and<br />
concise, it lacks any sort <strong>of</strong> motivation - we will now provide<br />
a more intuitive construction. Take a piece <strong>of</strong> rope<br />
with the property that we may stretch and twist and pull<br />
this rope all we want without breaking it. Now, tangle and<br />
tie this rope up to your heart’s content, and then glue the<br />
two ends <strong>of</strong> the rope together. Then the resulting object is<br />
a mathematical knot. Notice that this does in fact coincide<br />
with our more precise definition: the fact that we live in<br />
three dimensions matches the 3-dimensional space part,<br />
the fact that matter in our world cannot be ‘co-located’<br />
with other matter (that is, two distinct ob jects cannot<br />
share the same spatial location) matches the embedding<br />
part, the fact that we twisted the rope in any way we wanted<br />
matches the any embedding part, and the fact that we<br />
glued the ends <strong>of</strong> the rope together at the end matches the<br />
circle part. Pictured below are some examples <strong>of</strong> knots;<br />
such pictures are called knot diagrams. Please take notice<br />
<strong>of</strong> the Unknot, the most basic and thus the most important<br />
knot considered.<br />
Figure 1a:<br />
The Unknot<br />
Figure 1b:<br />
The Trefoil Knot<br />
Now that we know what knots are, we can discuss<br />
some <strong>of</strong> the basic concepts needed for our game:<br />
Definition 2: A knot shadow is a knot diagram without its<br />
crossings resolved. That is, in a knot shadow one does not<br />
know which strand is the over-strand and which strand is<br />
the under-strand. For this reason we call the crossings in<br />
a knot shadow precrossings.<br />
The concept <strong>of</strong> a knot shadow is important because<br />
our game is played by turning a knot shadow into a knot<br />
diagram. Now we just need to answer one <strong>of</strong> the most<br />
fundamentally important questions in knot theory before<br />
we can move on to our game: how can we tell if two knots<br />
are the same knot? After all, if we were holding a knot<br />
in our hands and we decided to tangle and untangle the<br />
strands <strong>of</strong> the knot without ever breaking or cutting them,<br />
we would want to consider any resulting knot to be the<br />
same as the knot with which we started. But then if we<br />
are given two seemingly different knots, how can we tell<br />
that one can be contorted to match the other? To answer<br />
this question, let us introduce the concept <strong>of</strong> Reidemeister<br />
Moves, a set <strong>of</strong> three actions that can be performed on a<br />
knot that do not change the knot. The Type I Reidemeister<br />
Move allows one to remove (or introduce) a loop into the<br />
knot by crossing a strand over itself, the Type II Reidemeister<br />
Move allows one to pass one strand over or under<br />
another strand and the Type III Reidemeister Move allows<br />
one to pass a strand over or under a crossing (please<br />
notice that the strand must be either completely over or<br />
scientia.nd.edu SCIENTIA Vol 2 - Spring 2011<br />
Figure 1c:<br />
A Celtic Knot
completely under both strands involved in the crossing).<br />
These three maneuvers are pictured below:<br />
Figure 2a:<br />
Type I<br />
Figure 2b:<br />
Type 2<br />
Figure 2: The Reidemeister Moves<br />
Figure 2c:<br />
Type 3<br />
It is obvious that the Reidemeister Moves do not appreciably<br />
alter the knot, but perhaps there are other ways<br />
we could alter a knot that are not encompassed in the Reidemeister<br />
Moves? In fact, it is a proven result <strong>of</strong> knot<br />
theory that two knots are the same if and only if each one<br />
can be made to match the other through a finite sequence<br />
<strong>of</strong> Reidemeister Moves. As a result, we can just focus<br />
on using Reidemeister Moves to determine the results <strong>of</strong><br />
our game.<br />
The Game and How We Changed It<br />
The basic knot game is quite simple. Given a knot<br />
shadow, two players take turns resolving precrossings<br />
on that shadow. That is, each player takes a turn picking<br />
one <strong>of</strong> the remaining unresolved crossings in the knot<br />
shadow and choosing which strand is the over-strand and<br />
which strand is the under-strand. The way the winner is<br />
determined is also simple - one player has the goal <strong>of</strong> ultimately<br />
making the unknot, and the other player wants<br />
the final result to be any other knot. In keeping with the<br />
Shakespearean theme <strong>of</strong> the original paper on this game<br />
and for ease <strong>of</strong> discussion, we will henceforth refer to the<br />
unknotter as Ursula and the knotter as King Lear.<br />
It is a basic result <strong>of</strong> game theory that, given a game<br />
between two players such that the game must end after<br />
finitely many turns and such that the final configuration<br />
<strong>of</strong> the game must have a winner, one <strong>of</strong> the players in<br />
that game must have a winning strategy i.e. one player<br />
can be absolutely sure to win win assuming that one<br />
player makes the best move at each stage <strong>of</strong> the game.<br />
Since each shadow has finitely many crossings and the<br />
final knot must either be the unknot or not the unknot, our<br />
game meets these conditions and so one <strong>of</strong> the players<br />
must have a winning strategy.<br />
This knot game was originally developed by Henrich<br />
et al. in [2]. In their work, they determined the winning<br />
strategies for knot shadows <strong>of</strong> a special class <strong>of</strong> knots<br />
called twist knots. A twist knot is a knot that has two<br />
distinct “regions” <strong>of</strong> crossings, one <strong>of</strong> which has exactly<br />
2 crossings, which we call the “clasp”, and the other <strong>of</strong><br />
which has some positive number <strong>of</strong> crossings, which we<br />
scientia.nd.edu SCIENTIA Vol 2 - Spring 2011<br />
Figure 3: Some Examples <strong>of</strong> Twist Knots<br />
Math<br />
call the “twists.” The picture below provides examples <strong>of</strong><br />
twist knots:<br />
And these are some examples <strong>of</strong> twist shadows:<br />
Figure 9: Some Examples <strong>of</strong> Twist Shadows<br />
Figure 4: Some Examples <strong>of</strong> Twist Shadows<br />
Henrich et al. found that when the number <strong>of</strong> crossings<br />
in the twists is even the player who moves second<br />
has the winning strategy (regardless <strong>of</strong> whether they are<br />
knotting or unknotting), and that when the number <strong>of</strong><br />
crossings in the twists is odd the unknotter has the winning<br />
strategy(regardless <strong>of</strong> whether they move first or<br />
second). We leave the pro<strong>of</strong> <strong>of</strong> these results to the reader,<br />
as the coming discussion should make it clear how such<br />
pro<strong>of</strong>s might work.<br />
Given this knot game, we decided to make a slight alteration<br />
- we decided to change the way the “winner” (i.e.<br />
the player with the winning strategy) will play the game.<br />
Instead <strong>of</strong> making the best possible move at each stage,<br />
the winner will now make a random move, with each possible<br />
move having an equal probability. This brings us to<br />
the situation where there is a player who could<br />
be guaranteed to win but who does not necessarily win,<br />
thus giving the “loser” a non-trivial chance to win. Our<br />
work then became clear; we calculated the probability<br />
that the loser might win for the case <strong>of</strong> twist knots, and<br />
then attempted to expand our results to the more general<br />
m,n-twist knot (a twist knot where the clasp may have<br />
more than 2 crossings). We would like to emphasize that,<br />
although the probabilities calculated are important, it is<br />
the strategies themselves that are interesting. With that,<br />
let us take you through our thought process below.<br />
King Lear has a Winning Strategy<br />
We will start with the case where the twist knot has an<br />
even number <strong>of</strong> twist precrossings and Ursula plays first.<br />
This is the only instance where King Lear has the winning<br />
strategy and is also the easiest case to work out. Before<br />
we consider this case however, let us clarify some <strong>of</strong> the<br />
11
Math<br />
12<br />
terms and techniques we will consider in our discussion.<br />
First, we introduce the concept <strong>of</strong> locking and unlocking<br />
the clasp. We call the clasp “locked” if it cannot be<br />
undone by a Type II Reidemeister Move, and we call it<br />
“unlocked” if it can be. These are both pictured below:<br />
Figure 5:<br />
A Locked Clasp<br />
Figure 6: An Unlocked Clasp<br />
This is a very important consideration because if the<br />
clasp is unlocked, the resulting shadow must be reducible<br />
to the unknot via a series <strong>of</strong> Type I Reidemeister Moves<br />
and so Ursula will always win in this situation. This is not<br />
the only way to make an unknot however.<br />
It is also possible that two moves in the twists will be<br />
able to cancel each other using a Type II Reidemeister<br />
Move, as pictured below. Since only parity is important<br />
here, it does not actually matter that the moves be adjacent<br />
once the shadow is completely resolved. In the case<br />
<strong>of</strong> an even number <strong>of</strong> twists, it is possible to completely<br />
unknot the twists via Type II Reidemeister Moves and<br />
thereby turn the entire knot into the unknot via Type I<br />
Reidemeister Moves.<br />
Figure 7a: Before Figure 7b: After<br />
Figure 7: A Partially Untwisted Twist via a<br />
Type II Reidemeister Move<br />
Conversely, for a shadow having an odd number <strong>of</strong><br />
twists, it is possible to reduce the twists to a single crossing,<br />
allowing the knot to be resolved in exactly one <strong>of</strong> the<br />
two ways pictured below.<br />
Figure 8a: The Trefoil<br />
Figure 8: The Two Ways to Resolve a<br />
Twist Knot with One Twist<br />
These are the means <strong>of</strong> creating the unknot from a<br />
knot shadow, and so the reader is encouraged to keep<br />
them in mind in reading this paper.<br />
So now assume we are playing the game under the<br />
conditions above (there are an even number <strong>of</strong> twists and<br />
Ursula plays first) and that King Lear is playing “randomly.”<br />
Then we have the following result:<br />
Theorem 1. The probability for Ursula to win is<br />
This probability is the same regardless <strong>of</strong> whether Ursula<br />
starts in the clasp or in the twist.<br />
Pro<strong>of</strong>. If Ursula starts by resolving one <strong>of</strong> the clasp precrossings,<br />
the probability that King Lear loses immediately<br />
by unlocking the clasp is:<br />
Moreover, if King Lear moves in the twist - an event<br />
which has probability:<br />
Ursula can immediately win by unlocking the clasp on her<br />
second turn. So the only way King Lear can potentially<br />
win is by locking the clasp on his first turn, which has<br />
probability:<br />
So assume King Lear has locked the clasp. Now Ursula<br />
must be the first to move in the twists, which she does<br />
(it doesn’t matter what she does). King Lear must now<br />
move, and whatever he does will do one <strong>of</strong> two things;<br />
if his move matches Ursula’s, her next move must be to<br />
cancel his move in order to maximize her chances <strong>of</strong> winningthey<br />
can win if they counter every move made by the<br />
unknotter with a move <strong>of</strong> the same sign, so that some precrossing,<br />
and if his move cancels out Ursula’s move with<br />
a Type II Reidemeister Move, it is as if Ursula is choosing<br />
a new first move for a shadow with 2 fewer twists. In<br />
fact, this will be the exact situation at every stage <strong>of</strong> play<br />
scientia.nd.edu SCIENTIA Vol 2 - Spring 2011<br />
Figure 8b: The Unknot
until there is only one precrossing left in the twists, with<br />
King Lear having the final move. Because <strong>of</strong> Ursula’s intelligent<br />
playing, all the resolved crossings will reduce to<br />
one crossing. Thus, King Lear can do one <strong>of</strong> two things:<br />
he can resolve the crossing so that a Type II Reidemeister<br />
Move will reduce the whole thing to the unknot, or he can<br />
resolve it so that it matches Ursula’s final move and thus<br />
does not create the unknot. This second move is the only<br />
way King Lear will win, and he has a 1/2 chance <strong>of</strong> making<br />
each choice. Thus, King Lear has a total probability<br />
<strong>of</strong> winning <strong>of</strong><br />
which accordingly gives Ursula a win probability <strong>of</strong><br />
But now we must consider what could have happened<br />
if Ursula made her first move in the twists. So assume<br />
Ursula moves first in the twists. If King Lear ever plays<br />
in the clasp first, Ursula can then immediately unlock the<br />
clasp and guarantee a win. Thus, King Lear must keep<br />
making moves in the twists until Ursula is forced to move<br />
first in the clasp. The probability that he does this is<br />
As before, King Lear must make his last move in the<br />
twists so that they do not all cancel out via Type II Reidemeister<br />
moves due to Ursula’s clever playing, and he has<br />
exactly a 1/2 chance to do this. Then Ursula must move<br />
first in the clasp, and so King Lear will either lock or unlock<br />
the clasp with his final move. Since King Lear only<br />
wins if he locks the clasp at this time, his total chance <strong>of</strong><br />
winning is<br />
which in turn gives Ursula a chance to win <strong>of</strong><br />
Since this value matches our value above, we’ve shown<br />
that Ursula’s first move does not affect his chance to win,<br />
completing the pro<strong>of</strong>.<br />
Again, this is the only case where King Lear had the<br />
winning strategy and so is also the easiest to consider, but<br />
scientia.nd.edu SCIENTIA Vol 2 - Spring 2011<br />
Math<br />
it should give the reader a taste <strong>of</strong> how the other, more<br />
diffcult pro<strong>of</strong>s will work.<br />
Ursula has a Winning Strategy<br />
We will now look at the more complicated cases where<br />
Ursula has the winning strategy, starting with the other<br />
case for twist knots with an even number <strong>of</strong> crossings.<br />
The Number <strong>of</strong> Twists is Even and King Lear Goes<br />
First<br />
Assume the number <strong>of</strong> twists is even and that King<br />
Lear plays first. Normally, Ursula has the winning strategy<br />
in this case, but since we are now assuming she plays<br />
randomly, King Lear has a chance to win. Thus, we have<br />
the following result in this situation:<br />
Theorem 2. The probability for King Lear to win is:<br />
Moreover, it does not matter if King Lear makes his first<br />
move in the clasp or the twists.<br />
Pro<strong>of</strong>. If King Lear makes his first move in the clasp, Ursula<br />
could immediately win by unlocking the clasp; since<br />
she is playing randomly, Ursula has a<br />
chance to do this. Conversely, Ursula has an equal chance<br />
<strong>of</strong> locking the clasp. In this case, King Lear and Ursula<br />
will take turns making moves in the twists, with King<br />
Lear playing first. Since the clasp is locked, the only way<br />
the knot could be the unknot is if the twist can be completely<br />
undone by Type II Reidemeister Moves. As a result,<br />
if Ursula ever makes a move that does not cancel out<br />
King Lear’s last move with a Type II Reidemeister Move,<br />
King Lear can guarantee a win by also not cancelling out<br />
previous moves with a Type II Reidemeister Move. Thus,<br />
Ursula has a<br />
chance to win now, since she has a (1/2) probability <strong>of</strong><br />
making the “right” move on each <strong>of</strong> her n/2 turns. If Ursula<br />
instead makes the most likely move to resolve one<br />
<strong>of</strong> the twist precrossings, King Lear can lock the clasp<br />
himself, once again ensuring that Ursula can win only if<br />
they every turn make a move with sign opposite to that <strong>of</strong><br />
the last move in the twist. Thus, the total probability for<br />
victory for King Lear will be<br />
13
Math<br />
14<br />
Each precrossing in a shadow can be resolved to be<br />
either positive or negative. Of the possible Reidemeister<br />
Moves that can be made in a knot, the one most relevant<br />
to these probabilities is the Type II Reidemeister Move,<br />
through which two adjacent twists <strong>of</strong> opposite signs can<br />
be removed from a knot or a partially solved shadow. To<br />
simplify our notation, we will assume that the first move<br />
in any knot is positive. If, on the other hand, King Lear<br />
makes his first move in one <strong>of</strong> the twist precrossings in order<br />
to wait for Ursula to move in the clasp, his probability<br />
<strong>of</strong> winning can be calculated as follows:<br />
If Ursula moves in the clasp, King Lear can also move<br />
there to lock it. Ursula can then only win if they resolve<br />
each precrossing in the twist in such a way that it can be<br />
removed by a Type II Reidemeister Move, meaning that<br />
for n/2 turns she must make the opposite move to that <strong>of</strong><br />
King Lear.<br />
If Ursula makes the opposite move in the twist so that<br />
the resolved crossings can be removed by a Type II Reidemeister<br />
Move, the probability <strong>of</strong> victory for King Lear is<br />
reduced to the probability <strong>of</strong> victory in a twist knot with<br />
n − 2 precrossings in the twist.<br />
If Ursula makes a positive move in the twist, King<br />
Lear can resolve yet another precrossing to be positive,<br />
thus making it impossible for Ursula to unknot the twist.<br />
Then the only chance for Ursula to win is if they keep<br />
playing in the twist and thus force King Lear to move<br />
first in the clasp, as above. Even if Ursula does manage to<br />
force King Lear to make the first move in the clasp, she<br />
still only has a 1/2 chance to unknot the clasp. The chance<br />
<strong>of</strong> Ursula winning is thus<br />
since there are always two more possible crossings for<br />
her to act in than there are twist precrossings left. This<br />
simplifies to 1/(2(n 1)), so the overall probability for King<br />
Lear to win is<br />
Through a pro<strong>of</strong> by induction we can show that it does<br />
not matter whether King Lear makes his first move in the<br />
twist or the clasp. For this we want to show that if the<br />
probability <strong>of</strong> winning when starting in the clasp in a (n<br />
− 2)-twist knot is plugged into the equation for the probability<br />
<strong>of</strong> winning when starting in the twist in a n-twist<br />
knot, the probability <strong>of</strong> winning when starting in the clasp<br />
in the same n-twist knot is obtained. This means that what<br />
we want to show is<br />
For the base case, we have calculated the probabilities<br />
for the knotter to win in the twist knot where there are 2<br />
crossings in the twist, and found this to be 7/12. The knot<br />
with no crossings in the twist is just the unknot, and such<br />
a shadow guarantees that the unknotter wins, and if this is<br />
used as a value for P n-2 , the above equation is correct for<br />
the P 2 -case.<br />
Suppose by the induction hypothesis that<br />
(we are assuming our result for a twist knot with n − 2<br />
crossings in the twists in order to prove it for a twist knot<br />
with n crossings in the twists). Along with our work<br />
above, this gives us<br />
scientia.nd.edu SCIENTIA Vol 2 - Spring 2011
This means that the probability that King Lear wins is<br />
equal regardless <strong>of</strong> whether he first resolves a twist-precrossing<br />
or a clasp-precrossing for any number <strong>of</strong> crossings<br />
in the twist. This completes our pro<strong>of</strong>.<br />
The Number <strong>of</strong> Twists is Odd and King Lear goes First<br />
For the case where there is an odd number <strong>of</strong> twist<br />
precrossings, King Lear never has a winning strategy, as<br />
shown by Henrich et al. [2]. Let us first consider the case<br />
where King Lear moves first against a random Ursula.<br />
Theorem 3.. The probability for King Lear to win is<br />
The best strategy for King Lear is to move in the twist<br />
first.<br />
Pro<strong>of</strong>. Let us first consider King Lear’s chances <strong>of</strong> winning<br />
if he starts in the clasp. If Ursula then unlocks the<br />
clasp, King Lear will certainly lose. However, since King<br />
Lear will make the last move <strong>of</strong> the game (because there<br />
are an odd number <strong>of</strong> total twists), he can always ensure<br />
that the shadow will knot if Ursula makes any other first<br />
move. Regardless <strong>of</strong> whether Ursula knots the clasp on<br />
her first turn or if King Lear does so himself on his second<br />
turn, King Lear will have the choice in his last turn<br />
to either make a trefoil knot if Ursula managed to make<br />
all earlier twists removable through Type II Reidemeister<br />
Moves, or to make sure that there are at least three crossings<br />
with the same sign in the twist in the final knot. Thus,<br />
King Lear’s chance <strong>of</strong> winning is<br />
his first move is in the clasp.<br />
However, King Lear can do even better if he instead<br />
moves first in the twist. If Ursula should move in the clasp<br />
at any point before all twist precrossings are resolved,<br />
King Lear can win by knotting the clasp and then, through<br />
the same strategy as before, ensure that the final knot is<br />
either the trefoil or has at least three crossings <strong>of</strong> the same<br />
sign in the twist. Ursula can only win if she keeps making<br />
the opposite move in the clasp each turn for (n − 1)/2 turns<br />
and then in the clasp resolves one crossing to have the<br />
opposite sign to the only remaining crossing in the twist.<br />
As we saw before, the probability that Ursula does not<br />
play in the clasp until the last turn is<br />
so the total probability that King Lear wins is<br />
scientia.nd.edu SCIENTIA Vol 2 - Spring 2011<br />
Math<br />
Since this probability is higher than the one calculated<br />
for when King Lear starts by moving in the clasp,<br />
the King Lear should make his first move in the twist to<br />
maximize his chance <strong>of</strong> winning.<br />
The Number <strong>of</strong> Twists is Odd and King Lear goes<br />
Second<br />
Now let us consider the case where King Lear goes<br />
second in a knot with an odd number <strong>of</strong> crossings in the<br />
twist, while playing against a random Ursula:<br />
Theorem 4. The probability for King Lear to win is<br />
The best strategy for King Lear is to move in the clasp<br />
first regardless <strong>of</strong> Ursula’s first move.<br />
Pro<strong>of</strong>. If Ursula’s first move is in the clasp, King Lear<br />
should move in the clasp to lock it. If after that Ursula<br />
makes even one positive move in a twist precrossing,<br />
King Lear has already won, since even if Ursula makes<br />
a negative move every turn from then on, strategic playing<br />
by King Lear will result in a knot with three positive<br />
crossings, which is the trefoil knot. Only if Ursula makes<br />
a negative move every turn after her first does she have a<br />
chance to win, and the probability <strong>of</strong> this is only 1/2 each<br />
turn for (n + 1)/2 turns.<br />
If, on the other hand, Ursula starts by making one <strong>of</strong><br />
the twist precrossings positive, King Lear<br />
can move either in the clasp or in the twist. Let us treat<br />
these two cases separately, and call the<br />
probability that King Lear wins in this case P ′ n .<br />
1. If King Lear moves in the clasp, his optimal strategy<br />
is to resolve one <strong>of</strong> the clasp precrossings to be positive.<br />
Then Ursula has a 1/2n possibility <strong>of</strong> winning immediately<br />
by making unlock- ing the clasp. However, Ursula is<br />
guaranteed to lose if she locks the clasp. By resolving yet<br />
another precrossing in the twist to be positive, King Lear<br />
can guarantee that the final knot will necessarily have at<br />
least three positive crossings - regardless <strong>of</strong> how many<br />
precrossings Ursula resolves to be negative - and thus<br />
make it so that the final knot cannot be the unknot.<br />
The result is very similar if Ursula moves in the twist by<br />
resolving a precrossing to be positive.<br />
Conversely, if Ursula makes a negative move in the<br />
15
Math<br />
16<br />
twist, she can still win if she continues resolving precrossings<br />
so that the previous move <strong>of</strong> King Lear can be<br />
cancelled out through a Type II Reidemeister Move. She<br />
would have to do this for (n − 1)/2 turns, so the probability<br />
that King Lear wins is<br />
2. Had King Lear instead chosen to move in the twist,<br />
once again moving optimally so that the two crossings<br />
have the same sign, he is once again guaranteed victory if<br />
Ursula resolves a clasp precrossing to be positive, as he<br />
can then simply lock the clasp. If Ursula resolves the clasp<br />
so that one <strong>of</strong> the crossings is negative, King Lear should<br />
lock it by making the other clasp crossing negative too,<br />
although he might still lose if Ursula then makes negative<br />
corssings in the twist for their remaining (n − 1)/2 turns.<br />
If Ursula instead makes a positive move in the twist, King<br />
Lear will lose only if Ursula keeps playing in the twist<br />
and thus force him to move first in the clasp - she must<br />
then counter his move. The probability <strong>of</strong> this occuring is<br />
This probability is the same if Ursula makes a negative<br />
move in the twist, since King Lear can chose which way<br />
to resolve the clasp if he is forced to play first in the clasp.<br />
Thus, the probability that King Lear wins in this case is<br />
Conclusion<br />
Once we considered all the relevant cases for twist<br />
knot shadows, we moved on to general m,n-twist knots<br />
i.e. knots with m crossings in the clasp. However, this<br />
class <strong>of</strong> knot shadows is significantly more complicated<br />
and so we’ve omitted that work here. Nevertheless, the<br />
reader should now have a sense <strong>of</strong> how to work with<br />
mathematical knots now. For those interested in learning<br />
more on knots in general, we suggest Colin Adams’ book<br />
[1], and for those who want to better understand the knot<br />
game we’ve discussed, please see the work by Allison<br />
Henrich and her last REU team [2].<br />
References<br />
[1] C. Adams, The Knot Book: An Elementary Introduction to<br />
the Mathematical Theory <strong>of</strong> Knots, 2nd ed., American Math-<br />
ematical Society, Providence RI, 2004.<br />
[2] A. Henrich, N. MacNaughton, S. Narayan, O. Pechenik, and<br />
J. Townsend, A Mid-summer Knot’s Dream (to appear, <strong>College</strong><br />
Mathematics Journal ); available at<br />
http://arxiv.org/abs/1003.4494.<br />
[3] Makoto, Yamashita. Type I Reidemeister Move. Digital image.<br />
Wikipedia: The Free Encyclopedia. 16 Sept. 2006. Web.<br />
Oct. 2010. http://en.wikipedia.org/wiki/File:Reidemeister<br />
move 1.png.<br />
[4] Makoto, Yamashita. Type II Reidemeister Move. Digital<br />
image. Wikipedia: The Free Encyclopedia. 16 Sept. 2006.<br />
Web. Oct. 2010. http://en.wikipedia.org/wiki/File:Reidemeister<br />
move 2.png.<br />
[5] Makoto, Yamashita. Type III Reidemeister Move. Digital<br />
image. Wikipedia: The Free Encyclopedia. 16 Sept. 2006.<br />
Web. Oct. 2010. http://en.wikipedia.org/wiki/File:Reidemeister<br />
move 3.png.<br />
[6] Weisstein, Eric W. Twist Knot. Digital image. Wolfram<br />
Mathworld. Web. http://mathworld.wolfram.com/TwistKnot.<br />
html.<br />
About the Author<br />
Jake Pardo is a senior Physics and Honors Mathematics<br />
double major from Rochester, New York. He has spent two<br />
summers doing math at <strong>Notre</strong> <strong>Dame</strong> and a third at the <strong>University</strong><br />
<strong>of</strong> Washington, during which he helped with the research<br />
that led to his team’s paper “Random Knot Games.” After<br />
graduating, he intends to pursue a Ph.D in Mathematics.<br />
scientia.nd.edu SCIENTIA Vol 2 - Spring 2011
Differences Between<br />
Native and Non-Native<br />
Leaf Decomposition in<br />
Juday Creek<br />
Katherine Baglini, Adam Lamm, and Kevin Towle<br />
Advisors: Patrick Shirey and Dominic Chaloner<br />
Universtiy <strong>of</strong> <strong>Notre</strong> <strong>Dame</strong>, Department <strong>of</strong> Biological<br />
<strong>Science</strong>s<br />
Abstract<br />
Differences in the rates <strong>of</strong> decomposition in native<br />
and non-native species are becoming increasingly important<br />
as invasive species create larger impacts on natural<br />
communities. These differences can disrupt natural<br />
nutrient cycles. Decomposition was compared among<br />
species found on the campus <strong>of</strong> the <strong>University</strong> <strong>of</strong> <strong>Notre</strong><br />
<strong>Dame</strong>: white pine (Pinus strobus), sugar maple (Acer<br />
saccharum), Austrian pine (Pinus nigra), and Norway<br />
maple (Acer platanoides). Rates <strong>of</strong> decomposition were<br />
measured over a three week period after being placed in<br />
Juday Creek, a third order stream running through the<br />
campus <strong>of</strong> the <strong>University</strong> <strong>of</strong> <strong>Notre</strong> <strong>Dame</strong>. Decomposition<br />
occurred faster in the native than the non-native tree species,<br />
and deciduous trees decomposed faster than coniferous<br />
trees. Invertebrate abundances were measured after<br />
three weeks <strong>of</strong> decomposition in the stream, but among<br />
species were not statistically significant.<br />
Introduction<br />
Leaf decomposition plays a key role in nutrient cycles<br />
and energy transfer in natural habitats. In addition, invasive<br />
and non-native species can seriously damage the<br />
health <strong>of</strong> a habitat, especially if the invasive species has a<br />
life cycle which has a different timing at key events than<br />
native species. Such differences can render leaf litter inaccessible<br />
to decomposers, keeping key nutrients from<br />
re-entering the habitat, and lowering the terrestrial carrying<br />
capacity. Decomposition rates are dependent on leaf<br />
lignin content, with higher lignin concentrations yielding<br />
slower rates <strong>of</strong> decomposition [1]. The same concept also<br />
applies to tannin content, which blocks bacterial colonization<br />
[2].<br />
Previous studies comparing decomposition rates between<br />
native and non-native plants have yielded conflicting<br />
results. A previous study found that a non-native<br />
Japanese knotwood tree decomposed at a similar rate to<br />
native ash and cottonwood trees [3]. On the contrary,<br />
a study looking at decomposition <strong>of</strong> an invasive shrub<br />
scientia.nd.edu SCIENTIA Vol 2 - Spring 2011<br />
<strong>Biology</strong><br />
(Lonicera maackii) and two native species (A. Saccharum<br />
and Quercus rubra) found that leaf decomposition was 21<br />
times faster with an invasive shrub than a native species<br />
[4]. Few studies have compared native to non-native trees<br />
<strong>of</strong> the same family. One that did compare decomposition<br />
in pairs <strong>of</strong> native and non-native species found a faster<br />
decomposition rate in native than non-native species [5].<br />
This study aims to further the study <strong>of</strong> decomposition<br />
among native and non-native species. White pine<br />
(Pinus strobus), sugar maple (Acer saccharum), Austrian<br />
pine (Pinus nigra), and Norway maple (Acer platanoides)<br />
were used in the study, all <strong>of</strong> which were found on the<br />
campus <strong>of</strong> the <strong>University</strong> <strong>of</strong> <strong>Notre</strong> <strong>Dame</strong>. These species<br />
have been chosen for similar leaf structure in order to<br />
minimize extraneous variables (B. Hellenthal, personal<br />
communication). We hypothesized that the native species<br />
(white pine and sugar maple) will decompose faster<br />
than the non-native species (Austrian pine and Norway<br />
maple), because the invertebrate populations responsible<br />
for leaf decomposition have evolved to the native species,<br />
and will be better adapted for the timing <strong>of</strong> its life cycle.<br />
Invertebrate abundance was used to observe any invertebrate<br />
preference between native and non-native species.<br />
Source: Patrick Shirey<br />
Figure 1. Study site within the Warren Golf Course, <strong>Notre</strong><br />
<strong>Dame</strong>, Indiana. Juday Creek is a modified stream which flows<br />
from Granger, Indiana, into the St. Joseph River.<br />
17
<strong>Biology</strong><br />
18<br />
Methods<br />
Description <strong>of</strong> Study Site<br />
Juday Creek is a third order stream that flows from<br />
Granger, Indiana into the St. Joseph River. The stream underwent<br />
restoration when the Warren Golf Course, which<br />
opened in 2000, was built on the campus <strong>of</strong> the <strong>University</strong><br />
<strong>of</strong> <strong>Notre</strong> <strong>Dame</strong> (R. Hellenthal, personal communication).<br />
The portion <strong>of</strong> the creek that meanders through the golf<br />
course was re-routed by a stream restoration contractor, in<br />
order to minimize the environmental impact that the golf<br />
course’s construction had on the trout population present<br />
in the stream (Figure 1).<br />
Leaf Bag Preparation and Processing<br />
Nine 21cm by 39cm polypropylene leaf bags 3mm x<br />
3mm mesh size were filled with 15.0 (+/- 0.1g) <strong>of</strong> dry<br />
leaf litter from each species: white pine, Austrian pine,<br />
Norway maple, and sugar maple. One bag from each species<br />
was attached to a piece <strong>of</strong> metal rebar secured in the<br />
streambed, with two sets <strong>of</strong> bags at each site. Bags were<br />
placed at three replicate sites, using a flow meter with<br />
depth gauge to ensure all three sampling sites had similar<br />
depth and water flow. Leaf bags were placed along<br />
the edge <strong>of</strong> the stream so that the slower river current<br />
would remove less leaf litter than faster currents, while<br />
maintaining ample current for abrasion. After one week<br />
in the stream, one piece <strong>of</strong> rebar and the attached bags<br />
was removed. After three weeks, the final replicate <strong>of</strong><br />
leaf bags was removed. Three replicates <strong>of</strong> each species<br />
were removed and weighed to account for leaf loss during<br />
handling and processing.<br />
After the predetermined time in the stream, the leaf<br />
content was removed and washed to remove accumulated<br />
silt, and dried in an oven at 60 o C for a minimum <strong>of</strong> 24<br />
hours. After drying, leaves were again weighed. A two<br />
way ANOVA was used to compare leaf decomposition<br />
rates between native and non-native tree species, as well<br />
as between coniferous and deciduous tree species.<br />
Aquatic Invertebrate Abundance<br />
After 3 weeks in the creek, prior to drying at 60oC,<br />
the leaves in the samples were washed individually over<br />
a 250µm screen with distilled water to collect aquatic invertebrates.<br />
Aquatic invertebrates were washed from the<br />
screen and preserved in a vial filled with ethanol. After<br />
preservation, invertebrate abundance was determined for<br />
each replicate. A two way ANOVA compared invertebrate<br />
abundance between both native and non-native species,<br />
as well as between coniferous and deciduous tree species.<br />
Results<br />
The rates <strong>of</strong> decomposition in deciduous species<br />
were significantly higher than in coniferous species<br />
(F1,11(6.24), P=0.0371, Table 1, Figure 2). The rates <strong>of</strong><br />
decomposition in native species was significantly higher<br />
than in non-native species (F1,11(32.02), P=0.0005, Table<br />
1, Figure 2). White pine decomposed at a rate <strong>of</strong> 0.0297<br />
days-1 (Figure 3), Austrian pine decomposed at a rate <strong>of</strong><br />
0.0173 days-1 (Figure 3), sugar maple decomposed at a<br />
rate <strong>of</strong> 0.0412 days-1 (Figure 3), and Norway maple decomposed<br />
at a rate <strong>of</strong> 0.022 days-1 (Figure 3).<br />
scientia.nd.edu SCIENTIA Vol 2 - Spring 2011<br />
Figure 2. Percent leaf<br />
mass remaining. Leaf<br />
mass remaining measured<br />
after 1 week and 3<br />
weeks in the stream.
A B<br />
C D<br />
scientia.nd.edu SCIENTIA Vol 2 - Spring 2011<br />
<strong>Biology</strong><br />
Figure 3. Ln (% leaf mass remaining) for all four species tested. A=white pine, B=sugar maple, C=Austrian pine, D=Norway<br />
maple. Coefficients <strong>of</strong> decomposition are listed, in addition to the corresponding R 2 value.<br />
Leaf Decomp<br />
Source <strong>of</strong> Variation Sum-<strong>of</strong>-Squares df Mean-Square F-ratio P-value<br />
Type 5.45 1 5.45 6.24 0.0371<br />
Location 27.98 1 27.98 32.02 0.0005<br />
Type x Location 2.56 1 2.56 2.93 0.1253<br />
Error 6.99 8 0.87<br />
Total 42.92 11<br />
Inverts<br />
Source <strong>of</strong> Variation Sum-<strong>of</strong>-Squares df Mean-Square F-ratio P-value<br />
Type 2730.08 1 2730.08 3.1 0.1163<br />
Location 1386.75 1 1386.75 1.57 0.2456<br />
Type x Location 90.76 1 90.76 0.1 0.7599<br />
Error 7049.33 8 881.17<br />
Total 11256.92 11<br />
Table 1. Two-way ANOVA tests for both leaf decomposition (calculated using leaf mass remaining after 3 weeks in Juday Creek)<br />
and invertebrate abundance. Both deciduous versus coniferous and native versus non-native differences in decomposition were<br />
statistically significant. The interaction <strong>of</strong> the two was not statistically significant. No comparison was statistically significant for<br />
invertebrate abundance.<br />
19
<strong>Biology</strong><br />
20<br />
Figure 4. Average invertebrate abundance for the four species<br />
sampled after 3 weeks in Juday Creek. Standard error bars are<br />
shown.<br />
The relationship between species type and origin for<br />
rate <strong>of</strong> decomposition was not significant (F1,11(2.93),<br />
P=0.1253, Table 1). The invertebrate abundance showed<br />
no significant difference between species type (F1,11(3.1),<br />
P=0.1163, Table 1). The invertebrate abundance showed<br />
no significant difference between differing origins<br />
(F1,11(1.57), P=0.2456, Table 1). The relationship between<br />
species type and origin for invertebrate abundance<br />
showed no significant difference (F1,11(0.1), P=0.7599,<br />
Table 2). Invertebrate abundance showed the general<br />
trend that non-native species had greater abundance than<br />
native species (Figure 4).<br />
Discussion<br />
Previous studies comparing decomposition rates between<br />
native and non-native tree species have yielded<br />
conflicting and confusing results. Braatne et al. (2010)<br />
found similar rates <strong>of</strong> decomposition between a Japanese<br />
knotwood tree and a native cottonwood tree, while Blair<br />
et al. (2009) found that decomposition occurred 21 times<br />
faster in a non-native shrub species than it did in a native<br />
shrub. Godoy et al. (2010) compared native and non-native<br />
pairs and found that decomposition occurred faster in<br />
the native species than in its non-native pair. With such<br />
conflicting and confusing results, it is hard to draw any<br />
concrete conclusions, especially with so many sources <strong>of</strong><br />
variation unaccounted for in previous studies.<br />
This experiment sought to eliminate extraneous variables,<br />
by testing two pairs <strong>of</strong> species, one coniferous and<br />
one deciduous, which were chosen because <strong>of</strong> similar<br />
leaf morphology. By controlling for leaf morphology, we<br />
could eliminate a source <strong>of</strong> variation in the study (B. Hellenthal,<br />
personal communication). In previous studies, if<br />
invertebrates more easily decompose one leaf structure<br />
than another, it would decompose faster than the other<br />
species studied, regardless <strong>of</strong> whether it was native or<br />
non-native. Godoy et al. (2010) had the one study that<br />
looked at decomposition in pairs <strong>of</strong> similar species, and<br />
our research supports their conclusion; native species<br />
decomposed faster than non-native species. Similarly,<br />
to ensure that our leaves decomposed at rates that we<br />
expected, we measured decomposition between deciduous<br />
and coniferous trees, and found that the deciduous<br />
trees did decompose faster than coniferous as expected<br />
(B. Hellenthal, personal communication). This is likely<br />
due to an interaction <strong>of</strong> factors such as higher tannin and<br />
lignin contents, and these differences have been noted<br />
throughout the primary literature 1,2 .<br />
This study also expands on exploring possible sources<br />
for variation in decomposition rate between native and<br />
non-native species, something that has been largely absent<br />
from the literature. Many studies simply measured<br />
decomposition rates without measuring invertebrate<br />
abundance to help determine what makes a species decompose<br />
faster. This study found that differences in invertebrate<br />
abundance were not statistically significant, the<br />
same result that Braatne et al. (2007) found. There were<br />
problems with collecting invertebrates, which stem from<br />
leaf morphology, because deciduous trees have a greater<br />
leaf surface area for invertebrates to graze upon than coniferous<br />
trees. The streamlined nature <strong>of</strong> pine needles<br />
likely made it difficult for invertebrate decomposers to<br />
remain in the sample without being forced downstream<br />
by the current. This may explain why maple species had<br />
more invertebrates on its leaves than pine species, albeit<br />
not statistically significant.<br />
A future modification to this experiment would include<br />
the use <strong>of</strong> tighter mesh bags to reduce the potential<br />
<strong>of</strong> extraneous loss <strong>of</strong> white pine needles due to water<br />
current. Decomposition bags would be designed with<br />
smaller holes to retain the needles, but large enough to<br />
allow for the colonization <strong>of</strong> the litter by invertebrates.<br />
Time constraints forced this experiment to take place in<br />
an aquatic environment to take advantage <strong>of</strong> higher rates<br />
<strong>of</strong> decomposition than those <strong>of</strong> terrestrial habitats, but<br />
future studies should examine the difference in invertebrate<br />
abundance between native and non-native trees in<br />
terrestrial habitats. Invertebrates should also be classified<br />
(not done in this experiment due to time constraints), because<br />
there may be a difference in key decomposers that<br />
makes a difference in decomposition rate, and not sheer<br />
invertebrate abundance. One possible source <strong>of</strong> variation<br />
in decomposition rate would be differing proportions <strong>of</strong><br />
grazers, collectors, shredders, and predators (R. Hellenthal,<br />
personal communication). Similarly, it is difficult<br />
to apply the findings <strong>of</strong> two pairs <strong>of</strong> leaf species to all<br />
species: native and non-native, deciduous and coniferous.<br />
Therefore this experiment should be expanded upon, just<br />
like the work <strong>of</strong> Godoy et al. (2010), and find more relat-<br />
scientia.nd.edu SCIENTIA Vol 2 - Spring 2011
ed native and non-native species to test, perhaps even expanding<br />
into taxa such as shrubs, grasses, and agricultural<br />
vegetation. Results from this increased research protocol<br />
could inform management efforts on the implications <strong>of</strong><br />
non-native plant invasion on ecosystem health<br />
Acknowledgements<br />
This work is in large part due to the efforts <strong>of</strong> Mrs. B.<br />
Hellenthal, <strong>University</strong> <strong>of</strong> <strong>Notre</strong> <strong>Dame</strong>, for her assistance<br />
in tree identification and extensive knowledge <strong>of</strong> the flora<br />
on the campus. Dr. R. Hellenthal provided information<br />
about the study site, Juday Creek. The experimenters<br />
wish to express their thanks to Patrick Shirey, for all <strong>of</strong><br />
his assistance with experimental design and publication<br />
structure. Nathan Evans assisted in furnishing equipment<br />
necessary for this experiment, including leaf bags, rebar,<br />
and other equipment. Additionally, without the guidance<br />
and oversight <strong>of</strong> Dr. D. Chaloner, the experiment could<br />
not have been conducted.<br />
This experiment was conducted as part <strong>of</strong> the laboratory<br />
curriculum for the General Ecology Laboratory<br />
course, BIOS 31312, within the Department for Biological<br />
<strong>Science</strong>s, <strong>University</strong> <strong>of</strong> <strong>Notre</strong> <strong>Dame</strong>, <strong>Notre</strong> <strong>Dame</strong>, Indiana.<br />
References<br />
[1] Schindler, M. H. and M. O. Gessner. “Functional leaf traits<br />
and biodiversity effects on litter decomposition in a stream.” Ecology<br />
90 (2009):1641-1649.<br />
[2] Traw, M. B. and N. Gift. “Environmental microbiology: tannins<br />
& microbial decomposition <strong>of</strong> leaves on the forest floor.” Am.<br />
Bio. Teacher. 72 (2010): 506- 512.<br />
[3] Braatne, J. H., S. Mazeika, P. Sullivan, and E. Chamberlain.<br />
“Leaf decomposition and stream macroivertebrate colonization <strong>of</strong><br />
Japanese knotwood, and invasive plant species.” Intl Rev. <strong>of</strong> Hydrobiology<br />
92 (2007):656-665.<br />
[4] Blair, B. C. and A. Stowasser. “Impact <strong>of</strong> Lonicera maackii<br />
on decomposition rates <strong>of</strong> native leaf litter in a southwestern Ohio<br />
woodland.” Ohio J. <strong>of</strong> <strong>Science</strong> 109 (2009):43-47.<br />
[5] Godoy, O., P. Castro-Diez, R. S. P. Van Logtestijn, J. H. C. Cornelissen,<br />
and F.Valladares. “Leaf litter traits <strong>of</strong> invasive species<br />
slow down decomposition compared to Spanish natives: a broad<br />
phylogenetic comparison.” Oecologia162 (2010):781-790.<br />
About the Authors<br />
scientia.nd.edu SCIENTIA Vol 2 - Spring 2011<br />
<strong>Biology</strong><br />
Katherine Baglini was born in Phoenix, Arizona and<br />
grew up in both Phoenix and Denver, Colorado. She is a<br />
sophomore Environmental <strong>Science</strong> major, minoring in <strong>Science</strong>,<br />
Technology, and Values. She is interested in continuing<br />
her education with a masters in an ecological or environmental<br />
field and then going on to law school to focus in environmental<br />
law. She is proud to be a Howard Hall duck and<br />
enjoys singing in the hall choir and spending as much time as<br />
she can outside when back home in the Arizona sun!<br />
Adam Lamm, from South Bend, Indiana, is a senior<br />
Biological <strong>Science</strong>s major at the <strong>University</strong> <strong>of</strong> <strong>Notre</strong> <strong>Dame</strong>.<br />
Next fall, he will be matriculating to medical school to hopefully<br />
study pain management or sports medicine. In his free<br />
time, Adam works as a freelanced photographer on campus.<br />
This is his first publication.<br />
Kevin Towle is a junior Biological <strong>Science</strong>s major and<br />
Anthropology minor. During the academic year he works in<br />
Dr. Jessica Hellmann’s lab on projects including ecological<br />
niche modeling for an endangered butterfly species and potential<br />
climatic signals that affect mosquito abundance and<br />
population dynamics within the Great Lakes Region. Kevin<br />
also researches in Dr. David Lodge’s lab comparing resource<br />
preferences between rusty crayfish from their native and<br />
invasive ranges. This past summer, Kevin was able to attend<br />
the <strong>University</strong> <strong>of</strong> <strong>Notre</strong> <strong>Dame</strong> Environmental Research<br />
Center where he examined the effect <strong>of</strong> a trematode parasite<br />
infection on the competition behavior <strong>of</strong> crayfish. After<br />
graduation, Kevin would like to attend graduate school with<br />
a concentration in community ecology and conservation biology.<br />
21
<strong>Biology</strong><br />
22<br />
Inconsistency <strong>of</strong><br />
Conferred Immunity in<br />
Plasmodium falciparum<br />
Malaria Hotspots and<br />
Implications for Immunization<br />
Development<br />
Annette Marie Ruth<br />
Advisor: Paul Grimstad<br />
<strong>University</strong> <strong>of</strong> <strong>Notre</strong> <strong>Dame</strong>, Department <strong>of</strong> Biological <strong>Science</strong>s<br />
Abstract<br />
Newborn infants in malaria-endemic regions are<br />
markedly resistant to Plasmodium falciparum malaria.<br />
Such protection is related principally to the transplacental<br />
transfer <strong>of</strong> maternal variant surface antigen (VSA)specific<br />
immunoglobulin G antibodies, which confer immune<br />
resistance for approximately the first six months <strong>of</strong><br />
life. During this period, infections tend to be low-density<br />
and relatively asymptomatic, as in adults who have naturally<br />
acquired immunity (NAI). After this passive immunity<br />
diminishes, children have increased susceptibility to<br />
severe infection for one to two years before they acquire<br />
active immunity, the maintenance <strong>of</strong> which requires repeated<br />
parasite exposure. Genetic variability <strong>of</strong> the human<br />
parasite, parasite-induced immunosuppression, and<br />
transmission heterogeneity largely account for this discontinuity.<br />
These factors also have been shown to inhibit<br />
NAI in areas <strong>of</strong> high endemicity, or hotspots, widening<br />
the susceptibility period and increasing the risk <strong>of</strong> acute<br />
infection among children. The resulting inconsistency <strong>of</strong><br />
timing and duration <strong>of</strong> childhood susceptibility poses an<br />
epidemiological challenge in determining immunization<br />
strategies suitable for large populations, prompting the<br />
necessity to consider region-specific factors in vaccine<br />
development. The complexity <strong>of</strong> the Plasmodia parasites<br />
and their life cycles dictate the need for novel approaches<br />
to vaccine design, the most promising <strong>of</strong> which are recombinant<br />
DNA strategies that target the most stable components<br />
<strong>of</strong> parasitic genomes.<br />
Introduction<br />
Although children under five years <strong>of</strong> age typically<br />
face a high risk <strong>of</strong> malaria-related morbidity and mortality<br />
in malaria-endemic regions, infants enjoy relative im-<br />
munity from infection [1]. The greatest protection from<br />
Plasmodium falciparum Plasmodium malaria infection<br />
occurs during the first few months <strong>of</strong> life, and infants <strong>of</strong>ten<br />
are fully protected until the age <strong>of</strong> 12 months [2],[3],[4].<br />
However, not until the age <strong>of</strong> five years do most children<br />
develop sufficient active immunity to reduce the risk <strong>of</strong><br />
death from P. falciparum malaria over the long term. This<br />
active immunity provides protection against severe disease<br />
and reduces the frequency <strong>of</strong> clinical malaria episodes.<br />
Low levels <strong>of</strong> susceptibility in infancy result from<br />
the passive transfer <strong>of</strong> maternal anti-Plasmodium antibodies<br />
that are specific for clonally variant surface antigens<br />
(VSAs) encoded by the parasite [4]. Recognition <strong>of</strong><br />
these viral antigens is essential to antimalarial immunity<br />
in general.<br />
The P. falciparum-specific immunoglobulin G (IgG)<br />
antibodies that recognize these antigenic variants, including<br />
IgG1 to IgG4 subclasses, have been found in the serum<br />
<strong>of</strong> immune populations in malaria-endemic regions,<br />
including pregnant women [5],[6]. Pregnant women are<br />
especially attractive to female Anopheles mosquitoes [7],<br />
and malaria in pregnant women is an important cause <strong>of</strong><br />
stillbirths, infant mortality and low birth weight [8] This<br />
is particularly true <strong>of</strong> P. falciparum infections and also<br />
applies to infections caused by other species such as P.<br />
vivax [9]. IgG antibodies are the only immunoglobulins<br />
that cross the placental barrier and thus factor into fetal<br />
immunity [10]. Concentrations <strong>of</strong> fetal IgG may vary, depending<br />
upon the level <strong>of</strong> maternal IgG [11]. Thus, it is<br />
suggested not only that the immune resistance <strong>of</strong> pregnant<br />
women with naturally acquired immunity (NAI) to P. falciparum<br />
malaria in hyperendemic regions is transferred<br />
to their infants, but also that women with higher P. falciparum-specific<br />
IgG antibody levels confer greater protective<br />
immunity to their <strong>of</strong>fspring than do women residing<br />
in areas <strong>of</strong> intermediate to mild endemicity who may have<br />
lower maternal antibody levels.<br />
Variations in rates <strong>of</strong> transmission and in children’s<br />
ages at acquisition <strong>of</strong> active immunity among areas where<br />
malaria is hyperendemic pose a considerable challenge to<br />
treatment and control strategies. The unpredictable temporal<br />
gap between the waning <strong>of</strong> passive immunity and<br />
the acquisition <strong>of</strong> active immunity leaves children under<br />
the age <strong>of</strong> 5 in unknown states <strong>of</strong> vulnerability to acute<br />
infection and resulting death. The P. falciparum’s rapid<br />
mutation rate, which continually modifies the structure<br />
<strong>of</strong> its VSAs, further complicates the situation and renders<br />
many drug therapies ineffective. A better understanding<br />
<strong>of</strong> malarial pathogenesis and the relationships among endemicity,<br />
local VSA variability, and infant immunity can<br />
be used to develop more effective immunization strategies.<br />
scientia.nd.edu SCIENTIA Vol 2 - Spring 2011
Pathogenesis Overview<br />
Malaria in humans develops in two phases, known<br />
as the exoerythrocytic phase (hepatocyte infection) and<br />
the erythrocytic phase (red blood cell, or RBC infection).<br />
Sporozoites from a mosquito’s salivary glands enter the<br />
bloodstream and migrate to the liver, where they infect<br />
hepatocytes within a few minutes <strong>of</strong> injection. Inside the<br />
hepatocytes, all Plasmodium species multiply asexually<br />
and asymptomatically for a period <strong>of</strong> 8–30 days [12]. This<br />
period <strong>of</strong> differentiation yields thousands <strong>of</strong> merozoites<br />
that, upon the rupture <strong>of</strong> their host cells, disperse throughout<br />
the bloodstream and infect erythrocytes, thus beginning<br />
the symptomatic erythrocytic stage. Several asexual<br />
multiplication cycles occur within the RBCs over a period<br />
<strong>of</strong> two or three days, after which they rupture, releasing<br />
increasing numbers <strong>of</strong> merozoites into the bloodstream<br />
[12]. Thus begin the waves <strong>of</strong> fever characteristic <strong>of</strong> the<br />
symptomatic stage <strong>of</strong> infection.<br />
The parasite is relatively protected from the immune<br />
system because it spends much <strong>of</strong> its life cycle residing<br />
within hepatocytes and erythrocytes, effectively evading<br />
immune surveillance [13]. Plasmodium falciparum induces<br />
the production <strong>of</strong> binding proteins on RBC membrane<br />
surfaces, thus encouraging the infected erythrocytes<br />
to stick to the walls <strong>of</strong> small blood vessels. This strategy<br />
sequesters the parasite from passage through the spleen<br />
[14] and can cause hemorrhagic complications when the<br />
infected erythrocytes occlude venules. In cerebral malaria<br />
the sequestered RBCs can breach the blood-brain barrier,<br />
potentially invoking a comatose state [15].<br />
Although the RBCs’ surface binding proteins are<br />
exposed to the immune system, they do not serve as effective<br />
immune targets due to their extreme diversity. At<br />
least 60 variations occur within a single parasitic specimen,<br />
and effectively limitless variations are found within<br />
parasite populations. With each generation, at least 2% <strong>of</strong><br />
the parasites produce novel RBC surface proteins[14] –<br />
the VSAs mentioned previously – thus staying one step<br />
ahead <strong>of</strong> the pursuing immune system.<br />
In response to an unknown triggering mechanism<br />
[12], some <strong>of</strong> the merozoites differentiate into male and<br />
female gametocytes soon after infecting RBCs, thus making<br />
the human the definitive host <strong>of</strong> the disease. When a<br />
mosquito ingests parasitic gametocytes, they pair up and<br />
burrow into the insect’s stomach lining [12], where fertilization<br />
and sexual recombination occur, forming ookinetes<br />
that mature into oocysts in which new sporozoites<br />
develop. Eventually the oocysts rupture and release the<br />
new sporozoites, which travel to the mosquito’s salivary<br />
gland and are ready for injection into a new host, thus<br />
completing the cycle.<br />
Early Immunity and Passively Acquired IgG<br />
During infancy, malarial infections produce only mild<br />
scientia.nd.edu SCIENTIA Vol 2 - Spring 2011<br />
<strong>Biology</strong><br />
symptoms with few parasitemias [2],[6],[17]. The first<br />
few months <strong>of</strong> protection have been attributed to the passive<br />
transfer <strong>of</strong> IgG, as evidenced by the similar levels <strong>of</strong><br />
maternal and infant IgG at birth [18] and by the rough correspondence<br />
between the initial period <strong>of</strong> protection and<br />
the estimated dissipation time for maternal IgG [19],[20].<br />
Paradoxically, recent studies have failed to provide direct<br />
evidence <strong>of</strong> this correlation despite having been designed<br />
with that goal in mind [21]. This dearth <strong>of</strong> evidence may<br />
result from excessive specificity in the investigation <strong>of</strong><br />
IgG patterns thus far.<br />
The highly variable nature <strong>of</strong> VSAs distinguishes<br />
them from other parasitic antigens that immunologists<br />
have targeted. Infected erythrocytes obtained from malaria<br />
patients consistently express VSAs for which the<br />
specific IgG levels have not yet developed but rapidly<br />
rise shortly thereafter [22],[23]. The variation <strong>of</strong> VSA expression<br />
with host age and disease severity implies that<br />
acquired immunity suppresses the parasite’s expression<br />
<strong>of</strong> VSAs characteristic <strong>of</strong> severe malaria and drives them<br />
toward forms associated with uncomplicated malaria<br />
and asymptomatic parasitemia [23],[24]. These findings<br />
strongly suggest that VSAs represent major targets<br />
<strong>of</strong> protective immunity. They also suggest that successful<br />
immune responses target the VSAs that most effectively<br />
enable the infected erythrocytes to evade filtration – the<br />
“stickiest” VSAs.<br />
In 2003, Cot et al. [25] published the only longitudinal<br />
study to date that has investigated the relationship<br />
between VSA-specific IgG and clinical protection from<br />
malaria during the first two years <strong>of</strong> life. The levels <strong>of</strong> any<br />
VSA-specific IgG correlate with transmission intensity;<br />
however, the placental form <strong>of</strong> the parasite cannot survive<br />
in the absence <strong>of</strong> a placenta, so placental VSA-specific<br />
IgG is not expected to benefit the newborn infant. In consideration<br />
<strong>of</strong> passively transferred, non-placental VSAspecific<br />
antibodies’ presence in infants, one would expect<br />
to find a positive correlation <strong>of</strong> such IgG levels with time<br />
to first infection and a negative correlation with parasite<br />
load. Indeed, such correlations were found within the first<br />
six months [26],[27]; however, when considering the first<br />
two full years, Cot’s team found that natal levels <strong>of</strong> IgG<br />
specific to placental malarial VSAs negatively correlated<br />
with time to first infection and positively correlated with<br />
mean parasite density [25]. More studies <strong>of</strong> this nature<br />
are desirable to substantiate these findings.<br />
Infant Immunity and the NAI Interface<br />
Infants in highly endemic areas benefit from passively<br />
transferred VSA-specific IgG during their first few months<br />
<strong>of</strong> life [28]. The theories that explain this phenomenon<br />
may also help to explain why rates <strong>of</strong> severe disease and<br />
mortality from P. falciparum malaria are relatively low<br />
23
<strong>Biology</strong><br />
24<br />
in areas having the highest rates <strong>of</strong> parasite transmission,<br />
despite (or perhaps due to) the intense exposure to parasites<br />
[29]. Some studies suggest that the cumulative risk<br />
<strong>of</strong> malarial infection increases with decreasing endemicity<br />
a seemingly counterintutive hypothesis [30]. Immunity<br />
may be acquired without serious clinical consequences if<br />
sufficiently intense exposure occurs during the period <strong>of</strong><br />
passively transferred immunity [31]. Individuals who possess<br />
notable protective immunity typically exhibit high<br />
levels <strong>of</strong> IgG specific for VSA variants that are associated<br />
with severe malaria [23],[24],[32]. Thus, the infant’s levels<br />
<strong>of</strong> passively transferred IgG specific to severe malarial<br />
VSAs remain at protective levels for several months, during<br />
which the exposure gained in highly endemic areas<br />
may be sufficient to boost active immunity to at least partially<br />
protective levels. Higher transmission intensity can<br />
be expected not only to confer higher levels <strong>of</strong> passively<br />
transferred IgG specific to severe malarial VSAs, but also<br />
to speed the development <strong>of</strong> active immunity through<br />
exposure to parasites expressing such VSAs before the<br />
passively acquired IgG becomes fully catabolized, thus<br />
minimizing or even eliminating the window <strong>of</strong> opportunity<br />
for the parasites to cause severe illness. This window<br />
is expected to become shorter with increasing endemicity<br />
[28]. The relationships among intensity <strong>of</strong> exposure,<br />
conferral <strong>of</strong> passive immunity, and development <strong>of</strong> active<br />
immunity likely are much more complex than this simplified<br />
analysis suggests. Clues to this complexity can be<br />
seen in studies <strong>of</strong> the impact <strong>of</strong> maternal antibodies on the<br />
outcome <strong>of</strong> vaccination in infants [35].<br />
A similar line <strong>of</strong> thought may explain why the relatively<br />
few infections occurring in infants born to clinically<br />
immune mothers typically follow asymptomatic<br />
pathologies characterized by very low parasitemias. The<br />
infant’s IgG levels for severe malarial VSAs may be sufficient<br />
to effectively suppress parasites that express such<br />
VSAs for up to a year, while lower levels <strong>of</strong> IgG specific<br />
to uncomplicated malarial VSAs decay to non-protective<br />
levels early enough to permit some early-life infections<br />
producing few symptoms [30]. During this critical period,<br />
any parasites employing VSAs associated with severe<br />
symptoms may be suppressed through passive immunity<br />
while still helping the infant’s immune system to learn<br />
how to recognize future threats <strong>of</strong> this nature. Eventually<br />
the protective VSA-specific IgG decays to non-protective<br />
levels, allowing the parasites to express VSAs associated<br />
with severe illness while active immunity continues to develop,<br />
finally restricting the parasites’ expression <strong>of</strong> VSAs<br />
to those associated with uncomplicated malaria and thus<br />
elevating the child to the status <strong>of</strong> clinical immunity [28].<br />
This hypothesis can be tested through additional studies.<br />
One study has demonstrated that IgG from protected<br />
subjects cooperates efficiently with blood monocytes,<br />
whereas IgG from non-protected groups does not [34].<br />
Furthermore, non-protected subjects have antibodies to<br />
epitopes critical for protection, but these antibodies are<br />
nonfunctional. These results shed some light upon the<br />
long delay in reaching clinical immunity, clearly stressing<br />
the need to investigate immune responses in both qualitative<br />
and quantitative terms.<br />
The selective transfer <strong>of</strong> immunoglobulin isotypes<br />
may limit the protective effect <strong>of</strong> maternally derived antibodies,<br />
which may prevent the priming <strong>of</strong> specific cells<br />
in infants. Maternal antibodies may inhibit the child’s antibody<br />
production by interacting with B-cell receptors or<br />
with the idiotypic repertoire [35]. The complex relationships<br />
between endemicity and the vulnerability gap are<br />
believed to manifest themselves in widely varying patterns<br />
<strong>of</strong> disease outbreak.<br />
Transmission Heterogeneity and Unstable Hotspots<br />
Researchers in the field have found marked heterogeneity<br />
<strong>of</strong> transmission [36], which is expected to reduce<br />
the efficacy <strong>of</strong> disease control strategies [37]. To reduce<br />
overall transmission, researchers recommend that control<br />
measures be focused upon the “hotspots”, defined as localities<br />
ranging in size from a single household (in sparsely<br />
populated areas) to a kilometer or so (in more populous<br />
areas) in which the highest transmission rates are found<br />
to occur at any given time [36]. Malaria transmission has<br />
been found to exhibit such spatial heterogeneity on the<br />
household level [38]-[44], with implications <strong>of</strong> both genetic<br />
and environmental factors [38],[45].<br />
Environmental factors affecting malaria risk [46] include<br />
altitude [47], urbanization [48], cultivation practices<br />
[49], and distance from water [50]. Efforts to guide malaria<br />
control through ecological analysis have encountered<br />
difficulty with model complexity [51] and inconsistent<br />
effects <strong>of</strong> various ecological features among settings [52]<br />
as well as significant residual risk variation independent<br />
<strong>of</strong> the ecological data [53]. Additionally, remote sensing<br />
satellite data rarely provide resolution finer than 0.5–1 km<br />
[54], similar to the distances over which vector dispersion<br />
typically occurs as determined through studies <strong>of</strong><br />
mosquito behavior [55]-[58]. High-resolution geospatial<br />
analyses conducted in Uganda [42], Mali [41], Ethiopia<br />
[59], and Kenya [60],[61] have found malaria hotspots at<br />
this same scale.<br />
One study identified stable hotspots <strong>of</strong> asymptomatic<br />
parasitemia characterized by insignificantly higher mean<br />
antibody titers, a significantly lower mean age at febrile<br />
episodes, and significantly lower overall incidences <strong>of</strong><br />
febrile disease [62]. The incidence <strong>of</strong> febrile malaria increases<br />
significantly in the areas surrounding the hotspots<br />
<strong>of</strong> asymptomatic parasitemia, which remained stable over<br />
a full 7-year monitoring period. In contrast, hotspots <strong>of</strong><br />
scientia.nd.edu SCIENTIA Vol 2 - Spring 2011
febrile malaria were found to be unstable, not surviving<br />
past 3 years <strong>of</strong> monitoring. These observations suggest<br />
that a rapid acquisition <strong>of</strong> immunity in stable high transmission<br />
hotspots <strong>of</strong>fsets the high rates <strong>of</strong> febrile malaria<br />
that would otherwise result. Instead, a high prevalence <strong>of</strong><br />
asymptomatic parasitemia is seen [30]. Unstable hotspots<br />
are associated with no prior exposure, and hence relatively<br />
low levels <strong>of</strong> immunity, and therefore exhibit higher<br />
incidences <strong>of</strong> febrile disease.<br />
Although the unstable hotspots are directly associated<br />
with more febrile disease, stable hotspots <strong>of</strong> asymptomatic<br />
parasitemia may be critical in maintaining transmission<br />
because they maintain reservoirs <strong>of</strong> infected but asymptomatic<br />
individuals from whom the mosquitoes continually<br />
acquire gametocytes [63]. Both types <strong>of</strong> hotspots lend<br />
an essential balance necessary for disease persistence<br />
through transmission. The goal <strong>of</strong> vaccination strategies<br />
is to end this cycle by inoculating otherwise susceptible<br />
individuals who perpetuate the spread <strong>of</strong> infection.<br />
Immunization Challenges<br />
Global levels <strong>of</strong> P. falciparum malaria increased during<br />
the first decade <strong>of</strong> the 21st century due to a combination<br />
<strong>of</strong> drug-resistant parasites and insecticide-resistant<br />
mosquitoes. The disease has re-emerged in areas that previously<br />
had been malaria-free [64]. However, this same<br />
time period has seen reductions in mortality in many localities.<br />
Likely contributors to this trend include improving<br />
socioeconomic conditions, combination drug therapies,<br />
and insecticide-treated bed netting. Early evidence<br />
<strong>of</strong> resistance to artemisinin drug therapy has manifested<br />
itself through delayed parasite clearance times in western<br />
Cambodia. This is the same area where resistance to earlier<br />
antimalarial drugs such as chloroquine first appeared.<br />
Due to these concerns, the anti-malaria community is<br />
shifting its focus from sustained control toward eradication.<br />
This goal is unachievable with current materials and<br />
techniques; research and development <strong>of</strong> new diagnostic<br />
methods, drugs, and deployment strategies are needed,<br />
and more effective insecticides also would help to facilitate<br />
this goal.<br />
The task <strong>of</strong> developing an effective vaccine for malaria<br />
is daunting. The numerous factors to consider include<br />
parasite diversity, VSA variability and switching, and the<br />
complex interplay between endemicity and the natural<br />
immune response. The Plasmodium genus replicates rapidly,<br />
thereby increasing the probabilities <strong>of</strong> both transmission<br />
and immune system evasion. Treatments that reduce<br />
the parasite’s reproduction rate without full suppression<br />
have been found to exert a selective pressure favoring the<br />
development <strong>of</strong> drug resistance [63]. An ideal vaccine<br />
candidate would stimulate a more substantial immune response<br />
to the VSAs associated with the most severe ma-<br />
scientia.nd.edu SCIENTIA Vol 2 - Spring 2011<br />
<strong>Biology</strong><br />
larial symptoms. This would increase the rate <strong>of</strong> parasite<br />
clearance, thus reducing the duration <strong>of</strong> symptoms and<br />
elevating immunity against future attacks.<br />
The multicellular nature <strong>of</strong> a parasite introduces complexities<br />
<strong>of</strong> pathology beyond those <strong>of</strong> bacteria and viruses.<br />
The parasite’s complicated structure and life cycle<br />
pose challenges to vaccine development; however, Plasmodium’s<br />
distinct developmental stages <strong>of</strong>fer various opportunities<br />
for targeting antigens, thus potentially inducing<br />
immune responses at multiple levels [14]. A vaccine<br />
component targeting the hepatic phase would attack the<br />
invading sporozoites and could inhibit the development<br />
<strong>of</strong> merozoites in the hepatocytes through cytotoxic Tlymphocytic<br />
destruction <strong>of</strong> infected hepatic cells. A second<br />
vaccine component, targeting the erythrocytic phase,<br />
could prevent merozoitic multiplication or their invasion<br />
<strong>of</strong> erythrocytes. This component could target a multitude<br />
<strong>of</strong> symptomatic malarial VSAs, or it could block the<br />
process <strong>of</strong> erythrocyte adherence to blood vessel walls,<br />
which is believed to account for much <strong>of</strong> the clinical syndrome<br />
associated with malarial infection. Such a vaccine<br />
component would be expected to have prompt therapeutic<br />
benefits. Finally, a third vaccine component could target<br />
the parasite’s gametes, thus blocking the parasite’s sexual<br />
reproduction in the mosquito’s gut. This feature would<br />
help to eradicate the parasite from areas <strong>of</strong> low endemicity<br />
and could prevent the development and spread <strong>of</strong><br />
drug-resistant parasites. Such transmission-blocking behavior<br />
could become a key component <strong>of</strong> the eradication<br />
strategy. Resistance evolves very quickly in Plasmodium,<br />
potentially rendering any vaccine ineffective within a few<br />
generations. Therefore, it is essential that such transmission<br />
blockage be included with any new vaccine targeting<br />
the parasite’s other stages <strong>of</strong> development. The most<br />
effective strategy against Plasmodia may have to target<br />
multiple phases <strong>of</strong> its life cycle.<br />
A promising vaccine candidate currently undergoing<br />
clinical trials targets a circumsporozoite protein. The vaccine<br />
is genetically engineered to include the carboxyl terminus<br />
<strong>of</strong> the P. falciparum circumsporozoite antigen, a<br />
highly stable structure [65]. Known as RTS,S, the vaccine<br />
has demonstrated clinical effectiveness in terms <strong>of</strong> both<br />
infection and clinical malaria in both adults and children,<br />
a success that has been replicated multiple times [66]-<br />
[68]. Subsequent phase III trials have successfully tested<br />
the vaccine’s effectiveness in various geographic regions<br />
employing various transmission scenarios and may result<br />
in its general availability as early as 2012 [69].<br />
Future Perspectives<br />
To develop a vaccine <strong>of</strong> therapeutic and protective<br />
benefit against a parasite requires a novel approach, and<br />
to date there are no implemented vaccines that effectively<br />
25
<strong>Biology</strong><br />
26<br />
target a parasitic infection, although as noted above, some<br />
progress has been made toward that goal. The predominant<br />
focus so far has been on the use <strong>of</strong> sub-unit vaccines.<br />
The use <strong>of</strong> live, inactivated, or attenuated whole parasites<br />
is not feasible; therefore, antigenic particles, or subunits,<br />
are isolated from the parasite and tested for immunogenicity,<br />
i.e., the ability to elicit an immune response [65].<br />
Recent advances in the field <strong>of</strong> sub-unit vaccine development<br />
include the use <strong>of</strong> DNA vaccination. This<br />
approach involves removing sections <strong>of</strong> DNA from the<br />
parasitic genome and inserting those sequences into a<br />
vector such as a plasmid genome, attenuated DNA viral<br />
genomes, liposomes or proteoliposes, and other carrier<br />
complex molecules [68]. After inoculation the plasmid or<br />
attenuated virus is endocytosed into a parasitic cell, where<br />
the DNA sequence is incorporated into the parasite’s<br />
DNA and replicated by protein synthesis [65]. The resulting<br />
proteins are expressed on the cell surface membranes<br />
<strong>of</strong> the affected parasitic cell. By binding to the HLA molecules,<br />
these proteins prime the host’s T cells and create<br />
a population <strong>of</strong> memory T cells specific to the inoculated<br />
DNA subunit. This technique has produced a high rate <strong>of</strong><br />
T cell response but low levels <strong>of</strong> antibody production.<br />
DNA vaccines <strong>of</strong>fer several advantages over classical<br />
attenuated vaccines, including the ability to mimic MHC<br />
class 1 CD8+ T cell specific responses, which may reduce<br />
the safety concerns surrounding vaccine therapy. DNA<br />
vaccines also benefit from reduced production costs and<br />
increased ease <strong>of</strong> storage.<br />
In Gambian field trials <strong>of</strong> the previously mentioned<br />
RTS,S recombinant vaccine, researchers administered<br />
three repeat doses to each <strong>of</strong> 250 male volunteers during<br />
the six months prior to the time <strong>of</strong> greatest malaria transmission<br />
rates. During the first two months <strong>of</strong> follow-up,<br />
the vaccine was found to be effective at a level <strong>of</strong> approximately<br />
71%; the 95% confidence interval spanned from<br />
46% to 85%. However, during the final six weeks <strong>of</strong> the<br />
study, the effectiveness dropped to zero [67]. Subsequent<br />
analysis revealed that most <strong>of</strong> the control subjects had become<br />
infected during the latter weeks <strong>of</strong> the follow-up<br />
period; thus only the uninfected, and presumably more<br />
immune, control subjects were included in the comparison<br />
to inoculated test subjects [62]. Therefore, the vaccine’s<br />
apparent decrease in effectiveness was an artifact<br />
<strong>of</strong> its having been tested against an increasingly immune<br />
subset <strong>of</strong> control subjects and does not necessarily reflect<br />
an actual reduction. Another complicating factor was the<br />
expected increase in the rate <strong>of</strong> malaria transmission toward<br />
the end <strong>of</strong> the follow-up period as the time <strong>of</strong> peak<br />
transmission approached.<br />
The RTS,S vaccine shows promise as a means <strong>of</strong><br />
bridging the gap between passive and active immunity in<br />
very young children [69]. Even if it does not prove effec-<br />
tive over the long term, RTS,S may become an important<br />
component <strong>of</strong> more advanced vaccination strategies that<br />
target multiple stages <strong>of</strong> the Plasmodia life cycle. Such a<br />
complex and rapidly evolving organism needs a multiplepronged<br />
approach if we are to succeed in eradicating it<br />
from the global human population.<br />
Conclusion<br />
This summary <strong>of</strong> the current state <strong>of</strong> the antimalarial<br />
art provides a broad-brush overview <strong>of</strong> current field research<br />
findings, the theories that have been developed to<br />
explain those findings, and progress toward the development<br />
<strong>of</strong> effective vaccines. Considerably greater detail<br />
may be found in the cited papers. The knowledge gained<br />
through research continues to enhance our understanding<br />
<strong>of</strong> the Plasmodium genus and the challenges it poses<br />
to the human immune system. Vaccines based upon recombinant<br />
DNA currently show the greatest potential for<br />
success, but the goal <strong>of</strong> malaria eradication may require<br />
a multi-pronged strategy that attacks the parasite at multiple<br />
stages <strong>of</strong> its life cycle. This goal, which has proven<br />
elusive for many decades, now appears to be attainable in<br />
the 21st century. Although much work remains to be done,<br />
the progress made during the first decade <strong>of</strong> this century<br />
suggests that malaria research is on the right track.<br />
References<br />
[1] Garnham, P.C.C. “Malarial immunity in Africans: effects in<br />
infancy and early childhood.” Ann Trop Med Parasitol. 43, no. 1<br />
(April 1949): 47-61.<br />
[2] Bruce-Chwatt, I. J. “Malaria in African infants and children in<br />
Southern Nigeria.” Ann Trop Med Parasitol. 46, no. 2 (September<br />
1952): 173-200.<br />
[3] Kitua, A. Y., Smith, T., Alonso, P. L., Masanja, H., Urassa, H.,<br />
Menendez, C., Kimario, J., and Tanner, M. “Plasmodium falciparum<br />
malaria in the first year <strong>of</strong> life in an area <strong>of</strong> intense and perennial<br />
transmission.” Trop Med Int Hlth. 1, no. 4 (August 1996):<br />
475-484.<br />
[4] Steketee, R. W., Wirima, J. J., Slutsker, L., Heymann, D. L.,<br />
and Breman, J. G. “The problem <strong>of</strong> malaria and malaria control<br />
in pregnancy in sub-Saharan Africa.” Am J Med Hyg. 55, Suppl 1<br />
(1996): 2-7.<br />
[5] Chizzolini, C., Trottein, F., Bernard, F., and Kaufmann, M.<br />
“Isotypic analysis, antigen specificity, and inhibitory function <strong>of</strong><br />
maternally transmitted Plasmodium falciparum-specific antibodies<br />
in Gabonese newborns.” Am J Trop Med Hyg. 45, no. 1 (July<br />
1991): 57-64.<br />
[6] Desowitz, R. S., Elm, J., and Alpers, M. “Plasmodium falciparum-specific<br />
immunoglobulin G (IgG), IgM, and IgE antibodies<br />
in paired maternal-cord sera from East Sepik Province, Papua New<br />
Guinea.” Infect Immun. 61, no. 3 (March 1993): 988-93.<br />
scientia.nd.edu SCIENTIA Vol 2 - Spring 2011
[7] Lindsay, S. “Effect <strong>of</strong> pregnancy on exposure to malaria mosquitoes.”<br />
Lancet 355, no. 9219 (June 2000): 1972.<br />
[8] Van Geertruyden, J., Thomas, F., Erhart, A., and D’Alessandro,<br />
U. “The contribution <strong>of</strong> malaria in pregnancy to perinatal mortality.”<br />
Am J Trop Med Hyg. 71, Suppl 2 (August 2004): 35-40.<br />
[9] Rodriguez-Morales, A. J., Sanchez, E., Vargas, M., Piccolo,<br />
C., Colina, R., Arria, M., and Franco-Paredes, C. “Pregnancy outcomes<br />
associated with Plasmodium vivax malaria in northeastern<br />
Venezuela.” Am J Trop Med Hyg. 74, no. 5 (May 2006): 755-757.<br />
[10] Deloron, P., Dubois, B., Le Hesran, J. Y., Riche, D., Fievet,<br />
N., Cornet, M., Ringwald, P., and Cot, M. “Isotypic analysis <strong>of</strong> maternally<br />
transmitted Plasmodium falciparum-specific antibodies in<br />
Cameroon, and relationship with risk <strong>of</strong> P. falciparum infection.”<br />
Clin Exp Immunol. 110, no. 2 (November 1997): 212-218.<br />
[11] Eaton, B. M. and Contractor, S. F. “In vitro assessment <strong>of</strong> trophoblast<br />
receptors and placental transport mechanisms.” In: Redman,<br />
C. W. G., Sargent, I. L., Starket, P. M., eds. The human placenta.<br />
Oxford: Blackwell Scientific Publications (1993). 471-503.<br />
[12] Bledsoe, G. H. “Malaria primer for clinicians in the United<br />
States.” South Med J. 98, no. 12 (December 2005): 1197-1205 and<br />
1230.<br />
[13] Sturm, A., Rogerio, A., van de Sand, C., Regen, T., Retzlaff,<br />
S., Rennenberg, A., Krueger, A., Pollok, J. M., Menard, R., and<br />
Heussler, V. T. “Manipulation <strong>of</strong> host hepatocytes by the malaria<br />
parasite for delivery into liver sinusoids.” <strong>Science</strong> 313, no. 5791<br />
(September 2006): 1287-1290.<br />
[14] Chen, Q., Schlichtherle, M., and Wahlgren, M. “Molecular aspects<br />
<strong>of</strong> severe malaria.” Clin Microbiol Rev. 13, no. 3 (July 2000):<br />
439-50.<br />
[15] Adams, S., Brown, H., and Turner, G. “Breaking down the<br />
blood-brain barrier: signaling a path to cerebral malaria?” Trends<br />
in Parasitol. 18, no. 8 (August 2002): 360-366.<br />
[16] Brabin, B. “An analysis <strong>of</strong> malaria parasite rates in infants:<br />
40 years after MacDonald.” Trop. Dis. Bull. 87, no. 10 (1990):<br />
R1-R21.<br />
[17] Snow, R. W., Nahlen, B., Palmer, A., Donnelly, C. A., Gupta,<br />
S., and Marsh, K. “Risk <strong>of</strong> severe malaria among African infants:<br />
direct evidence <strong>of</strong> clinical protection during early infancy.” J. Infect.<br />
Dis. 177, no. 3 (March 1998): 819-822.<br />
[18] Logie, D. E., McGregor, I. A., Rowe, D. S., and Billewicz, W.<br />
Z. “Plasma immunoglobulin concentrations in mothers and newborn<br />
children with special reference to placental malaria: studies<br />
in the Gambia, Nigeria, and Switzerland.” Bull. WHO 49, no. 6<br />
(December 1973): 547-554.<br />
[19] Cohen, S., McGregor, I. A., and Carrington, S. “Gammaglobulin<br />
and acquired immunity to human malaria.” Nature 192<br />
(November 1961): 733-737.<br />
[20] Edozien, J. C., Gilles, H. M., and Udeozo, I. O. K. “Adult<br />
and cord-blood gammaglobulin and immunity to malaria in Nigerians.”<br />
Lancet 280, no. 7263 (November 1962): 951-955.<br />
scientia.nd.edu SCIENTIA Vol 2 - Spring 2011<br />
<strong>Biology</strong><br />
[21] Riley, E. M., Wagner, G. E., Akanmori, B. D., and Koram, K.<br />
A. “Do maternally acquired antibodies protect infants from malaria<br />
infection?” Parasite Immunol. 23, no. 2 (February 2001): 51-59.<br />
[22] Ofori, M. F., Dodoo, D., Staalsoe, T., Kurtzhals, J. A., Koram,<br />
K., Theander, T. G., Akanmori, B. D., and Hviid, L. “Malaria-induced<br />
acquisition <strong>of</strong> antibodies to Plasmodium falciparum variant<br />
surface antigens.” Infect. Immunol. 70, no. 6 (June 2002): 2982-<br />
2988.<br />
[23] Bull, P. C., Kortok, M., Kai, O., Ndungu, F., Ross, A., Lowe,<br />
B. S., Newbold, C. I., and Marsh, K. “Plasmodium falciparuminfected<br />
erythrocytes: agglutination by diverse Kenyan plasma is<br />
associated with severe disease and young host age.” J. Infect. Dis.<br />
182, no. 1 (June 2000): 252-259.<br />
[24] Nielsen, M. A., Staalsoe, C., Kurtzhals, J. A., Goka, B. Q.,<br />
Dodoo, D., Alifrangis, M., Theander, T. G., Akanmori, B. D., and<br />
Hviid, L. “Plasmodium falciparum variant surface antigen expression<br />
varies between isolates causing severe and non-severe malaria<br />
and is modified by acquired immunity.” J. Immunol. 168, no. 7<br />
(April 2002): 3444-3450.<br />
[25] Cot, M., Le Hesran, J. Y., Staalsoe, T., Fievet, N., Hviid, L.,<br />
and Deloron, P. “Maternally transmitted antibodies to pregnancyassociated<br />
variant antigens on the surface <strong>of</strong> erythrocytes infected<br />
with Plasmodium falciparum: relation to child susceptibility to<br />
malaria.” Am. J. Epidemiol. 157, no. 3 (February 2003): 203-209.<br />
[26] Wiener, A. S. “The half-life <strong>of</strong> passively acquired antibody<br />
globulin molecules in infants.” J. Exp. Med. 94, no. 3 (September<br />
1951): 213-221.<br />
[27] Zak, S. J. and Good, R. A. “Immunochemical studies <strong>of</strong> human<br />
serum gamma globulins.” J. Clin. Invest. 38, no. 3 (March<br />
1959): 579-586.<br />
[28] Hviid, L. and Staalsoe, T. “Malaria immunity in infants: a special<br />
case <strong>of</strong> a general phenomenon?” Trends in Parasitol. 20, no. 2<br />
(February 2004): 66-72.<br />
[29] Greenwood, B. M., Marsh, K., and Snow, R. W. “Why do<br />
some African children develop severe malaria?” Parasitol. Today<br />
7, no. 10 (October 1991): 277-281.<br />
[30] Snow, R. W., Omumbo, J. A., Lowe, B., Molyneux, C. S.,<br />
Obiero, J. O., Palmer, A., Weber, M. W., Pinder, M., Nahlen, B.,<br />
Obonyo, C., Newbold, C., Gupta, S., and Marsh, K. “Relation between<br />
severe malaria morbidity in children and level <strong>of</strong> Plasmodium<br />
falciparum transmission in Africa.” Lancet 349, no. 9066 (June<br />
1997): 1650-1654.<br />
[31] Snow, R. W., Gouws, E., Omumbo, J., Rapuoda, B., Craig, M.<br />
H., Tanser, F. C., le Sueur, D., and Ouma, J. “Models to predict the<br />
intensity <strong>of</strong> Plasmodium falciparum transmission: applications to<br />
the burden <strong>of</strong> disease in Kenya.” Trans R Soc Trop Med Hyg. 92,<br />
no. 6 (November-December 1998): 601-606.<br />
[32] Staalsoe, T., Nielsen, M. A., Vestergaard, L. S., Jensen, A. T.,<br />
Theander, T. G., and Hviid, L. “In vitro selection <strong>of</strong> Plasmodium<br />
falciparum 3D7 for expression <strong>of</strong> variant surface antigens associ-<br />
27
<strong>Biology</strong><br />
28<br />
ated with severe malaria in African children.” Parasite Immunol.<br />
25, nos. 8-9 (August-September 2003): 421-427.<br />
[33] Siegrist, C. A. “Mechanisms by which maternal antibodies<br />
influence infant vaccine responses: review <strong>of</strong> hypotheses and<br />
definition <strong>of</strong> main determinants.” Vaccine 21, no. 24 (July 2003):<br />
3406-3412.<br />
[34] Bouharou-Tayoun, H. and Druilhe, P. “Plasmodium falciparum<br />
malaria: evidence for an isotype imbalance which may be<br />
responsible for delayed acquisition <strong>of</strong> protective immunity.” Infect<br />
Immun. 60, no. 4 (April 1992): 1473-1481.<br />
[35] Carlier, Y. and Truyens, C. “Influence <strong>of</strong> maternal infection on<br />
<strong>of</strong>fspring resistance towards parasites.” Parasitol Today 11, no. 3<br />
(March 1995): 94-99.<br />
[36] Woolhouse, M. E., Dye, C., Etard, J. F., Smith, T., Charlwood,<br />
J. D., Garnett, G. P., Hagan, P., Hii, J. L. K., Ndhlovu, P. D., Quinnell,<br />
R. J., Watts, C. H., Chandiwana, S. K., and Anderson, R. M.<br />
“Heterogeneities in the transmission <strong>of</strong> infectious agents: implications<br />
for the design <strong>of</strong> control programs.” Proc Natl Acad Sci USA<br />
94, no. 1 (January 1997): 338-342.<br />
[37] Smith, D. L., Dush<strong>of</strong>f, J., Snow, R. W., and Hay S. I. “The<br />
entomological inoculation rate and Plasmodium falciparum infection<br />
in African children.” Nature 438 (November 2005): 492-495.<br />
[38] Mackinnon, M. J., Mwangi, T. W., Snow, R. W., Marsh, K.,<br />
and Williams, T. N. “Heritability <strong>of</strong> malaria in Africa.” PLoS Med.<br />
2, no. 12 (December 2005): e340.<br />
[39] Belizario, V. Y., Saul, A., Bustos, M. D., Lansang, M. A., Pasay,<br />
C. J., Gatton, M., and Salazar, N. P. “Field epidemiological<br />
studies on malaria in a low endemic area in the Philippines.” Acta<br />
Trop. 63, no. 4 (March 1997): 241-256.<br />
[40] Ghebreyesus, T. A., Haile, M., Witten, K. H., Getachew, A.,<br />
Yohannes, M., Lindsay, S. W., and Byass, P. “Household risk factors<br />
for malaria among children in the Ethiopian highlands.” Trans<br />
R Soc Trop Med Hyg. 94, no. 1 (January-February 2000): 17-21.<br />
[41] Gaudart, J., Poudiougou, B., Dicko, A., Ranque, S., Toure, O.,<br />
Sagara, I., Diallo, M., Diawara, S., Ouattara, A., Diakite, M., and<br />
Doumbo, O. K. “Space-time clustering <strong>of</strong> childhood malaria at the<br />
household level: a dynamic cohort in a Mali village.” BMC Public<br />
Health 6 (November 2006): 286.<br />
[42] Kreuels, B., Kobbe, R., Adjei, S., Kreuzberg, C., von Reden,<br />
C., Bäter, K., Klug, S., Busch, W., Adjei, O., and May, J. “Spatial<br />
variation <strong>of</strong> malaria incidence in young children from a geographically<br />
homogeneous area with high endemicity.” J Infect Dis. 197<br />
no. 1 (January 2008): 85-93.<br />
[43] Gamage-Mendis, A. C., Carter, R., Mendis, C., De Zoysa, A.<br />
P., Herath, P. R., and Mendis, K. N. “Clustering <strong>of</strong> malaria infections<br />
within an endemic population: risk <strong>of</strong> malaria associated with<br />
the type <strong>of</strong> housing construction.” Am J Trop Med Hyg. 45, no. 1<br />
(July 1991): 77-85.<br />
[44] Smith, D. L., McKenzie, F. E., Snow, R. W., and Hay, S. I.<br />
“Revisiting the basic reproductive number for malaria and its im-<br />
plications for malaria control.” PLoS Biol. 5, no. 3 (March 2007):<br />
e42.<br />
[45] Mwangi, T. W., Fega, G., Williams, T. N., Kinyanjui, S. M.,<br />
Snow, R. W., and Marsh, K. “Evidence for over-dispersion in the<br />
distribution <strong>of</strong> clinical malaria episodes in children.” PLoS ONE 3,<br />
no. 5 (May 2008): e2196.<br />
[46] Rogers, D. J., Randolph, S. E., Snow, R. W., and Hay, S. I.<br />
“Satellite imagery in the study and forecast <strong>of</strong> malaria.” Nature<br />
415, no. 6872 (February 2002): 710-715.<br />
[47] Reyburn, H., Mbatia, R., Drakeley, C., Bruce, J., Carneiro,<br />
I., Olomi, R., Cox, J., Nkya, W. M., Lemnge, M., Greenwood, B.<br />
M., and Riley, E. M. “Association <strong>of</strong> transmission intensity and<br />
age with clinical manifestations and case fatality <strong>of</strong> severe Plasmodium<br />
falciparum malaria.” JAMA 293, no. 12 (March 2005):<br />
1461-1470.<br />
[48] Hay, S. I., Guerra, C. A., Tatem, A. J., Atkinson, P. M., and<br />
Snow, R. W. “Urbanization, malaria transmission and disease burden<br />
in Africa.” Nat Rev Microbiol. 3, no. 1 (January 2005): 81-90.<br />
[49] Lindsay, S. W., Wilkins, H. A., Zieler, H. A., Daly, R. J., Petrarca,<br />
V., and Byass, P. “Ability <strong>of</strong> Anopheles gambiae mosquitoes<br />
to transmit malaria during the dry and wet seasons in an area <strong>of</strong><br />
irrigated rice cultivation in The Gambia.” J Trop Med Hyg. 94, no.<br />
5 (October 1991): 313-324.<br />
[50] Ghebreyesus, T. A., Haile, M., Witten, K. H., Getachew, A.,<br />
Yohannes, A. M., Yohannes, M., Teklehaimanot, H. D., Lindsay, S.<br />
W., and Byass, P. “Incidence <strong>of</strong> malaria among children living near<br />
dams in northern Ethiopia: community based incidence survey.”<br />
BMJ 319, no. 7211 (September 1999): 663-666.<br />
[51] Snow, R. W., Guerra, C. A., Noor, A. M., Myint, H. Y., and<br />
Hay, S. I. “The global distribution <strong>of</strong> clinical episodes <strong>of</strong> Plasmodium<br />
falciparum malaria.” Nature 434, no. 7030 (March 2005):<br />
214-217<br />
[52] Gemperli, A., Sogoba, N., Fondio, E., Mabaso, M., Bagayoko,<br />
M., Briët, O. J., Anderegg, D., Liebe, J., Smith, T., and Vounatsou,<br />
P. “Mapping malaria transmission in West and Central Africa.”<br />
Trop Med Int Health 11, no. 7 (July 2006): 1032-1046.<br />
[53] Kleinschmidt, I., Sharp, B., Mueller, I., and Vounatsou, P.<br />
“Rise in malaria incidence rates in South Africa: a small-area spatial<br />
analysis <strong>of</strong> variation in time trends.” Am. J. <strong>of</strong> Epidemiol. 155,<br />
no. 3 (February 2002): 257-264.<br />
[54] Hay, S. I. “An overview <strong>of</strong> remote sensing and geodesy for<br />
epidemiology and public health application.” Adv Parasitol. 47<br />
(2000): 1-35.<br />
[55] Thomas, C. J. and Lindsay, S. W. “Local-scale variation in<br />
malaria infection amongst rural Gambian children estimated by<br />
satellite remote sensing.” Trans R Soc Trop Med Hyg. 94, no. 2<br />
(March-April 2000): 159-163.<br />
[56] Midega, J. T., Mbogo, C. M., Mwnambi, H., Wilson, M. D.,<br />
Ojwang, G., Mwangangi, J. M., Nzovu, J. G., Githure, J. I., Yan,<br />
G., and Beier, J. C. “Estimating dispersal and survival <strong>of</strong> Anoph-<br />
scientia.nd.edu SCIENTIA Vol 2 - Spring 2011
eles gambiae and Anopheles funestus along the Kenyan coast by<br />
using mark-release-recapture methods.” J Med Entomol. 44, no. 6<br />
(November 2007): 923-929.<br />
[57] Thompson, R., Begtrup, K., Cuamba, N., Dgedge, M., Mendis,<br />
C., Gamage-Mendis, A., Enosse, S. M., Barreto, J., Sinden, R.<br />
E., and Hogh, B. “The Matola malaria project: a temporal and spatial<br />
study <strong>of</strong> malaria transmission and disease in a suburban area <strong>of</strong><br />
Maputo, Mozambique.” Am J Trop Med Hyg. 57, no. 5 (November<br />
1997): 550-559.<br />
[58] Bøgh, C., Linsay, S. W., Clarke, S. E., Dean, A., Jawara, M.,<br />
Pinder, M, and Thomas, C. J. “High spatial resolution mapping<br />
<strong>of</strong> malaria transmission risk in the Gambia, west Africa, using<br />
LANDSAT TM satellite imagery.” Am J Trop Med Hyg. 76, no. 5<br />
(May 2007): 875-881.<br />
[59] Yeshiwondim, A. K., Gopal, S., Hailemariam, A. T., Dengela,<br />
D. O., and Patel, H. P. “Spatial analysis <strong>of</strong> malaria incidence at<br />
the village level in areas with unstable transmission in Ethiopia.” J<br />
Health Geogr. 8, no. 5 (January 2009): 1-11.<br />
[60] Ernst, K. C., Adoka, S. O., Kowuor, D. O., Wilson, M. L., and<br />
John, C. C. “Malaria hotspot areas in a highland Kenya site are<br />
consistent are consistent in epidemic and non-epidemic years and<br />
are associated with ecological factors.” Malar J. 5, no. 78 (September<br />
2006): 1-10.<br />
[61] Brooker, S., Clarke, S., Njagi, J. K., Polack, S., Mugo, B., Estambale,<br />
B., Muchiri, E., Magnussen, P., and Cox, J. “Spatial clustering<br />
<strong>of</strong> malaria and associated risk factors during an epidemic in<br />
a highland area <strong>of</strong> western Kenya.” Trop Med Int Health 9, no. 7<br />
(July 2004): 757-766.<br />
[61] Bejon, P., Williams, T. N., Liliander, A., Noor, A. M., Wambua,<br />
J., Ogada, E., Olotu, A., Osier, F. H., Hay, S. I., Färnert, A.,<br />
and Marsh, K. “Stable and unstable malaria hotspots in longitudinal<br />
cohort studies in Kenya.” PLoS Med. 7, no. 7 (July 2010):<br />
e1000304.<br />
[63] Okell, L. C., Drakeley, C. J., Bousema, T., Whitty, C. J. M.,<br />
Ghani, A. C. “Modelling the impact <strong>of</strong> artemisinin combination<br />
therapy and long-acting treatments on malaria transmission intensity.”<br />
PLoS Med. 5, no. 11 (November 2008): e226.<br />
[64] Roestenberg, M., McCall, M., Hopman, J., Wiersma, J., Luty,<br />
A. J. F., van Gemert, G. J., van de Vegte-Bolmer, M., van Schaijk,<br />
B., Teelen, K., Arens, T., Spaarman, L., de Mast, Q., Roeffen, W.,<br />
Snounou, G., Rénia, L., van der Ven, A., Hermsen, C. C., and Sauerwein,<br />
R. “Protection against a malaria challenge by sporozoite<br />
inoculation.” N Engl J Med. 361, no. 5 (July 2009): 468-477.<br />
[65] Garcon, N., Heppner, D. G., and Cohen, J. “Development <strong>of</strong><br />
RTS,S/AS02: a purified subunit-based malaria vaccine candidate<br />
formulated with a novel adjuvant.” Expert Rev. Vaccines 2, no. 2<br />
(April 2003): 231-238.<br />
[66] Alonso, P. L., Sacarlal, J., Aponte, J. J., Leach, A., Macete,<br />
E., Milman, J., Mandomando, I., Spiessens, B., Guinovart, C.,<br />
Espasa, M., Bassat, Q., Aide, P., Ofori-Anyinam, O., Navia, M.<br />
M., Corachan, S., Ceuppens, M., Dubois, M. C., Demoitié, M.<br />
A., Dubovsky, F., Menéndez, C., Tornieporth, N., Ballou, W. R.,<br />
About the Author<br />
scientia.nd.edu SCIENTIA Vol 2 - Spring 2011<br />
<strong>Biology</strong><br />
Thompson,, R., Cohen, J. “Efficacy <strong>of</strong> the RTS,S/AS02A vaccine<br />
against Plasmodium falciparum infection and disease in young African<br />
children: randomised controlled trial.” Lancet 364, no. 9443<br />
(October 2004):1411-1420.<br />
[67] Bojang, K. A., Milligan, P. J., Pinder, M., Vigneron, L., Alloueche,<br />
A., Kester, K. E., Ballou, W. R., Conway, D. J., Reece,<br />
W. H., Gothard, P., Yamuah, L., Delchambre, M., Voss, G., Greenwood,<br />
B. M., Hill, A., McAdam, K. P., Tornieporth, N., Cohen, J.<br />
D., Doherty, T. “Efficacy <strong>of</strong> RTS,S/AS02 malaria vaccine against<br />
Plasmodium falciparum infection in semi-immune adult men in<br />
The Gambia: a randomised trial.” Lancet 358, no. 9297 (December<br />
2001): 1927-1934.<br />
[68] Bejon, P., Lusingu, J., Olotu, A., Leach, A., Lievens, M., Vekemans,<br />
J., Mshamu, S., Lang, T., Gould, J., Dubois, M. C., Demoitié,<br />
M. A., Stallaert, J. F., Vansadia, P., Carter, T., Njuguna, P.,<br />
Awuondo, K. O., Malabeja, A., Abdul, O., Gesase, S., Mturi, N.,<br />
Drakeley, C. J., Savarese, B., Villafana, T., Ballou, W. R., Cohen,<br />
J., Riley, E. M., Lemnge, M. M., Marsh, K., and von Seidlein, L.<br />
“Efficacy <strong>of</strong> RTS,S/AS01E vaccine against malaria in children 5 to<br />
17 months <strong>of</strong> age.” N Engl J Med 359, no. 24 (December 2008):<br />
2521-2532.<br />
[69] Moorthy, V. S. and Ballou, W. R. “Immunological mechanisms<br />
underlying protection mediated by RTS,S: a review <strong>of</strong> the<br />
available data.” Malaria Journal 8, no. 312 (December 2009): 1-7.<br />
A member <strong>of</strong> the Class <strong>of</strong> 2011, Annette Marie Ruth is<br />
a dual-degree candidate, graduating this spring with a B.S. in<br />
Biological <strong>Science</strong>s and a B.A. in Psychology. With regard<br />
to research, she is primarily interested in disease transmission<br />
models and their implications for developing effective<br />
vaccination strategies, especially with respect to pathogenic<br />
mutagenesis and serotype conversion. She also looks at the<br />
development and dynamics <strong>of</strong> naturally acquired immunity<br />
to various diseases among populations in areas <strong>of</strong> high endemicity<br />
and the protective role <strong>of</strong> maternal antibodies upon<br />
primary infection in infants. Annette plans to pursue graduate<br />
studies in global public health and to continue epidemiological<br />
research through to pr<strong>of</strong>essional school. She wishes to<br />
combine her research with work in the arena <strong>of</strong> public policy<br />
to help bridge the communication gap between scientists and<br />
policy makers, especially in developing nations.<br />
29
Physics<br />
30<br />
A Computational Method<br />
for Finding a Pattern<br />
in the Progenitor Systems<br />
<strong>of</strong> Type Ia Supernovae<br />
Julie Cass<br />
Advisor: Peter Garnavich<br />
<strong>University</strong> <strong>of</strong> <strong>Notre</strong> <strong>Dame</strong>, Department <strong>of</strong> Physics<br />
Abstract<br />
Supernovae are highly energetic stellar explosions<br />
that may be used as standard candles to measure distances<br />
in space (Phillips 1993). We present an analysis<br />
<strong>of</strong> a set <strong>of</strong> over 30 Type Ia supernovae (SNe Ia) from the<br />
Sloan Digital Sky Survey to find a pattern in their locations<br />
within their host galaxies. This analysis takes images<br />
<strong>of</strong> the supernovae from the Hubble Space Telescope<br />
(HST) and calculates the relative flux at the supernova<br />
position with respect to light from their host galaxies.<br />
Applying this method to the complete set <strong>of</strong> supernovae<br />
allows for an analysis <strong>of</strong> the regions that produce SNe<br />
Ia, indicating trends in the formation environments and<br />
leading to a deeper understanding <strong>of</strong> the nature <strong>of</strong> their<br />
progenitor systems. The goal <strong>of</strong> this project is to find a<br />
trend in either <strong>of</strong> these parameters, as this may <strong>of</strong>fer insight<br />
into the nature <strong>of</strong> the progenitor systems <strong>of</strong> SNe Ia.<br />
Introduction to SNe Ia<br />
SNe Ia are produced when a white dwarf star accretes<br />
enough mass, usually from a secondary star in a close binary<br />
system (or system <strong>of</strong> two nearby stars orbiting about<br />
their common center <strong>of</strong> mass) to produce a runaway nuclear<br />
reaction in its core. Each reaction rapidly sets <strong>of</strong>f a<br />
cascade <strong>of</strong> further reactions, resulting in a violent nuclear<br />
explosion [1]. As the star approaches the Chandrasekhar<br />
limit <strong>of</strong> approximately 1.4 Solar Masses the dwarf star<br />
shrinks, raising the temperature and density in the core,<br />
reigniting it in nuclear fusion. This causes a runaway nuclear<br />
reaction that releases enough nuclear energy to unbind<br />
the star in an explosion, called a Type Ia supernova.<br />
In general, supernovae are classified by the characteristics<br />
<strong>of</strong> their spectra. Those whose spectra lack hydrogen<br />
are classified as Type I Supernovae. SNe Ia are<br />
distinguished from other Type I SNe by their abundance<br />
<strong>of</strong> silicon. These spectral differences are indicative <strong>of</strong> a<br />
physical difference in the development <strong>of</strong> these exploding<br />
stars, evident also in their differences in progenitor<br />
systems. While Type Ib and Ic supernovae tend to occur<br />
in star-forming regions <strong>of</strong> spiral galaxies [2] and are thus<br />
associated with massive but short-lived stars, no trend in<br />
location for SNe Ia has been established.<br />
SNe Ia are important to astrophysics because they produce<br />
very consistent peak luminosities giving them characteristic<br />
light curves. Their exceptional brightness, along<br />
with these consistent light curves and common elemental<br />
abundances make them excellent candidates for standard<br />
candles used to measure the distances to their host galaxies<br />
[3]. The distance modulus relates the difference in apparent<br />
and true magnitude <strong>of</strong> a star to its distance by the<br />
following equation:<br />
m - M = 5 log (d) - 5 (Eq. 1)<br />
where m is the apparent magnitude, M is the true magnitude<br />
and d is the distance to the star in parsecs. Thus<br />
by using these bright and easily distinguishable stars, we<br />
have a standard candle for measuring the distance to the<br />
supernovae and therefore an estimate <strong>of</strong> the distance to its<br />
host galaxy.<br />
Project Motivation<br />
While SNe Ia are used as standard candles in many<br />
major astrophysical projects, such as the study <strong>of</strong> the expansion<br />
<strong>of</strong> the universe, there is a still uncertainty in the<br />
development process <strong>of</strong> these stars. While we know they<br />
<strong>of</strong>ten accrete mass from their binary partners, the exact<br />
mechanism for this process remains unclear and a pattern<br />
in their formation locations remains to be found. Searching<br />
for a pattern in the brightness <strong>of</strong> the SNe locations<br />
within their hosts may help us to establish a greater understanding<br />
<strong>of</strong> the progenitor systems for these supernovae.<br />
The brightness <strong>of</strong> the SNe locations relative to their<br />
hosts allows us to determine if they tend to occur in areas<br />
containing stars <strong>of</strong> large or small luminosities. From the<br />
bright blue glow <strong>of</strong> young stars we can determine if the<br />
supernova is in a star-forming area within the galaxy by<br />
considering the relative brightness and color at the position<br />
<strong>of</strong> the SN. This will allow us to constrain the range <strong>of</strong><br />
masses <strong>of</strong> white dwarfs that develop into SNe Ia.<br />
The SNe Targets<br />
The SNe targets used in this analysis were discovered<br />
by the Sloan Digital Sky Survey (SDSS). SDSS data was<br />
supplemented with higher resolution images from Hubble<br />
Space Telescope (HST). A compilation <strong>of</strong> the images<br />
from SDSS is shown in Figure 1. Figure 2 shows both the<br />
HST (larger image) and SDSS images <strong>of</strong> the same host<br />
SN host galaxy, displaying the significant difference in<br />
resolution between the resolution <strong>of</strong> the image from the<br />
SDSS ground-based telescope and HST.<br />
scientia.nd.edu SCIENTIA Vol 2 - Spring 2011
Figure 2.<br />
SDSS and HST images<br />
<strong>of</strong> SN13354<br />
host galaxy.<br />
Figure 1.<br />
Compilation <strong>of</strong> SDSS<br />
SNe (Image by Ben<br />
Dilday).<br />
Before the images were used for computational analysis,<br />
the cosmic ray hits had to be removed. When pixels are<br />
hit by cosmic rays in the detector they create areas ranging<br />
from one to several pixels <strong>of</strong> extremely high counts,<br />
making them appear extremely bright. These random high<br />
values are not actual light from the galaxies and were<br />
eliminated by filtering through use <strong>of</strong> two images <strong>of</strong> the<br />
galaxy. The remaining small portions <strong>of</strong> cosmic rays were<br />
removed using the “imedit” function <strong>of</strong> IRAF, replacing<br />
the inaccurate high pixel values at the cosmic ray hit locations<br />
with an average <strong>of</strong> the sky pixel values surrounding<br />
them.<br />
The Method: Fractional Flux Program<br />
An IDL program was written to determine the fractional<br />
flux <strong>of</strong> each SN relative to its host galaxy, using HST<br />
images <strong>of</strong> SDSS SNe Ia host galaxies. The fractional flux<br />
for each galaxy is calculated as follows:<br />
Fractional Flux =<br />
This method was used by [2], a study <strong>of</strong> long gamma ray<br />
bursts and SNe Ia. An outline <strong>of</strong> the program we developed<br />
will now be presented and the fractional flux method<br />
will be explained in greater detail.<br />
Smoothing<br />
In order to fully understand the results <strong>of</strong> our project,<br />
scientia.nd.edu SCIENTIA Vol 2 - Spring 2011<br />
Physics<br />
we needed to determine how the resolution <strong>of</strong> the host<br />
galaxy image affects the trend in SNe Ia fractional flux.<br />
We introduced a smoothing function to lower the resolution<br />
to one similar to the resolution <strong>of</strong> the images used in<br />
Kelly’s paper [2] in order to compare our results. First, a<br />
kernel is generated by creating a square 11x11 matrix <strong>of</strong><br />
float values. A FOR loop was then used to fill the elements<br />
<strong>of</strong> the matrix so that the greatest value was at the center <strong>of</strong><br />
the matrix and the values fall <strong>of</strong>f exponentially outwards.<br />
When the kernel was applied to the fits image, it adjusted<br />
each pixel to be a combination <strong>of</strong> its own value and the<br />
value <strong>of</strong> those pixels nearby, thus smoothing over the image.<br />
As the image was convolved, the center <strong>of</strong> the kernel<br />
scanned over the image, adjusting each pixel value. The<br />
pixel values were weighted mostly heavily by the initial<br />
value and the values <strong>of</strong> those pixels nearest it, with the<br />
farthest pixels contributing exponentially less. The sigma<br />
<strong>of</strong> this Gaussian kernel was set to one so that the center<br />
value and the values <strong>of</strong> those elements directly next to it<br />
would be weighted much more heavily than the rest.<br />
Displaying the Image for the User<br />
An important aspect <strong>of</strong> this program is ability <strong>of</strong> the<br />
user to interact directly with the image <strong>of</strong> each galaxy.<br />
The user can individually select the portion <strong>of</strong> each HST<br />
image to be used for the computation <strong>of</strong> the fractional flux<br />
to compare each individual SN location to the rest <strong>of</strong> its<br />
host galaxy.<br />
The image is scaled to make the galaxy more visible.<br />
First a value <strong>of</strong> 0.1 is added to a copy <strong>of</strong> the image<br />
to avoid having negative values (the display ranges from<br />
values <strong>of</strong> 0 to 255). The number <strong>of</strong> sky pixels and mean<br />
and median values <strong>of</strong> the image, and the values <strong>of</strong> all pixels<br />
with values less than ten times the median sky value<br />
are determined. These are used to calculate sigma for the<br />
sky as follows:<br />
where sky is the median image value and sky 2 contains<br />
all the locations where the pixel value is less than ten<br />
times the median sky value. The copy <strong>of</strong> the image to be<br />
displayed is then scaled by a factor containing this sigma<br />
and the median sky value to bring out the galaxy and<br />
make it more visible.<br />
The host galaxies for the supernovae are dim, so the<br />
display is set to invert the scaling <strong>of</strong> the images so that<br />
those pixels that are darkest or have the least counts (the<br />
sky) are displayed as white and brighter pixels (those <strong>of</strong><br />
the galaxy) appear in the gray to black range. This scaled<br />
and inverted image is then displayed to the user using the<br />
tv function <strong>of</strong> IDL. It is important to note that all adjustments<br />
described in this section regarding the size and<br />
31
Physics<br />
32<br />
scaling <strong>of</strong> the image are made to a copy <strong>of</strong> the image and<br />
not the image itself, so that the variable for the smoothed<br />
HST image is preserved.<br />
Computation <strong>of</strong> the Fractional Flux<br />
The smoothed Hubble image was converted to a subimage<br />
containing only the pixels that fell within the region<br />
specified by the user in the previous section. The minimum<br />
value <strong>of</strong> the remaining image was then subtracted<br />
from all pixels within the subimage to subtract <strong>of</strong>f (approximately)<br />
the contribution to the pixel values from the<br />
sky while keeping a positive value for all pixels.<br />
We are now ready to perform the calculation <strong>of</strong> the<br />
fractional flux. Equation 2 produces a weighted rank for<br />
the SN pixel, describing the brightness <strong>of</strong> the SN pixel<br />
relative to the rest <strong>of</strong> the galaxy weighing the relevance<br />
<strong>of</strong> each pixel by its brightness, to avoid driving the rank<br />
upward due to the large number <strong>of</strong> sky pixels. This rank<br />
will thus be a number ranging between 0 and 1 with lower<br />
values corresponding to lower relative fluxes <strong>of</strong> the<br />
SN, indicating that the SN occurred in a region <strong>of</strong> lower<br />
brightness, or possibly an region containing older stars. A<br />
high rank indicaties the SN may have occurred in a bright<br />
area <strong>of</strong> the galaxy, possibly indicating that it formed in a<br />
star-forming region.<br />
To calculate the fractional flux we calculated the denominator<br />
by finding the total <strong>of</strong> all pixel values in the<br />
subimage. A FOR loop was then used to find the numerator,<br />
summing the values <strong>of</strong> all pixels with values than the<br />
value <strong>of</strong> the SN pixel. Finally the numerator is divided by<br />
the denominator to find the fractional flux for this SN and<br />
its host galaxy. The program is now complete.<br />
Finding A Trend<br />
In order to determine a trend in the progenitor regions<br />
<strong>of</strong> these SNe the program was run for each <strong>of</strong> the SNe,<br />
generating a list <strong>of</strong> the fractional flux for each supernova<br />
and its host galaxy. A cumulative histogram <strong>of</strong> these fluxes<br />
was then plotted, with the fractional flux for the galaxy<br />
along the x-axis and the cumulative fraction <strong>of</strong> SNe with<br />
each flux running along the y-axis. We then plotted a cumulative<br />
histogram <strong>of</strong> the SNe Ia data from Kelly’s paper<br />
[2] along with our plot for comparison.<br />
Results and Discussion<br />
The cumulative plot <strong>of</strong> both these data sets is given below<br />
in Figure 3. The steeper line plotted below represents<br />
our data including a set <strong>of</strong> 34 supernovae with a smoothing<br />
sigma <strong>of</strong> 1. The Kelly dataset [2] includes 96 SNe Ia.<br />
It is apparent that the trends in our results differ greatly<br />
from that <strong>of</strong> Kelly et. al [2]. The greater slope <strong>of</strong> our<br />
line for lower fluxes indicates that we expect SNe Ia to<br />
avoid bright parts <strong>of</strong> the galaxy. The near-linearity <strong>of</strong> the<br />
fractional flux to cumulative fraction <strong>of</strong> supernovae from<br />
Kelly’s results [2] would indicate that there is an even distribution<br />
<strong>of</strong> SNe Ia developing in environment <strong>of</strong> various<br />
brightness/age. In other words, it would seem as though<br />
SNe Ia do not tend to occur in any particular region <strong>of</strong> a<br />
galaxy, their development is equally probable regardless<br />
<strong>of</strong> the location within the galaxy. Our results, however,<br />
seem to disagree. The much greater slope <strong>of</strong> the cumulative<br />
histogram for lower fractional flux values indicates<br />
that much more <strong>of</strong> our SNe fell in the range <strong>of</strong> having<br />
lower fractional fluxes. Our results indicate that SNe Ia<br />
are more likely to develop in progenitor system <strong>of</strong> low<br />
luminosity or regions <strong>of</strong> older stars, avoiding bright regions.<br />
If the stars take longer to develop into supernovae,<br />
this might indicate that supernovae develop from low<br />
mass stars that burn their fuel more slowly and have longer<br />
lifetimes than high mass stars.<br />
Figure 3. Cumulative Histogram <strong>of</strong> fractional flux in SNe Ia<br />
It is important to note that the value <strong>of</strong> sigma used in<br />
the smoothing made a noticeable difference in the numbers<br />
generated for our data. The fluxes would vary depending<br />
on sigma but not consistently; some fractional<br />
fluxes would increase while others would decrease. While<br />
the fluxes did not vary dramatically between sigmas <strong>of</strong> 2,<br />
3, and 4, the results for these numbers differed dramatically<br />
from the results using a sigma <strong>of</strong> 0.5. In the most<br />
extreme case, the flux <strong>of</strong> one supernova differed by over<br />
250%. Since the fractional fluxes did not always increase<br />
or always decrease with sigma, but merely changed dramatically<br />
between sigma <strong>of</strong> 0.5 and sigma <strong>of</strong> 2, we chose<br />
to plot our data vs. the Kelly data using a sigma <strong>of</strong> 1.<br />
One <strong>of</strong> the major differences between our study and the<br />
Kelly study [2] was the difference in resolution and the<br />
amount <strong>of</strong> smoothing, which seemed to have a noticeable<br />
difference in our results. Thus, we then investigate the affect<br />
<strong>of</strong> noise on the trend in fractional flux.<br />
Program for Study <strong>of</strong> Noise Dependence<br />
To study the true dependence <strong>of</strong> our fractional flux<br />
scientia.nd.edu SCIENTIA Vol 2 - Spring 2011
method on noise level we created a simulation by sampling<br />
a very well-resolved galaxy. The points were selected<br />
at random to see the effect <strong>of</strong> adding noise to the trend<br />
at point <strong>of</strong> varying fractional fluxes. To study this noise<br />
dependence, varying amounts <strong>of</strong> random noise were added<br />
to the image, with the fractional flux trend (cumulative<br />
histogram) analyzed for each degree <strong>of</strong> noise.<br />
The Simulation Host Galaxy<br />
The image we used for this simulation was an SDSS<br />
image <strong>of</strong> the galaxy NGC 2532, a nearby galaxy (redshift<br />
0.017) pictured in Figure 4.<br />
Figure 4. SDSS image <strong>of</strong> Galaxy NGC 2532. The above image<br />
depicts the galaxy selected for our simulation <strong>of</strong> fractional<br />
flux calculation with varying amounts <strong>of</strong> noise.<br />
This galaxy was chosen merely for the fact that its<br />
closeness allowed us to easily find a well-resolved and<br />
5a 5b 5c<br />
5d 5e 5f<br />
scientia.nd.edu SCIENTIA Vol 2 - Spring 2011<br />
Physics<br />
bright image <strong>of</strong> the galaxy. We controlled the amount <strong>of</strong><br />
the noise in the image by starting with an image <strong>of</strong> very<br />
low noise and adding our own simulated noise. The image<br />
was trimmed using the “imedit” function <strong>of</strong> IRAF so<br />
that, similarly to the user-designated regions <strong>of</strong> the HST<br />
galaxy images, we could calculate the fractional flux at<br />
various points using a region <strong>of</strong> the image containing as<br />
little extraneous sky pixels as possible.<br />
The Program Outline<br />
This program begins with the user inputting the test<br />
galaxy image. The x and y dimensions <strong>of</strong> the image are<br />
then obtained. The IDL function RANDOMU and these<br />
dimensions<br />
were then used to create a set <strong>of</strong> random x and y<br />
locations. Paired together, these random locations were<br />
used as the coordinates for the random pixels in the image<br />
whose fractional fluxes would be tested. We chose<br />
to analyze 100 such locations in order to ensure we were<br />
including a broad range <strong>of</strong> pixels (and therefore brightness)<br />
in our study.<br />
The program is then written to create a matrix <strong>of</strong> random<br />
noise to be added to the image. This was done by<br />
creating a 2D array <strong>of</strong> the same dimensions as the image<br />
<strong>of</strong> random numbers using the IDL function RANDOMN<br />
We could choose and adjust the amplitude <strong>of</strong> the noise<br />
added by multiplying the output <strong>of</strong> this random function<br />
by varying factors. This matrix is then added to the original<br />
image, adding a random amount to each pixel value<br />
and thus creating noise <strong>of</strong> a controllable amount. Images<br />
<strong>of</strong> the galaxy image with various magnitudes <strong>of</strong>f simu-<br />
FIGURE 5. Galaxy NGC 5235. The pictures above show the galaxy image used for our fractional flux simulations with varying<br />
amounts <strong>of</strong> noise added. The magnitudes <strong>of</strong> added noise for these images are 1, 5, 10, 15, 20 and 50 respectively.<br />
33
Physics<br />
34<br />
lated noise are given in Figures 5a-e.<br />
A 100-element array is then created to hold the calculated<br />
fractional fluxes for each <strong>of</strong> the random points.<br />
This is done in a FOR loop, calculating the flux at each<br />
point in the same way as in the previous program. The<br />
pixel values with values less than the pixel value <strong>of</strong> the<br />
random pixel or simulated SN location in question are<br />
summed and divided by the sum <strong>of</strong> the values <strong>of</strong> all pixels<br />
in the image. Once this has been done for each <strong>of</strong> the fake<br />
SN locations the array containing the fractional fluxes is<br />
used to generate a cumulative histogram <strong>of</strong> the fractional<br />
fluxes, just as for the real supernovae <strong>of</strong> various location<br />
brightness.<br />
The program was then run for various amplitudes <strong>of</strong><br />
noise, each with a fake SN sample size <strong>of</strong> 100. The same<br />
program was also run for these different cases but with an<br />
additional adjustment. The previous program description<br />
does not take into account the sky value as the other program<br />
did. Thus the program was run again but with first<br />
subtracting <strong>of</strong>f the minimum pixel value from the entire<br />
image to account sky value.<br />
Simulation Results and Discussion<br />
The analysis <strong>of</strong> several different noise amplitudes<br />
without subtracting <strong>of</strong>f the sky is shown in the histograms<br />
(Figure 6a-6f).<br />
All <strong>of</strong> these cases produce plots that show a more heavy<br />
distribution <strong>of</strong> SNe or pixel locations with low fractional<br />
fluxes, indicating a bias towards the dimmer areas <strong>of</strong> the<br />
galaxy or galaxies. However there is an interesting progression<br />
in these plots. While they are all nonlinear, they<br />
seem to approach linearity as the amount <strong>of</strong> noise is increased.<br />
The first curve, with noise amplitude <strong>of</strong> 1, is much<br />
more curved than the final plot with the drastic noise amplitude<br />
<strong>of</strong> 50. This would seem to indicate that when more<br />
noise is added our results change from indicating a bias<br />
towards dimmer locations within galaxies to no indication<br />
<strong>of</strong> any bias.<br />
This result is fitting with what we see in Figure 5. As<br />
more noise is added, the pixels tend to approach a similar<br />
value, with the image losing contrast as noise is increased.<br />
We can see this as the images in Figure 5 progress. The<br />
first image with almost no noise added has deep contrast<br />
between the galaxy and the surrounding sky values. In<br />
contrast the final image with an enormous amount <strong>of</strong><br />
noise (magnitude 50) has very little contrast with most<br />
<strong>of</strong> the image appearing gray. This result is reflected in the<br />
fractional flux. As noise is added the magnitude <strong>of</strong> the<br />
noise becomes increasingly more relevant. As this magnitude<br />
grows large, the values <strong>of</strong> the pixels converge and<br />
thus the fractional fluxes do the same. The skewing <strong>of</strong> our<br />
results based on the amount <strong>of</strong> noise added is consistent<br />
with the fact that the amount <strong>of</strong> smoothing in the study<br />
with real supernovae seemed to shift our fractional flux<br />
results.<br />
But before we begin to draw conclusions, it is interesting<br />
to also consider the plots from when we subtracted <strong>of</strong>f<br />
the minimum pixel value from the image and found the<br />
trends again. These plots are given in plots 7a-f.<br />
With the sky subtracted, we see that all noise amplitudes<br />
produce similar trends. They follow the same trend<br />
as the results from [2] showing a linear dependence or<br />
an unbiased distribution <strong>of</strong> fractional fluxes, regardless <strong>of</strong><br />
the amount <strong>of</strong> noise added to the image. Thus it seems<br />
that both the inclusion <strong>of</strong> the sky value and, in the case <strong>of</strong><br />
no sky subtraction, the degree <strong>of</strong> noise added both seem<br />
to affect the results <strong>of</strong> our study.<br />
Figure 6a. Noise Amplitude<br />
<strong>of</strong> 1, sky included<br />
Figure 6c. Noise Amplitude<br />
<strong>of</strong> 10, sky included<br />
Figure 6e. Noise Amplitude<br />
<strong>of</strong> 20, sky included<br />
Figures 6a-f. The above plots are cumulative histograms for<br />
the fractional flux at various random pixels with noise added.<br />
For these plots, the minimum pixel value was not removed from<br />
the image, so flux from the sky has been included in this data.<br />
The magnitude <strong>of</strong> added noise for each histogram is indicated<br />
beneath the individual plot.<br />
scientia.nd.edu SCIENTIA Vol 2 - Spring 2011<br />
Figure 6b. Noise Amplitude<br />
<strong>of</strong> 5, sky included<br />
Figure 6d. Noise Amplitude<br />
<strong>of</strong> 15, sky included<br />
Figure 6f. Noise Amplitude<br />
<strong>of</strong> 50, sky included
Figure 7a. Noise Amplitude<br />
<strong>of</strong> 1, sky included<br />
Figure 7c. Noise Amplitude<br />
<strong>of</strong> 10, sky included<br />
Figure 7e. Noise Amplitude<br />
<strong>of</strong> 20, sky included<br />
Figure 7b. Noise Amplitude<br />
<strong>of</strong> 5, sky included<br />
Figure 7d. Noise Amplitude<br />
<strong>of</strong> 15, sky included<br />
Figure 7f. Noise Amplitude<br />
<strong>of</strong> 50, sky included<br />
Figures 7a-f. The following plots are cumulative histograms<br />
for the fractional flux at various random pixels with noise<br />
added. For these plots, the minimum pixel value has been subtracted<br />
<strong>of</strong>f the image. The magnitude <strong>of</strong> added noise for each<br />
histogram is indicated beneath the individual plot.<br />
Conclusion and Plans for Further Study<br />
The results <strong>of</strong> analysis <strong>of</strong> the fractional fluxes <strong>of</strong><br />
SNe Ia seem to indicate that these SNe avoid bright regions<br />
<strong>of</strong> galaxies, developing in dim progenitor systems,<br />
probably containing mostly older stars. This contrasts with<br />
the results found in the work <strong>of</strong> Peter Kelly [2], which indicates<br />
that SNe Ia are more evenly distributed, showing<br />
no preference for any particular area within a galaxy. We<br />
developed the simulation program to determine whether<br />
our subtraction <strong>of</strong> the sky or the amount <strong>of</strong> noise in our<br />
HST images was causing the difference in our results. The<br />
simulations seem to both indicate that adding noise and<br />
subtracting the sky <strong>of</strong>f <strong>of</strong> a random distribution <strong>of</strong> locations<br />
within a galaxy should produce a linear cumulative<br />
scientia.nd.edu SCIENTIA Vol 2 - Spring 2011<br />
Physics<br />
histogram <strong>of</strong> fractional fluxes.<br />
Since the HST images are very noisy and the sky<br />
was subtracted <strong>of</strong>f <strong>of</strong> the images before completing our<br />
analysis, one would expect the fractional flux distribution<br />
to be pushed towards having this linearity in the cumulative<br />
histogram. Yet, looking at Figure 3 it is clear that this<br />
is not the case. It appears that our unexpected results were<br />
not merely the results <strong>of</strong> a faulty choice in the method <strong>of</strong><br />
determining the fractional flux trend. They may, in fact,<br />
be indicating the true progenitor systems <strong>of</strong> SNe Ia. We<br />
thus predict, based on this model, that SNe Ia may in fact<br />
prefer dimmer locations within galaxies. It remains that<br />
these predictions would disagree with the predictions<br />
from Kelly [2]. Thus, we may further strengthen our results<br />
and understanding <strong>of</strong> the trend in SNe Ia progenitor<br />
system brightness by continuing to run simulations in an<br />
effort to determine why our results differ.<br />
The results <strong>of</strong> this project seem to indicate that<br />
Type Ia Supernovae tend to develop in older or more dim<br />
progenitor systems, in contrast with the conclusions <strong>of</strong><br />
a similar study that predicts them to develop in bright,<br />
young systems. Investigating the reasons for the difference<br />
in our results to determine which model is more accurate<br />
will help us to understand more fully the progenitor<br />
systems <strong>of</strong> these stellar objects so important in current<br />
astrophysical studies.<br />
References<br />
[1] Whelan, J. and Iben, I. “Binaries and Supernovae <strong>of</strong> Type I”<br />
ApJ. 186, 1007. 1973.<br />
[2] Kelly, P., Kirshner, R.P. and Pahre, M. “Long Gamma Ray<br />
Bursts and Type 1c Core-Collapse Supernovae Have Similar<br />
Locations in Hosts”. ApJ. 687, 1201. 2008.<br />
[3] Phillips, M. “The Absolute Magnitudes <strong>of</strong> Type Ia Supernova”<br />
ApJ. 413, 105. 1993.<br />
About the Author<br />
Julie Cass is a junior at the <strong>University</strong> <strong>of</strong> <strong>Notre</strong> <strong>Dame</strong><br />
majoring in Physics with a concentration in Advanced Physics.<br />
Julie first became involved in physics research in her<br />
sophomore year, working with Pr<strong>of</strong>essor Peter Garnavich on<br />
the study <strong>of</strong> Type Ia Supernovae described in this paper. In<br />
the following summer, Julie participated in the 2010 <strong>University</strong><br />
<strong>of</strong> Washington Physics REU, working with the Pr<strong>of</strong>essor<br />
Markus Raschke group in nano-optics research. Julie is currently<br />
working in the campus Nuclear Structure Laboratory<br />
with Pr<strong>of</strong>essor Ani Aprahamian, helping to design and implement<br />
a cooling system for detectors in the new St. George<br />
recoil mass separator. In the summer <strong>of</strong> 2011 Julie will be<br />
participating in the SULI undergraduate research program<br />
at the Stanford Linear Accelerator Center (SLAC) at Stanford<br />
<strong>University</strong>. Following her graduation from <strong>Notre</strong> <strong>Dame</strong><br />
in 2012, Julie plans to attend graduate school to pursue her<br />
Ph.D. in physics.<br />
35
Physics<br />
36<br />
An Examination <strong>of</strong><br />
Possible Gravitational<br />
Perturbations in the<br />
Transit Timing<br />
Variations <strong>of</strong> Exoplanet<br />
WASP-3b<br />
Colin Littlefield<br />
Advisor: Peter Garnavich<br />
<strong>University</strong> <strong>of</strong> <strong>Notre</strong> <strong>Dame</strong>, Department <strong>of</strong> Physics<br />
Abstract<br />
In a 2010 paper, Maciejewski et al. claimed to have<br />
detected a possible sinusoidal variation in the transit timing<br />
variations <strong>of</strong> exoplanet WASP-3b [1], which is currently<br />
the only known planet orbiting the star WASP-3.<br />
According to Maciejewski’s analysis, this signal might be<br />
the consequence <strong>of</strong> gravitational perturbations caused by<br />
a hypothetical second exoplanet in the WASP-3 system. I<br />
report five transit timing variation measurements from the<br />
summer <strong>of</strong> 2010 which provide modest support for Maciejewski’s<br />
proposed sinusoidal signal.<br />
Introduction<br />
Exoplanet transits are eclipses which occur when a<br />
planet orbiting another star passes directly between that<br />
star and the Earth. Although no current telescope can actually<br />
resolve the miniscule silhouette <strong>of</strong> the planet against<br />
its star, it is possible to detect the small fade produced as<br />
the planet blocks some <strong>of</strong> the light <strong>of</strong> its star from reaching<br />
Earth. Transits for a particular exoplanet occur at very<br />
regular intervals, and by examining a planet’s transit timing<br />
variations (TTVs)—i.e., how early or late each transit<br />
occurs—it is theoretically possible to detect the effects <strong>of</strong><br />
gravitational perturbations from other exoplanets in the<br />
same system.<br />
Maciejewski’s group observed six transits <strong>of</strong> exoplanet<br />
WASP-3b and combined them with eight others from previous<br />
publications. They found a statistically significant<br />
sinusoidal signal in the fourteen TTVs, which spanned a<br />
period over three years. Maciejewski found that the data<br />
are consistent with gravitational perturbations caused by<br />
a hypothetical second planet, WASP-3c, with about 15<br />
Earth masses in a 2.02:1 orbital resonance with respect<br />
to WASP-3b—very close to a stable 2:1 resonance. They<br />
predict that such a planet would be difficult to detect via<br />
radial velocity measurements because WASP-3’s minute<br />
oscillations would obfuscate WASP-3c’s weak radial velocity<br />
signature.<br />
To test Maciejewski’s claim, retired pr<strong>of</strong>essional astronomer<br />
Bruce Gary calculated WASP-3 TTVs from<br />
dozens <strong>of</strong> amateur observations in the Amateur Exoplanet<br />
Archive, his database <strong>of</strong> amateur exoplanet transit observations<br />
[2]. He concluded that there was little evidence <strong>of</strong><br />
sinusoidal variation in the amateur TTVs, many <strong>of</strong> which<br />
had relatively high uncertainties. Gary’s procedure required<br />
each observer to perform basic data analysis, such<br />
as rejection <strong>of</strong> outlier data and reference star selection,<br />
potentially injecting some measure <strong>of</strong> subjectivity into the<br />
process. Consequently, even though Gary performed the<br />
final analysis, it might not be appropriate to compare observations<br />
between different amateur observers, and his<br />
analysis <strong>of</strong> amateur WASP-3 observations is not necessarily<br />
conclusive.<br />
Materials and Methods<br />
I observed five WASP-3b transits using an 11-inch<br />
Schmidt-Cassegrain telescope and a CCD camera at the<br />
observatory at the Jordan Hall <strong>of</strong> <strong>Science</strong>. Before each<br />
observing session, I synchronized the computer’s time<br />
with Micros<strong>of</strong>t’s Internet time server. I then took a continuous<br />
series <strong>of</strong> unfiltered images <strong>of</strong> WASP-3, spanning<br />
the length <strong>of</strong> the eclipse. When possible, I also obtained<br />
several hours <strong>of</strong> data before and after the transit in order<br />
to better characterize systematic errors. For example, the<br />
star’s magnitude should theoretically remain constant outside<br />
<strong>of</strong> transit, but in practice, it will usually vary slightly<br />
as a function <strong>of</strong> the star’s changing airmass if the target<br />
and reference stars are different colors. After each observing<br />
session, I reduced the data by applying flat fields and<br />
dark frames before performing aperture photometry to<br />
measure the fluxes <strong>of</strong> WASP-3 and twenty nearby reference<br />
stars. To account for night-to-night differences in the<br />
point-spread function <strong>of</strong> the stars, I used different aperture<br />
sizes for each session in an effort to maximize the<br />
quality <strong>of</strong> the photometry.<br />
In order to derive estimates <strong>of</strong> important transit parameters,<br />
especially the time <strong>of</strong> midtransit, I used an advanced<br />
spreadsheet designed by Gary for analyzing photometry<br />
<strong>of</strong> exoplanet transits [3]. Caltech’s NASA Star and<br />
Exoplanet Database, which subsumed Gary’s database in<br />
2010, has specifically endorsed Gary’s procedure, which<br />
determines the best-fit model for each transit through chisquare<br />
minimization [4]. This process produced estimates<br />
<strong>of</strong> a variety <strong>of</strong> important transit parameters, including<br />
midtransit time, along with the corresponding uncertainties.<br />
To determine the expected time <strong>of</strong> midtransit, I adopted<br />
Maciejewski’s ephemeris <strong>of</strong><br />
TC(E) = 2454605.56000 [BJD] + E × (1.8468355 days).<br />
scientia.nd.edu SCIENTIA Vol 2 - Spring 2011
The TTV is simply the difference between the predicted<br />
and observed times <strong>of</strong> midtransit. Table 1 lists my<br />
individual TTV estimates.<br />
Table 1. Individual TTV Estimates<br />
Since Maciejewski’s ephemeris and subsequent TTV<br />
measurements relied upon the Barycentric Julian Date<br />
(BJD) reference frame and terrestrial time (TT) time standard,<br />
it was necessary to convert my data into a comparable<br />
time stamp. To accomplish this, I found the midtransit<br />
time in Julian Date and converted it to the BJD frame <strong>of</strong><br />
reference using the barycentric dynamical time standard<br />
(TBD) with the assistance <strong>of</strong> an online conversion utility<br />
[5]. BJD_TT and BJD_TBD adopt the solar system’s<br />
barycenter as their frame <strong>of</strong> reference, and according to<br />
Eastman, they vary from each other by no more than 50<br />
milliseconds, an insignificant difference for TTV analysis<br />
[6]. These extremely accurate time stamps compensate<br />
for a variety <strong>of</strong> factors, such as Earth’s orbital motion and<br />
gravitational perturbations from other planets in the solar<br />
system, which would otherwise taint TTV data due to the<br />
finite speed <strong>of</strong> light.<br />
Results<br />
I combined my data with Maciejewski’s and fitted it<br />
with several different chi-square models. A purely linear<br />
fit was quite poor, producing statistically insignificant coefficients<br />
and a χ2 <strong>of</strong> 64.3 with 17 degrees <strong>of</strong> freedom.<br />
The resulting p-value <strong>of</strong> 2.0 × 10⁻⁷ suggests an unacceptable<br />
fit to the data. I then fit a three-parameter sinusoid to<br />
the data, retaining the linear term because an inaccurate<br />
ephemeris would manifest itself as a linear variation in<br />
the TTV plot. I found that the combined data exhibited a<br />
sinusoidal variation with a period <strong>of</strong> 125.9 ± 0.4 days with<br />
a full amplitude <strong>of</strong> 3.4 ± 0.6 minutes. Furthermore, my<br />
analysis calls for a slightly refined ephemeris for WASP-<br />
3b, including a longer orbital period. Table 2 summarizes<br />
the parameters <strong>of</strong> my best-fit model, including my proposed<br />
ephemeris.<br />
Maciejewski proposes both short- and long-term sinusoidal<br />
variation in the TTV data, so I performed the analysis<br />
again, allowing for two independent sinusoids. With-<br />
scientia.nd.edu SCIENTIA Vol 2 - Spring 2011<br />
Table 2. Best-Fit Model<br />
Physics<br />
out a linear term, the double sinusoid model produced a<br />
strong fit; however, once I included the requisite linear<br />
function to account for possible errors in the ephemeris,<br />
χ2red plummeted from a nearly ideal 1.05 (χ2 =13.62, 13<br />
df) to just 0.5 (χ2 = 5.5, 11 df), indicating a serious overfit<br />
<strong>of</strong> the data. The extremely low χ2red reflects that the total<br />
number <strong>of</strong> parameters in that model ballooned to eight,<br />
an ungainly number for just nineteen observations. Thus,<br />
I rejected this model, though I was reluctant to do so because<br />
Maciejewski’s computational models predicted<br />
that WASP-3c would cause two separate periodicities in<br />
WASP-3b’s TTVs.<br />
Discussion<br />
My observations provide equivocal support for Maciejewski’s<br />
hypothesis. However, five closely-spaced observations<br />
with a small-aperture telescope are insufficient<br />
to provide convincing support for Maciejewski’s sinusoidal<br />
model, which includes high-quality data obtained<br />
over a span <strong>of</strong> over three years. Additional observations<br />
would permit a more rigorous characterization <strong>of</strong> the TTV<br />
<strong>of</strong> WASP-3b, including an examination <strong>of</strong> whether there<br />
is a second periodicity in the TTV plot.<br />
One concern is that several <strong>of</strong> Maciejewski’s TTV<br />
estimates between BJD 2454900 and 2455100 are somewhat<br />
inconsistent with my fit. The residuals for these<br />
observations were much smaller for the double sinusoid<br />
model, but for reasons already discussed, I decided that a<br />
single periodicity best represented the data. Additionally,<br />
Maciejewski’s published TTV estimate for BJD 2455102<br />
is apparently incorrect. I used Maciejewski’s ephemeris<br />
and estimated midtransit times to verify the published<br />
TTV estimates, and the BJD 2455102 datum showed the<br />
only discrepancy. The most likely explanation is a misprint<br />
<strong>of</strong> that one TTV estimate, and I was able to calculate<br />
the correct TTV using other data in Maciejewski’s paper.<br />
The data quality for my June 4 observations left much<br />
to be desired, potentially making that TTV estimate unreliable.<br />
Jordan Hall is a notoriously vibration-prone building,<br />
and that night, high-frequency vibrations distorted<br />
the star images into elongated streaks. In some <strong>of</strong> the<br />
worst images, star images were over 13 arcseconds long.<br />
To put this into perspective, star images at Jordan Hall<br />
are normally circular and no larger than 5 arcseconds in<br />
37
Physics<br />
38<br />
diameter, even on a night <strong>of</strong> poor seeing. In light <strong>of</strong> this<br />
problem, it is prudent to be somewhat skeptical <strong>of</strong> the accuracy<br />
<strong>of</strong> this particular TTV measurement.<br />
On a final note, Maciejewski predicts that the hypothetical<br />
second planet would produce a transit depth <strong>of</strong><br />
up to 0.35% if it undergoes transits. Although I did detect<br />
a barely significant, 0.3% fade in the flux <strong>of</strong> WASP-3 on<br />
August 1, 2010, my own follow-up observations strongly<br />
suggest that this feature was spurious, a product <strong>of</strong> a common<br />
systematic error, such as an imperfect flat-field. My<br />
experience suggests that while the equipment at Jordan<br />
Hall is just capable <strong>of</strong> detecting a transit depth <strong>of</strong> 0.3%<br />
under ideal conditions, it is extremely easy for any number<br />
<strong>of</strong> errors to produce false “transits” <strong>of</strong> that depth.<br />
Figure 1. The best-fit, two-periodicity sinusoidal model, with<br />
TTV estimates superimposed. The TTV is represented in minutes.<br />
The yellow symbols represent my data, while the rest are<br />
the mix <strong>of</strong> observations—both original and previously published—used<br />
by Maciejewski. The six clear symbols are Maciejewski’s<br />
original observations, whereas the seven gray symbols<br />
and the lone black diamond represent data from various<br />
publications cited by Maciejewski. Below are residuals from<br />
the fit.The revised ephemeris used for these plots is provided<br />
in Table 2.<br />
On a final note, Maciejewski and his team predict that<br />
the hypothetical second planet would produce a transit<br />
depth <strong>of</strong> up to 0.35% if it transits WASP-3. Although I did<br />
detect a barely significant, 0.3% fade in the flux <strong>of</strong> WASP-<br />
3 on August 1, 2010, my own follow-up observations<br />
strongly suggest that this feature was spurious, a product<br />
<strong>of</strong> a common systematic error, such as an imperfect flatfield.<br />
My experience suggests that while the equipment at<br />
Jordan Hall is just capable <strong>of</strong> detecting a transit depth <strong>of</strong><br />
0.3% under ideal conditions, it is extremely easy for any<br />
number <strong>of</strong> errors to produce false “transits” <strong>of</strong> that depth.<br />
Conclusion<br />
Between June and September in 2010, I observed<br />
five transits <strong>of</strong> WASP-3b, and my data, when analyzed<br />
in conjunction with previously published observations,<br />
suggests that there is indeed significant sinusoidal variation<br />
in WASP-3b’s TTVs. Plainly, nineteen combined observations<br />
do not provide a very large sample size, and<br />
more observations are necessary to explore this possibility.<br />
Nevertheless, there appears to be considerable, albeit<br />
inconclusive, evidence that a second, undiscovered exoplanet<br />
is perturbing WASP-3b.<br />
Acknowledgements<br />
I wish to thank Pr<strong>of</strong>essor Peter Garnavich for his<br />
guidance with this project. Additionally, my research<br />
was subsidized in part by an AL/SCI UROP grant from<br />
<strong>Notre</strong> <strong>Dame</strong>’s Institute for Scholarship in the Liberal<br />
Arts<br />
References<br />
[1] G. Maciejewski, D. Dimitrov, R. Neuhäuser, A. Niedzielski, St.<br />
Raetz, Ch. Ginski, Ch. Adam, C. Marka, M. Moualla, and M. Mugrauer.<br />
and others, “Transit Timing Variation in Exoplanet WASP-<br />
3b,” Monthly Notices <strong>of</strong> the Royal Astronomical Society, 407, no.<br />
4 (2010): 2625-2631, http://arxiv.org/abs/1006.1348v1.<br />
[2] Bruce Gary, WASP-3 AXA Light Curves, http://brucegary.net/<br />
AXA/WASP3/wasp3.htm.<br />
[3] Bruce Gary, Spreadsheets, http://brucegary.net/book_EOA/xls.<br />
htm.<br />
[4] NASA/IPAC/NExScI, Star and Exoplanet Database, Summary<br />
Details for Amateur Light Curves, http://nsted.ipac.caltech.edu/<br />
NStED/docs/datasethelp/AXA.html.<br />
[5] Jason Eastman, Barycentric Julian Date, http://astroutils.astronomy.ohio-state.edu/time/utc2bjd.html.<br />
[6] Jason Eastman, Robert Siverd, and B. Scott Gaudi, “Achieving<br />
Better Than 1 Minute Accuracy in the Heliocentric and Barycentric<br />
Julian Dates,” Publications <strong>of</strong> the Astronomical Society <strong>of</strong> the Pacific<br />
122, No. 894 (2010): 935-946, http://arxiv.org/abs/1005.4415.<br />
[7] The parameters were amplitude, period, and phase.<br />
About the Author<br />
A senior majoring in political science and minoring in<br />
peace studies, Colin Littlefield has been an avid amateur astronomer<br />
for over ten years. Due in large part to the generosity<br />
<strong>of</strong> <strong>Notre</strong> <strong>Dame</strong>’s astrophysics faculty—especially Pr<strong>of</strong>essors<br />
Garnavich and Rettig—he has taken advantage <strong>of</strong> the<br />
opportunity to move beyond visual astronomy and engage in<br />
research projects while at <strong>Notre</strong> <strong>Dame</strong>.<br />
scientia.nd.edu SCIENTIA Vol 2 - Spring 2011
Proceedings <strong>of</strong> Scientia<br />
Pr<strong>of</strong>. Seth Brown<br />
Department <strong>of</strong> Chemistry<br />
and Biochemistry<br />
The Unlinkable Moly/Brown?<br />
Notes from an Ongoing<br />
Conversation<br />
Pr<strong>of</strong>. Shaun Lee<br />
Department <strong>of</strong> Biological <strong>Science</strong>s<br />
Biosynthesis <strong>of</strong> Streptolysin S:<br />
Uncovering a New Class <strong>of</strong><br />
“WMDs” (Weapons <strong>of</strong> Microbial<br />
Destruction)<br />
Pr<strong>of</strong>. Gregory Crawford<br />
William K. Warren II Foundation<br />
Dean <strong>of</strong> the <strong>College</strong> <strong>of</strong> <strong>Science</strong><br />
Scientific Research at <strong>Notre</strong> <strong>Dame</strong><br />
Pr<strong>of</strong>. Philippe Collon<br />
Department <strong>of</strong> Physics<br />
The Nuclear <strong>Science</strong> Lab:<br />
Probing into the Heart <strong>of</strong> Stars<br />
Pr<strong>of</strong>. Patricia Champion<br />
Department <strong>of</strong> Biological <strong>Science</strong>s<br />
Understanding Tuberculosis from<br />
the Inside Out: Virulence Factor<br />
Export from Pathogenic Mycobacteria<br />
September 30, 2010<br />
Jake Pardo<br />
Physics and<br />
Honors Mathematics ‘11<br />
Knot Fun<br />
November 11, 2010<br />
November 29, 2010<br />
February 27, 2011<br />
March 31, 2011<br />
Ching-Ting Hwang<br />
Biological <strong>Science</strong>s ‘12<br />
Applications <strong>of</strong> High-Precision<br />
Laster Spectroscopy<br />
Paul Baranay<br />
Biological <strong>Science</strong>s and<br />
Applied Mathematics ‘12<br />
Computational <strong>Biology</strong> in Action:<br />
Applications for Malaria and<br />
Breast Cancer<br />
Holden Lombard<br />
Physics in Medicine and<br />
Anthropology ‘13<br />
Using XRF Imaging to Analyze<br />
Artifacts and Reconstruct Civilizations<br />
Kevin McDermott<br />
and Shannon<br />
Hughes<br />
Physics ‘13<br />
Quick-Wit Trackers<br />
and the Compact<br />
Muon Solenoid<br />
39
40<br />
About Scientia<br />
If the doors <strong>of</strong> perception were cleansed everything<br />
would appear to man as it is, infinite.<br />
–William Blake<br />
The goals <strong>of</strong> Scientia are threefold: first, to recognize and encourage highquality<br />
undergraduate research. The papers published in this volume represent commendable<br />
persistence and bold thinking. They were selected for their demonstration<br />
<strong>of</strong> excellence in data, novelty, and quality.<br />
Second, to provide a forum through which students can gain experience <strong>of</strong><br />
the essential skills <strong>of</strong> writing and reviewing to fulfill their future pr<strong>of</strong>essional goals.<br />
Scientia’s editorial board, comprised <strong>of</strong> students from every department and grade<br />
level in the <strong>College</strong>, has reviewed and edited over thirty papers in our two years. We<br />
hope to double this number during the upcoming year.<br />
Finally, Scientia strives to contribute to the advancement and cohesiveness <strong>of</strong><br />
<strong>Notre</strong> <strong>Dame</strong>’s scientific community <strong>of</strong> which undergraduates are part. Scientia is Latin<br />
for “knowledge,” and our publication serves not only to display but also to encourage<br />
the collective pursuit <strong>of</strong> truth that first takes form at the undergraduate level. To<br />
this end, we celebrate curiosity-driven research as a means to further knowledge for,<br />
as Albert Einstein said, while “knowledge is limited to all we now know and understand…<br />
imagination embraces the entire world, and all there ever will be to know and understand.”
Visit<br />
Read past articles, browse new ones, and<br />
submit your own research online at<br />
http://scientia.nd.edu.<br />
For more information about undergraduate<br />
research at the <strong>University</strong><br />
<strong>of</strong> <strong>Notre</strong> <strong>Dame</strong>, visit<br />
http://science.nd.edu/undergradresearch.<br />
Contact<br />
Email questions or comments to the editors<br />
at scientia@nd.edu.<br />
Join<br />
Get involved with Scientia as an editor, news<br />
columnist, or graphic designer for the<br />
upcoming semester.<br />
Email for details.